EUROPEAN ORGANIZATION FOR NUCLEAR RESEARCH (CERN)
CERN-EP/2016-078 2016/10/18
CMS-TOP-14-012
Measurement of the integrated and differential tt
production cross sections for high-p
Ttop quarks in pp
collisions at
√
s
=
8 TeV
The CMS Collaboration
∗Abstract
The cross section for pair production of top quarks (tt) with high transverse mo-menta is measured in pp collisions, collected with the CMS detector at the LHC with √s = 8 TeV in data corresponding to an integrated luminosity of 19.7 fb−1. The measurement is performed using lepton+jets events, where one top quark de-cays semileptonically, while the second top quark dede-cays to a hadronic final state. The hadronic decay is reconstructed as a single, large-radius jet, and identified as a top quark candidate using jet substructure techniques. The integrated cross sec-tion and the differential cross secsec-tions as a funcsec-tion of top quark pT and rapidity are
measured at particle level within a fiducial region related to the detector-level re-quirements and at parton level. The particle-level integrated cross section is found to be σtt = 0.499±0.035(stat+syst) ±0.095 (theo)±0.013 (lumi) pb for top quark pT > 400 GeV. The parton-level measurement is σtt = 1.44±0.10(stat+syst) ±
0.29 (theo)±0.04 (lumi) pb. The integrated and differential cross section results are compared to predictions from several event generators.
Published in Physical Review D as doi:10.1103/PhysRevD.94.072002.
c
2016 CERN for the benefit of the CMS Collaboration. CC-BY-3.0 license ∗See Appendix A for the list of collaboration members
1
1
Introduction
Measurements of top quark pair (tt) production cross sections provide crucial information for testing the standard model (SM) and the accuracy of predictions from Monte Carlo (MC) gener-ators. The CMS [1] and ATLAS [2] Collaborations at the CERN LHC have previously measured the differential tt cross sections at√s=7 and 8 TeV as a function of transverse momentum (pT)
and other kinematic properties of the top quarks and the overall tt events [3–9]. These mea-surements use events where each parton from the top quark decay is associated with a distinct jet. However, when top quarks are produced with large Lorentz boosts, their decays are often collimated and the final decay products may be merged. For a top quark with a Lorentz boost of γ = E/m, where E is the energy and m the mass of the top quark, the angle ∆R in radians between the W boson and the b quark from the top quark decay is approximately∆R= 2/γ. In this paper, a measurement of the tt production cross section is presented utilizing jet sub-structure techniques to enhance sensitivity in the kinematic region with high-pT top quarks.
Accurate modeling of the boosted top quark regime is important as it is sensitive to many physics processes beyond the SM, as discussed, for example, in Ref. [10].
This paper presents the first CMS measurement of the tt production cross section in the boosted regime. The cross section is measured as a function of the top quark transverse momentum (ptT) and rapidity (yt) for ptT > 400 GeV, corresponding to the upper pT range covered by the CMS
measurement in Ref. [4]. A dedicated measurement of tt production in the boosted regime has recently been reported by the ATLAS Collaboration [11].
The analysis is performed for events in lepton+jets final states where one top quark decays according to t→Wb→ `νb, with`denoting an electron or a muon, and the second top quark
decays to quarks (t →Wb → qq0b). Lepton+jets final states originating from W boson decays to τ leptons (t → Wb → τνb → `ννb) are treated as background. The boosted top quark
that decays to a hadronic final state is reconstructed as a single, large-radius (large-R) jet. Jet substructure techniques similar to those used in Refs. [12, 13] are applied to identify those large-R jets originating from top quarks (t-tagged jets). A maximum-likelihood fit is performed to extract the background normalizations, the t tagging efficiency, and the integrated tt production cross section for ptT > 400 GeV. The results are presented at the particle level in a fiducial region similar to the event selection criteria to minimize the dependence on theoretical input, and fully corrected to the parton level. Differential tt cross sections are also measured at the particle (parton) level as a function of the t-tagged jet (top quark) pTand y after subtracting the
background contributions and correcting for inefficiencies and bin migrations.
2
The CMS detector, event reconstruction, and event samples
The CMS detector [1] is a general-purpose detector that uses a silicon tracker, a finely seg-mented lead tungstate crystal electromagnetic calorimeter (ECAL), and a brass and scintil-lator hadron calorimeter (HCAL). These subdetectors have full azimuthal coverage and are contained within the bore of a superconducting solenoid that provides a 3.8 T axial magnetic field. Charged particles are reconstructed in the tracker, covering a pseudorapidity [1] range
of |η| < 2.5. The surrounding ECAL and HCAL provide coverage for photon, electron, and
jet reconstruction for |η| < 3. Muons are measured in gas-ionization detectors embedded in
the steel flux-return yoke outside the solenoid. Events are reconstructed using the particle-flow algorithm [14, 15], which identifies each particle with an optimized combination of all subdetector information. The missing transverse momentum vector~pmiss
T is defined as the
all reconstructed particles in an event. Its magnitude is referred to as EmissT . A more detailed description of the CMS detector, together with a definition of the coordinate system used and the relevant kinematic variables, can be found in Ref. [1].
The measurement is performed using the CMS data recorded at√s =8 TeV, corresponding to an integrated luminosity of 19.7±0.5 fb−1[16]. For the e+jets channel, data are collected with a trigger requiring an electron with pT >30 GeV and|η| <2.5, at least one jet with pT >100 GeV,
and at least one additional jet with pT > 25 GeV. For the µ+jets channel, the trigger demands
a muon with pT > 40 GeV and |η| < 2.1, with no jet requirements. At the trigger level, the
leptons are not required to be isolated.
Simulated events are used to estimate the efficiency to reconstruct the tt signal, evaluate the systematic uncertainties, and model most of the background contributions. Samples of tt and electroweak single top quark events are generated using the next-to-leading-order (NLO) MC generatorPOWHEG(v. 1.0) [17–21], while W boson production in association with jets is
gen-erated with the leading-order (LO) generator MADGRAPH(v. 5.1.3.30) [22]. Additional tt sam-ples, generated using MADGRAPHand the NLO generatorMC@NLO(v. 3.41) [23], are used for comparison withPOWHEG. TheMC@NLOproduction is interfaced toHERWIG(v. 6.520, referred to asHERWIG6 in the following) [24] for parton showering, while all other generators are inter-faced toPYTHIA(v. 6.426, referred to asPYTHIA6) [25]. For the samples produced with MAD -GRAPH, the MLM prescription [26] is applied for matching of matrix-element jets to parton
showers. The most recentPYTHIAZ2* tune is used. It is derived from the Z1 tune [27], which
uses the CTEQ5L parton distribution function (PDF) set, whereas Z2* adopts CTEQ6L [28]. The POWHEG tt and single top quark samples are generated using the CT10 next-to-next-to-leading-order (NNLO) [29] PDFs, while the MC@NLOtt sample uses the NLO CTEQ6M [28] PDF set. The LO CTEQ6L1 [28] PDF set is used for the MADGRAPHtt and W+jets samples. All generated events are propagated through a simulation of the CMS detector based on GEANT4 (v. 9.4) [30].
The simulated events are corrected to match the conditions observed in data. All simulated events are reweighted to reproduce the distribution of the number of primary vertices that arises from additional pp interactions within the same or neighboring bunch crossings (pileup), as measured in data. The jet energy resolution is corrected by scaling the difference between the generated and the reconstructed jet momentum so that the resolution matches that observed in data [31]. Lepton trigger and identification efficiencies are also corrected for differences between data and simulation. Jet energy corrections are obtained from the simulation and further corrections are applied to data from in situ measurements using the energy balance in dijet and photon+jet events [31]. The contribution to the jet energy in data from pileup is removed using the area-based subtraction technique outlined in Ref. [32], augmented by corrections from data as a function of the jet η, as described in Ref. [31].
3
Event selection
Jet clustering is performed with the FASTJETpackage (v. 3.1) [33]. Two jet clustering algorithms are used in the measurement. The anti-kTalgorithm [34] with a distance parameter R = 0.5 is
used to reconstruct jets that are hereafter referred to as small-R jets. Lepton candidates that are found within∆R < 0.5 of a jet, where∆R = p(∆η)2+ (∆φ)2 and∆η and ∆φ are the pseu-dorapidity and azimuthal angle (in radians) differences between the direction of the lepton and the jet, are subtracted from the jet four-vector to avoid including such leptons within jets. The small-R jets are required to have pT > 30 GeV and|η| < 2.4. Small-R jets that are
iden-3
tified as originating from a bottom (b) quark through the use of an algorithm that combines secondary-vertex and track-based lifetime information [35, 36] are classified as being b tagged. The algorithm working point used has an efficiency for tagging a b jet of ≈65%, while the probability to misidentify light-flavor jets as b jets is≈1.5%. The secondary-vertex mass of the b-tagged jet (mvtx) is defined as the invariant mass of the tracks associated with the secondary
vertex, assuming that each particle has the pion mass. Jets that are b tagged are also required to have a secondary vertex (resulting in a small change in the efficiency). Differences in b tag-ging efficiency and misidentification rates between data and simulated events are accounted for through scale factors applied to the simulation.
The second jet clustering algorithm is the Cambridge–Aachen (CA) algorithm [37, 38], used to reconstruct large-R jets with a distance parameter R = 0.8. These jets are required to have pT > 400 GeV, where this lower pT bound is set such that the top quark decay products are
typically fully merged for R = 0.8. The kinematics of the large-R jet is used for the ptT and yt measurements.
The CMS top quark tagging algorithm [39], using large-R jets as input, is employed in this measurement to identify top quark candidates decaying hadronically. The algorithm begins by identifying subjets through recursive declustering of the original large-R jet, reversing the clustering sequence of the CA algorithm. First, the last clustering step is reversed, splitting the large-R jet j, with transverse momentum denoted as pjT, into two subjets j1 and j2, with
transverse momenta pj1
T and p j2
T. If the two subjets satisfy∆R(j1, j2) > 0.4−0.0004 pjT, with pjT
in GeV, they are passed to the next step of the algorithm; if not, they are reclustered and the parent is labeled as a hard subjet. Each subjet is required to satisfy pji
T >0.05 p j
T; otherwise, the
subjet is discarded. A secondary decomposition is next applied to the subjet(s), identifying up to a maximum of four hard subjets.
The large-R jet that is identified as a t jet candidate is required to contain at least three subjets, corresponding to the presumed b, q, and q0fragmentation products. In addition, the minimum pairwise invariant mass of the three subjets of highest pTis required to be greater than 50 GeV,
as expected for the t → Wb decay, and the total jet invariant mass mjis required to be
consis-tent with the top quark mass by demanding 140 < mj < 250 GeV. Large-R jets which fulfill
these requirements are labeled as t-tagged jets. The cumulative efficiency for these t tagging requirements is about 25% for|η| <1.0 and 13% for 1.0< |η| <2.4 [39]. The difference in the t
tagging efficiency between data and simulation is accounted for through a scale factor applied to the simulation that is derived using a maximum-likelihood fit.
Electrons [40] and muons [41] must have, respectively, pT > 35 GeV and 45 GeV, and|η| < 2.5
and 2.1, where the differences are a consequence of the requirements on the respective lepton triggers. Since leptons from high-pT top quark decays are often emitted close to their
accom-panying b jets, they may not be well-isolated. To reject background contributions from jets misidentified as leptons, the leptons must pass a two-dimensional (2D) selection, requiring ei-ther∆R(`, closest small-R jet) >0.5 or prelT >25 GeV, where prelT is the component of the lepton pT perpendicular to the axis of the closest small-R jet. An additional criterion is applied in the
electron channel to further reduce the multijet background contribution from mismeasured jets. The requirement ensures that~pTmissdoes not point parallel to the direction of either the electron (e) or the highest-pT jet (j) for low-ETmiss events: |∆φ({e or j},~pTmiss) −1.5| < EmissT /50 GeV.
Events that contain more than one lepton with pT > 20 GeV and|η| < 2.5 (2.1) for electrons
(muons) are rejected.
jet near the lepton (∆R(`, jet) <π/2, referred to as the leptonic side), and one large-R jet away
from the lepton (∆R(`, jet) >π/2, referred to as the hadronic side). These events are next
sep-arated into three exclusive event categories with different signal and background admixtures: “0t”, “1t+0b”, and “1t+1b”. The 0t events are defined by requiring that no hadronic-side jet pass the t tagging selection. For the 1t+0b events, the hadronic-side jet must pass the t tag-ging selection, and no leptonic-side jets can be b tagged. The third category of 1t+1b events must contain both a hadronic-side t-tagged jet and a leptonic-side b-tagged jet. The 0t sam-ple is dominated by background events, primarily from W+jets production, while the signal and background yields for the 1t+0b sample are expected to be of comparable size. The 1t+1b sample is dominated by signal events.
4
Background estimation
The dominant sources of background are single top quark production (primarily from the Wt channel), W+jets production, and multijet production. In addition, tt events with decays to
τ+jets (resulting in either hadronic or leptonic final states) or any other than e/µ+jets final states
are treated as background in the measurement, and hereafter referred to as ”tt other”. Other sources of background, including diboson, Z+jets, WH, and ttW/Z production, were found to be negligible. All background normalizations are extracted through a maximum-likelihood fit discussed in Section 6, while the signal and all background distributions are modeled using simulation, except multijet production, which is obtained from data. The tt other contribution is constrained to have the same relative normalization as the tt signal in the likelihood fit. The background from multijet production is estimated using control samples in data. Multijet templates for each event category (0t, 1t+0b, 1t+1b) are extracted using control samples, defined by inverting the 2D lepton-jet separation requirement and subtracting residual contributions (corresponding to 3–15% of events in the control samples) from tt, single top quark, and W+jets events. An initial multijet background normalization is obtained for each event category from a fit of multijet and other signal and background templates to the EmissT distribution in data.
5
Systematic uncertainties
Systematic uncertainties in the measurement arise from reconstruction and detector resolu-tion effects, background estimaresolu-tion, and theoretical uncertainty in the modeling of signal. The dominant experimental uncertainty is the uncertainty in the t tagging efficiency. The different sources of systematic uncertainty are described in detail below.
The uncertainty in the t tagging efficiency and the corresponding data-to-simulation correction factor are evaluated in Ref. [39]. Since there is a large overlap between those events and events in the signal region in this measurement, and since the t tagging efficiency is strongly anticor-related with the tt cross section measurement, the t tagging efficiency and its uncertainty are determined simultaneously with the cross section (see Section 6.1). The resulting efficiency is in agreement with the previous measurement [39].
The uncertainties in jet energy scale are estimated by changing the jet energy as a function of jet pT and η by±1 standard deviation [31]. These uncertainties, which include differences
in jet response between light- and heavy-flavor jets, have been measured for anti-kT jets with
distance parameters of R=0.5 and 0.7, but not for R=0.8 CA jets. The response of the R=0.8 CA jets is estimated in simulation to be within 1% of the response of R=0.7 anti-kTjets. This is
5
boosted tt events (outside of the signal region). An additional 1% uncertainty is used to account for the small differences observed in these studies. The jet energy scale uncertainties for R=0.5 and R=0.8 jets are treated as fully correlated.
The jet energy resolution is known to be about 10% worse in data than in simulation, and the resolution is therefore adjusted in simulation, using smearing factors in bins of jet η [31]. An as-sociated systematic uncertainty is obtained by rescaling the resolution smearing in simulation by±1 standard deviation. This corresponds to changes in the smearing of about±(2.4–5.0)%, depending on η. The effect of jet mass scale and jet mass resolution were found to be very small compared to those from the jet energy. These are accounted for with the data-to-simulation cor-rection factor.
The uncertainties associated with the jet energy scale and resolution are propagated to the estimation of the ETmiss. The uncertainty in the modeling of the large-R jet mass, which was measured in Ref. [42], is also accounted for through propagating the jet energy uncertainties to the full jet four-vector.
In addition to uncertainties in the distributions, we also consider several normalization uncer-tainties affecting the signal yield. The unceruncer-tainties in background yields are taken into account in the combined signal-and-background maximum-likelihood fit by changing the W+jets, sin-gle top quark, and multijet normalizations, assuming conservative log-normal prior uncertain-ties of±50%,±50%, and±100%, respectively. The background normalizations are constrained in the maximum-likelihood fit, and corresponding background uncertainties extracted as the
±1 standard deviation uncertainties in the fit. In addition, the statistical uncertainty resulting from the finite sizes of the simulated samples are included. The uncertainty in the measurement of the integrated luminosity of±2.6% [16] is also included.
The uncertainty in the pileup modeling is evaluated by varying the total inelastic pp cross section used in the simulation within its uncertainty of±5% [43]. The resulting uncertainty in the cross section measurements is less than 1%.
Systematic uncertainties from the lepton trigger and corrections to the lepton identification efficiencies that are applied to all simulated events contribute negligibly to the uncertainty in the cross section measurement. This includes the lepton η dependence of these uncertainties. The uncertainty in the b tagging efficiency [35, 36] is also considered, but has a negligible impact on the final result since the measurements are performed by combining events in the 1t+0b and 1t+1b event categories. Uncertainties pertaining to the modeling of the secondary-vertex mass, which is one of the variables used in the maximum-likelihood fit, are negligible compared to the statistical uncertainty in the sample.
Theoretical uncertainties in the modeling of the tt events originate from the choice of PDF and renormalization and factorization (µR and µF) scales, whose nominal values are chosen to be
equal to the momentum transfer Q in the hard scattering, given by Q2 =m2
top, where the
sum-mation runs over all final-state partons in the event. The uncertainty in the modeling of the hard-scattering process is evaluated using samples where the renormalization and factoriza-tion scales are simultaneously changed up (2Q) or down (Q/2). The uncertainty from the PDF is evaluated using the up and down eigenvector outputs from the NNLO PDF sets CT10 [29], MSTW 2008 [44], and NNPDF2.3 [45], following the PDF4LHC prescription [46, 47]. An ad-ditional theoretical uncertainty is assigned to account for the choice of event generator and parton shower algorithm in extracting the integrated and differential cross sections, evaluated usingMC@NLO+HERWIG6 (see Sections 6.1 and 6.3).
6
Cross section measurements
The tt signal yield, background normalizations, and t tagging efficiency are extracted simul-taneously using a binned, extended maximum-likelihood fit to different templates of several kinematic variables described below. First, the fit is used to determine the integrated tt cross section for ptT > 400 GeV, providing a simultaneous measurement of the cross section with nuisance parameters and constraints on the background yields in the data. The results are then used to obtain the differential tt cross section as a function of ptTand yt. The cross sections are presented at both the particle and parton levels.
6.1 Maximum-likelihood fit
Three exclusive event categories are used in the maximum-likelihood fit (0t, 1t+0b, 1t+1b), as defined in Section 3. The lepton|η|is used as the discriminant for events in the 0t and 1t+0b
categories, while mvtxis used to discriminate tt events (tt signal and tt other are constrained to
the same relative normalization in the fit) from non-tt background in the 1t+1b event category. The electron and muon channels are fitted separately, yielding a total of six categories. The maximum-likelihood fit is performed within theTHETAframework [48].
Background normalizations and experimental systematic uncertainties are treated as nuisance parameters in the fit, three of which are built into the model as uncertainties in the input dis-tributions, these being the jet energy scale, jet energy resolution, and t tagging efficiency. The event categories for the fit are designed such that the t tagging efficiency is constrained by the relative populations of events in the different categories. The tt cross section and the back-ground normalizations are therefore correlated with these variables. The strongest correlation with the tt cross section is the t tagging efficiency. A log-normal prior constraint is used for each nuisance parameter that corresponds to a normalization uncertainty, while uncertainties based on the form of the distributions are modeled with a Gaussian prior for the nuisance parameter, which is used to interpolate between the nominal and shifted templates. The e+jets and µ+jets events use common nuisance parameters for all systematic uncertainties and background nor-malizations, except for multijet backgrounds, which are taken as independent of each other. The total fitted uncertainties in the background yields are 46% for single top quark, 7.5% for tt other, 6.8% for W+jets production, and 47% and 17%, respectively, for the muon and electron multijet backgrounds.
A correction factor to account for small differences in the t tagging efficiency between data and simulation is also determined through the maximum-likelihood fit. While the dependence of this efficiency correction on the t jet η is taken from Ref. [39], an additional uncertainty to account for a potential dependence of ptT is evaluated by performing separate fits for events with ptT < 600 GeV and>600 GeV. All other nuisance parameters are required to be the same in both ptTregions for this check. An additional uncertainty of 17% is assigned for ptT >600 GeV to account for the pT dependence, resulting in a total uncertainty in the t tagging efficiency of
±5% (±18%) for ptT <600 (>600) GeV.
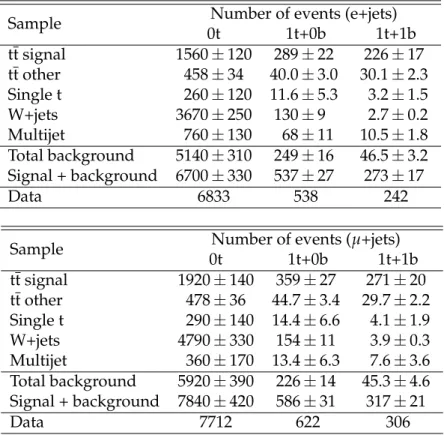
The measured normalizations in the signal and background yields, as determined from the maximum-likelihood fit, are given, together with the number of observed events in data, in Table 1. The electron and muon channels are shown separately. The quoted uncertainties are from the total fit, and include the statistical components, but not the theoretical uncertainties in the tt signal. The total signal and background yields are consistent with the observed number of events in the data within about one standard deviation.
6.2 Integratedtt cross section measurement 7
Table 1: Predicted numbers of signal and background events, as well as the total yield, to-gether with the observed number of events in data, are shown after the combined maximum-likelihood fit for the e+jets (top) and µ+jets (bottom) categories. The uncertainties include the statistical component from the fit, but not the theoretical uncertainties in the tt signal. The un-certainties in the sum of backgrounds and the total yield are determined neglecting correlations for presentational purposes, although the full likelihood with correlations is used to compute the uncertainties in the measurements of the cross section.
Sample Number of events (e+jets)
0t 1t+0b 1t+1b tt signal 1560±120 289±22 226±17 tt other 458±34 40.0±3.0 30.1±2.3 Single t 260±120 11.6±5.3 3.2±1.5 W+jets 3670±250 130±9 2.7±0.2 Multijet 760±130 68±11 10.5±1.8 Total background 5140±310 249±16 46.5±3.2 Signal + background 6700±330 537±27 273±17 Data 6833 538 242
Sample Number of events (µ+jets)
0t 1t+0b 1t+1b tt signal 1920±140 359±27 271±20 tt other 478±36 44.7±3.4 29.7±2.2 Single t 290±140 14.4±6.6 4.1±1.9 W+jets 4790±330 154±11 3.9±0.3 Multijet 360±170 13.4±6.3 7.6±3.6 Total background 5920±390 226±14 45.3±4.6 Signal + background 7840±420 586±31 317±21 Data 7712 622 306
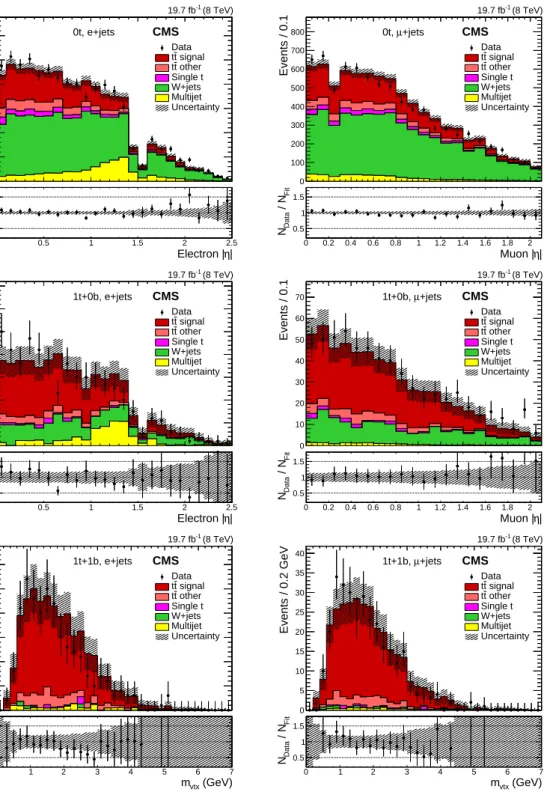
events are shown in Fig. 1, comparing the fitted values of the model to the data from each of the fitted categories (0t, 1t+0b, 1t+1b). The uncertainty bands show the combined fitted statistical and experimental systematic uncertainties in the signal and backgrounds, added in quadrature neglecting correlations for presentational purposes, although the full likelihood with correlations is used to compute the uncertainties in the measurements of the cross section. The pT and y distributions of the hadronic-side, large-R jet are shown for each category in
Fig. 2. These figures show the data, together with the signal and background yields from simulation (or, for multijet background, from data enhanced with multijet events), using the normalizations from the fit, as well as the ratio of the data to the total fit. Since the ptT and yt variables are not used in the fit, the signal and background distributions in Fig. 2 are taken from simulation (or the data sideband for the multijet background). In extracting the differential cross sections, these distributions are used for the backgrounds, while the signal is taken from the data after subtracting the background contributions.
6.2 Integrated tt cross section measurement
The measurement at the particle level is defined within a fiducial region designed to closely match the event selections in the detector and minimize the dependence on theoretical input. The measurement at the parton level is defined relative to the top and antitop quarks before they decay, but after they radiate any gluons.
Events / 0.1 0 100 200 300 400 500 600 Data signal t t other t t Single t W+jets Multijet Uncertainty CMS (8 TeV) -1 19.7 fb 0t, e+jets | η Electron | 0 0.5 1 1.5 2 2.5 Fit / N Data N 0.5 1 1.5 Events / 0.1 0 100 200 300 400 500 600 700 800 Data signal t t other t t Single t W+jets Multijet Uncertainty CMS (8 TeV) -1 19.7 fb +jets µ 0t, | η Muon | 0 0.2 0.4 0.6 0.8 1 1.2 1.4 1.6 1.8 2 Fit / N Data N 0.5 1 1.5 Events / 0.1 0 10 20 30 40 50 60 70 Data signal t t other t t Single t W+jets Multijet Uncertainty CMS (8 TeV) -1 19.7 fb 1t+0b, e+jets | η Electron | 0 0.5 1 1.5 2 2.5 Fit / N Data N 0.5 1 1.5 Events / 0.1 0 10 20 30 40 50 60 70 Data signal t t other t t Single t W+jets Multijet Uncertainty CMS (8 TeV) -1 19.7 fb +jets µ 1t+0b, | η Muon | 0 0.2 0.4 0.6 0.8 1 1.2 1.4 1.6 1.8 2 Fit / N Data N 0.5 1 1.5 Events / 0.2 GeV 0 5 10 15 20 25 30 Data signal t t other t t Single t W+jets Multijet Uncertainty CMS (8 TeV) -1 19.7 fb 1t+1b, e+jets (GeV) vtx m 0 1 2 3 4 5 6 7 Fit / N Data N 0.5 1 1.5 Events / 0.2 GeV 0 5 10 15 20 25 30 35 40 Data signal t t other t t Single t W+jets Multijet Uncertainty CMS (8 TeV) -1 19.7 fb +jets µ 1t+1b, (GeV) vtx m 0 1 2 3 4 5 6 7 Fit / N Data N 0.5 1 1.5
Figure 1: Lepton|η|and mvtxdistributions from data (points) and for signal and background
sources (histograms) with normalizations from the fit for the 0t (top), 1t+0b (middle), and 1t+1b (bottom) event categories, for the e+jets (left column) and µ+jets (right column) channels. The vertical bars on the data points represent the statistical uncertainties. The shaded bands reflect the combined statistical and experimental systematic uncertainties after the fit to the signal and background yields, added in quadrature neglecting their correlations for presentational purposes. The ratios of data (NData) to the total prediction from the fit (NFit) are shown below
6.2 Integratedtt cross section measurement 9 Events / 10 GeV 0 200 400 600 800 1000 1200 1400 1600 Data signal t t other t t Single t W+jets Multijet Uncertainty CMS (8 TeV) -1 19.7 fb 0t (GeV) t T p 400 500 600 700 800 900 Fit / N Data N 0.5 1 1.5 Events / 0.2 0 200 400 600 800 1000 1200 1400 1600 Datatt signal other t t Single t W+jets Multijet Uncertainty CMS (8 TeV) -1 19.7 fb 0t t y -2 -1.5 -1 -0.5 0 0.5 1 1.5 2 Fit / N Data N 0.5 1 1.5 Events / 25 GeV 0 20 40 60 80 100 120 140 160 180 200 Data signal t t other t t Single t W+jets Multijet Uncertainty CMS (8 TeV) -1 19.7 fb 1t+0b (GeV) t T p 400 500 600 700 800 900 1000 1100 1200 Fit / N Data N 0.5 1 1.5 Events / 0.2 0 20 40 60 80 100 120 140 160 180 Data signal t t other t t Single t W+jets Multijet Uncertainty CMS (8 TeV) -1 19.7 fb 1t+0b t y -2 -1.5 -1 -0.5 0 0.5 1 1.5 2 Fit / N Data N 0.5 1 1.5 Events / 25 GeV 0 20 40 60 80 100 Data signal t t other t t Single t W+jets Multijet Uncertainty CMS (8 TeV) -1 19.7 fb 1t+1b (GeV) t T p 400 500 600 700 800 900 1000 1100 1200 Fit / N Data N 0.5 1 1.5 Events / 0.2 0 10 20 30 40 50 60 70 80 90 Data signal t t other t t Single t W+jets Multijet Uncertainty CMS (8 TeV) -1 19.7 fb 1t+1b t y -2 -1.5 -1 -0.5 0 0.5 1 1.5 2 Fit / N Data N 0.5 1 1.5
Figure 2: Transverse momentum (left column) and rapidity (right column) distributions of the hadronic-side, large-R jet for the 0t (top), 1t+0b (middle), and 1t+1b (bottom) event categories, combining the e+jets and µ+jets channels. The data are compared to the total signal and back-ground yields using normalizations from the maximum-likelihood fit. The vertical bars on the data points represent the statistical uncertainties. The shaded bands reflect the combination of the statistical and post-fit systematic uncertainties in the signal and background yields added in quadrature, without the uncertainties based on the form of the distributions, and neglecting their correlations for presentational purposes. The ratios of data (NData) to the total prediction
The POWHEG+PYTHIA6 simulation is used to determine the acceptance for the particle-level and parton-level selections and to obtain the predicted cross section values. The following particle-level selections are used to define the fiducial region in the simulation:
(i) One electron or muon with pT > 45 GeV (computed prior to any potential photon
radia-tion) and|η| <2.1.
(ii) At least one anti-kT(R=0.5) jet with 0.1<∆R(`, jet) <π/2, pT >30 GeV, and|η| <2.4.
(iii) At least one CA (R= 0.8) jet with∆R(`, jet) > π/2, pT > 400 GeV, 140< mj <250 GeV,
and|η| <2.4.
Jets at the particle level in the simulation are formed from stable particles, excluding electrons, muons, and neutrinos. The cross section at parton level is measured for the region where the top or antitop quark that decays to quarks has pT >400 GeV. No other kinematic requirements
are imposed.
The measurements at both the particle and parton levels are corrected for the branching fraction of tt→e/µ+jets, determined from the tt simulation.
The integrated tt cross section is obtained from the tt signal yield in the maximum-likelihood fit. Uncertainties associated with the signal modeling are not included as nuisance param-eters in the fit. These are instead evaluated through the difference in the signal acceptance from changes made in the µR and µF scales and PDF variations. The uncertainties from the
choice of event generator and parton shower algorithm are also evaluated independently of the fit through the difference in the tt signal acceptance between thePOWHEG+PYTHIA6 and MC@NLO+HERWIG6 predictions at the particle and parton levels.
The measurements of the integrated cross sections for ptT >400 GeV are:
particle level: σtt=0.499±0.035 (stat+syst)±0.095 (theo)±0.013 (lumi) pb, parton level: σtt=1.44±0.10 (stat+syst)±0.29 (theo)±0.04 (lumi) pb.
The theoretical uncertainties from the PDF, µRand µFscales, and choice of event generator and
parton shower algorithm are, respectively, 9%, 9%, and 14% at the particle level, and 9%, 10%, and 15% at the parton level.
The measurements are compared to predictions from different tt simulations. Assuming the NNLO cross section of 252.9 pb [49] for the full phase space, the resulting POWHEG+PYTHIA6 cross section is 0.580 (1.67) pb at particle (parton) level. The ratio of the measured integrated tt cross section for the high-pT region to the value predicted by the POWHEG+PYTHIA6
simu-lation is 0.86±0.16 (0.86±0.19) for the particle (parton) level. Thus, the measurements and predictions are consistent within the total uncertainty, which is dominated by the theoretical uncertainty in the cross section extraction. The integrated cross sections are also extracted from the MADGRAPH+PYTHIA6 and MC@NLO+HERWIG6 simulations, again assuming the NNLO
cross section for the full phase space, and are 0.675 (1.85) pb and 0.499 (1.42) pb at the parti-cle (parton) level, respectively. The prediction from theMC@NLO+HERWIG6 simulation agrees well with the measured values, while the MADGRAPH+PYTHIA6 simulation overestimates the cross sections at both particle and parton levels.
6.3 Differential tt cross section measurements
The differential tt cross section is measured as a function of the pT and y of the top quark that
6.3 Differentialtt cross section measurements 11
t jet candidates are extracted is defined by combining the signal-dominated 1t+0b and 1t+1b event categories. The observed number of tt events at detector level is first extracted from data by subtracting the SM background contributions using the normalizations from the maximum-likelihood fit (shown in Table 1). As a cross-check, it is verified that a small tt contribution added to the maximum-likelihood fit from a beyond-the-SM process, such as a 1–2% contribu-tion from Z0 → tt (corresponding to a signal cross section already excluded in Ref. [13]), has a negligible impact on the extracted SM backgrounds. We also verify that a small potential mod-ification of the top quark rapidity has a minimal impact on the background normalizations that is well within the quoted background normalization uncertainties.
An unfolding procedure translates the observed number of tt events in bins of reconstructed pT
and y of the t jet candidate to a cross section in bins of particle- and parton-level top quark pt T
and yt. If more than large-R jet fulfills the particle-level selection in Section 6.2, which occurs for<1% of events, the one with highest pT is chosen as the particle-level t jet. The unfolding
accounts for all reconstruction and detector efficiencies, detector resolution effects, and migra-tions of tt events across bins. The unfolding is performed using response matrices, determined with simulated POWHEG+PYTHIA6 tt events, using the singular-value-decomposition (SVD) method [50] in the ROOUNFOLDpackage [51].
The background-subtracted data are unfolded in two steps, first from detector level to particle level, and in a second step from particle level to parton level. Response matrices are created between the pTand y of the reconstructed t jet candidate and the particle-level t jet, and between
the particle-level t jet and the parton-level top quark. These response matrices are used to unfold the data and obtain the differential cross sections, after dividing by the bin width and correcting for the branching fraction of tt → e/µ+jets. The unfolding is performed multiple times, repeating the procedure for each systematic change that affects the ptTor ytdistributions. The electron and muon channels are unfolded separately, and are then combined through the statistically weighted mean in each bin. Specifically, the combined cross section in a bin (σ) is given by σ = ∑(σi/δσi2)/∑(1/δσi2), where σi is the cross section in a bin for each channel
(i =e, µ) and δσiis the corresponding uncertainty. The statistical uncertainty in the combined
cross section (δσ) is given by δσ = 1/(∑(1/δσi2))1/2. The combination is repeated for each systematic variation, and the difference with respect to the combined nominal value is taken as the uncertainty for that source of systematic bias. The uncertainty in the normalization of the background is extracted by rescaling the subtracted background by±1 standard deviation, as derived from the maximum-likelihood fit in Section 6.1, and taking the difference in the unfolded result relative to the nominal yield as the uncertainty at particle and parton level, respectively. Similarly, the t tagging efficiency uncertainty as measured at detector level is translated into an uncertainty in the differential measurement at particle and parton levels by unfolding, assuming systematically varied t tagging efficiencies. The uncertainties from the choice of event generator and parton shower algorithm are evaluated by unfolding the nominal
POWHEG+PYTHIA6 simulated events using the response matrix fromMC@NLO+HERWIG6. The differences between the unfolded simulation and the predictions at the particle and parton levels are taken as the uncertainties. At particle (parton) level, these are 1–18% (2–21%) and 3–8% (2–6%) for the pt
Tand ytmeasurements, respectively.
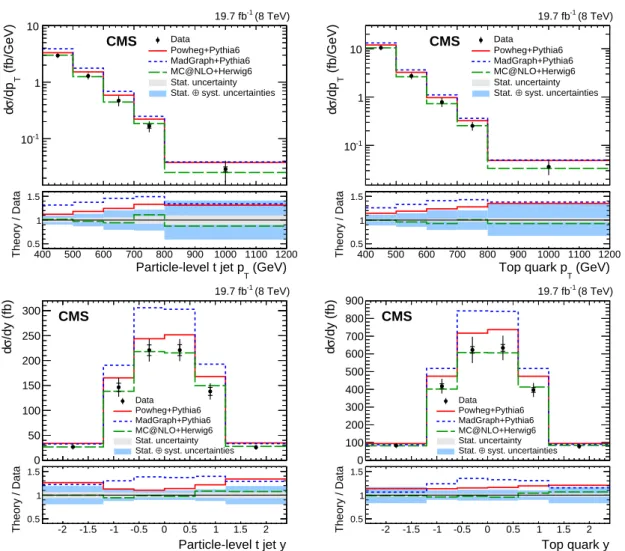
The unfolded results at the particle and parton levels, including all experimental and theoret-ical uncertainties, are shown as a function of ptT and yt as the data points in Fig. 3, and the relative uncertainties are displayed in Fig. 4. As a consequence of bin migrations, the uncer-tainties at particle and parton level differ from the corresponding bin-by-bin unceruncer-tainties at detector level.
(GeV) T Particle-level t jet p 400 500 600 700 800 900 1000 1100 1200 Theory / Data 0.5 1 1.5 (fb/GeV) T /dp σ d -1 10 1 10 Data Powheg+Pythia6 MadGraph+Pythia6 MC@NLO+Herwig6 Stat. uncertainty syst. uncertainties ⊕ Stat. CMS (8 TeV) -1 19.7 fb (GeV) T Top quark p 400 500 600 700 800 900 1000 1100 1200 Theory / Data 0.5 1 1.5 (fb/GeV) T /dp σ d -1 10 1 10 Data Powheg+Pythia6 MadGraph+Pythia6 MC@NLO+Herwig6 Stat. uncertainty syst. uncertainties ⊕ Stat. CMS (8 TeV) -1 19.7 fb Particle-level t jet y -2 -1.5 -1 -0.5 0 0.5 1 1.5 2 Theory / Data 0.5 1 1.5 /dy (fb) σ d 0 50 100 150 200 250 300 Data Powheg+Pythia6 MadGraph+Pythia6 MC@NLO+Herwig6 Stat. uncertainty syst. uncertainties ⊕ Stat. CMS (8 TeV) -1 19.7 fb Top quark y -2 -1.5 -1 -0.5 0 0.5 1 1.5 2 Theory / Data 0.5 1 1.5 /dy (fb) σ d 0 100 200 300 400 500 600 700 800 900 Data Powheg+Pythia6 MadGraph+Pythia6 MC@NLO+Herwig6 Stat. uncertainty syst. uncertainties ⊕ Stat. CMS (8 TeV) -1 19.7 fb
Figure 3: Differential tt cross section in bins of particle-level t jet pT (top left), parton-level top
quark pT (top right), particle-level t jet y (bottom left), and parton-level top quark y (bottom
right), including all systematic uncertainties. The lower plots show the ratio of the theoretical predictions to the data. The statistical uncertainties are represented by the inner vertical bars with ticks and the light bands in the ratios. The combined uncertainties are shown as full vertical bars and the dark solid bands in the ratios.
6.3 Differentialtt cross section measurements 13 (GeV) T Particle-level t jet p 400 500 600 700 800 900 1000 1100 1200 Uncertainty [%] 0 10 20 30 40 50 60 70
Total syst. uncertainty Statistical uncertainty Int. luminosity Jet energy scale Jet energy resolution
t tagging efficiency Background normalization Generator+parton shower PDF uncertainty scales F µ , R µ CMS 19.7 fb-1 (8 TeV) (GeV) T Top quark p 400 500 600 700 800 900 1000 1100 1200 Uncertainty [%] 0 10 20 30 40 50 60 70
Total syst. uncertainty Statistical uncertainty Int. luminosity Jet energy scale Jet energy resolution
t tagging efficiency Background normalization Generator+parton shower PDF uncertainty scales F µ , R µ CMS 19.7 fb-1 (8 TeV) Particle-level t jet y -2 -1.5 -1 -0.5 0 0.5 1 1.5 2 Uncertainty [%] 0 5 10 15 20 25 30 35 40
Total syst. uncertainty Statistical uncertainty Int. luminosity Jet energy scale Jet energy resolution
t tagging efficiency Background normalization Generator+parton shower PDF uncertainty scales F µ , R µ CMS 19.7 fb-1 (8 TeV) Top quark y -2 -1.5 -1 -0.5 0 0.5 1 1.5 2 Uncertainty [%] 0 5 10 15 20 25 30 35 40
Total syst. uncertainty Statistical uncertainty Int. luminosity Jet energy scale Jet energy resolution
t tagging efficiency Background normalization Generator+parton shower PDF uncertainty scales F µ , R µ CMS 19.7 fb-1 (8 TeV)
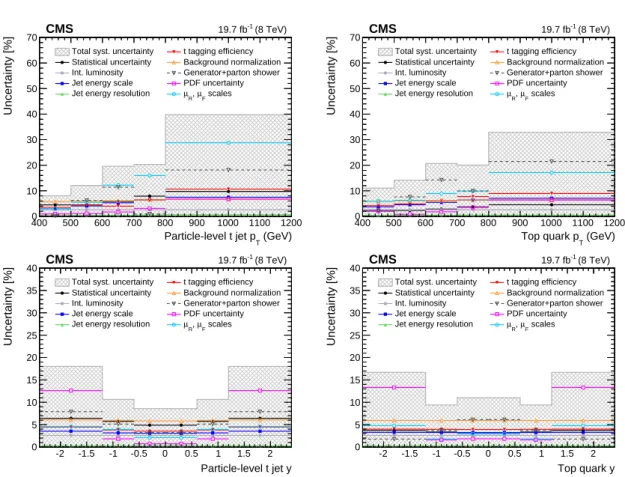
Figure 4: Total systematic uncertainties (cross-hatched regions), as well as individual contribu-tions and statistical-only uncertainties (points) in percent as a function of particle-level t jet pT
(top left), parton-level top quark pT (top right), particle-level t jet y (bottom left), and
parton-level top quark y (bottom right) for the differential cross section measurements. The horizontal bars on the points show the bin widths.
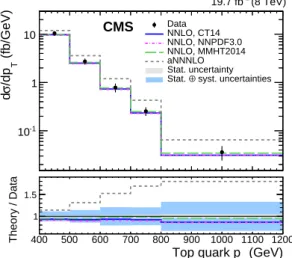
The measured tt cross sections are listed in bins of ptT and ytat the particle and parton levels in Table 2. The measured cross sections are compared to the theoretical predictions from the
POWHEG+PYTHIA6, MADGRAPH+PYTHIA6, and MC@NLO+HERWIG6 tt simulations, all
nor-malized to the NNLO cross section [49]. Their values are also displayed in Fig. 3 and given in Table 2. Also listed in Table 2 are the different relative uncertainties in the measurements, separated into the statistical uncertainty (Stat), the combined experimental uncertainty (Exp), the theoretical uncertainty (Th), and the total measurement uncertainty (Tot), all in percent. The measured cross sections are lower than the predictions fromPOWHEG+PYTHIA6 and MAD -GRAPH+PYTHIA6, in particular for the high-ptTregion, whileMC@NLO+HERWIG6 gives a better modeling of the data across the full ptT range. The differential cross sections are significantly overestimated for |yt| < 1.2 by MADGRAPH+PYTHIA6 as compared to the data. The
predic-tions of the ytdistributions byMC@NLO+HERWIG6 andPOWHEG+PYTHIA6 agree with the data
within the measurement uncertainties.
Table 2: Differential tt cross section in bins of pTand y for the t jet at the particle level (top) and
the top quark at parton level (bottom). The measurements are compared to predictions from thePOWHEG+PYTHIA6, MADGRAPH+PYTHIA6, and MC@NLO+HERWIG6 simulations. The to-tal relative uncertainty (Tot) in the measurements is separated into relative statistical (Stat), experimental (Exp), and theoretical (Th) components, all in percent.
pT(GeV) dσ/dpT(fb/GeV) at particle level
Data Stat (%) Exp (%) Th (%) Tot (%) POWHEG MADGRAPH MC@NLO
400–500 2.95 4.5 7.4 3.2 9.6 3.32 3.89 3.00
500–600 1.29 4.5 8.4 8.6 13 1.52 1.77 1.25
600–700 0.471 5.8 9.1 17 21 0.587 0.686 0.445
700–800 0.166 7.9 11 16 22 0.222 0.249 0.185
800–1200 0.029 9.7 15 37 41 0.038 0.039 0.025
y dσ/dy (fb) at particle level
(−2.4, −1.2) 27 6.4 8.3 16 19 34 33 27 (−1.2, −0.6) 146 5.8 7.8 7.1 12 165 191 138 (−0.6, 0.0) 221 4.9 7.5 4.1 10 244 306 218 (0.0, 0.6) 221 4.9 7.5 4.1 10 252 303 215 (0.6, 1.2) 138 5.8 7.8 7.1 12 168 193 150 (1.2, 2.4) 26 6.4 8.3 16 19 35 33 28
pT(GeV) dσ/dpT(fb/GeV) at parton level
Data Stat (%) Exp (%) Th (%) Tot (%) POWHEG MADGRAPH MC@NLO
400–500 10.4 2.3 8.1 6.8 11 11.9 13.1 10.4
500–600 2.74 2.3 9.0 10 14 3.25 3.64 2.63
600–700 0.786 2.8 10 18 21 0.972 1.11 0.728
700–800 0.254 3.7 12 16 20 0.324 0.363 0.256
800–1200 0.036 4.5 13 30 33 0.049 0.050 0.033
y dσ/dy (fb) at parton level
(−2.4, −1.2) 83 3.7 7.9 14 17 94 88 82 (−1.2, −0.6) 418 3.4 7.8 4.5 10 474 518 402 (−0.6, 0.0) 623 3.0 7.8 7.3 11 717 842 608 (0.0, 0.6) 634 3.0 7.8 7.3 11 737 840 606 (0.6, 1.2) 397 3.4 7.8 4.5 10 474 518 413 (1.2, 2.4) 79 3.7 7.9 14 17 95 91 84
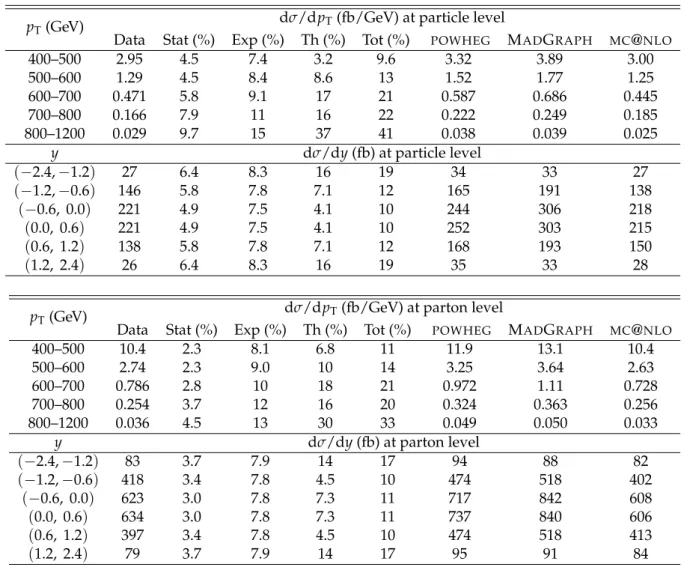
The differential tt cross section measurement in bins of parton-level top quark pTis compared to
15
sections are extracted from Ref. [52] for three different PDF sets (NNPDF3.0 [53], CT14 [54], and MMHT2014 [55]). Approximate next-to-next-to-next-to-leading-order (aNNNLO) predictions corresponding to the results presented in Ref. [56] were provided by the author. The NNLO calculations are in good agreement with the measurement across the full top quark pT range
studied. Predictions for different PDF sets cannot be distinguished given the current measure-ment uncertainty but are all observed to be consistent with the data. The aNNNLO calculation significantly overestimates the cross section, with an increasing disagreement with higher top quark pT. An additional check of the unfolding procedure is performed to confirm that the
un-folding itself would support such a different pT spectrum. ThePOWHEG+PYTHIA6 simulation
is unfolded using response matrices derived from the same sample, but reweighting the dis-tribution at detector level by a factor that corresponds to that required to match the aNNNLO prediction at parton level. The scaled and then unfolded simulation reproduces the aNNNLO prediction within the measurement uncertainty.
(GeV) T Top quark p 400 500 600 700 800 900 1000 1100 1200 Theory / Data 1 1.5 (fb/GeV) T /dp σ d -1 10 1 10 Data NNLO, CT14 NNLO, NNPDF3.0 NNLO, MMHT2014 aNNNLO Stat. uncertainty syst. uncertainties ⊕ Stat. CMS (8 TeV) -1 19.7 fb
Figure 5: Differential tt cross section in bins of parton-level top quark pTincluding all
system-atic uncertainties. The measured cross section is compared to theoretical calculations at NNLO for three different PDF sets [52] and at aNNNLO [56]. The lower plot shows the ratio of these theoretical predictions to the data. The statistical uncertainties are represented by the inner vertical bars with ticks and the light bands in the ratios. The combined uncertainties are shown as full vertical bars and the dark solid bands in the ratios.
7
Summary
The first CMS measurement of the tt production cross section in the boosted regime has been presented. The integrated cross section, as well as differential cross sections as a function of the top quark pTand y, have been measured for ptT >400 GeV. The measurements use lepton+jets
events, identified through an electron or a muon, a b jet candidate from the semileptonic top quark decay, and a t jet candidate from the top quark decaying to a hadronic final state. Back-grounds are modeled using simulations for the distributions, or a data sideband for multijet production. Background normalizations are extracted jointly with the signal yield and the t tagging efficiency using a maximum-likelihood fit.
The integrated cross section measured for ptT > 400 GeV is σtt = 0.499±0.035(stat+syst) ±
0.095 (theo)±0.013 (lumi) pb at particle level, and σtt = 1.44±0.10 (stat+syst)±0.29 (theo)±
0.04 (lumi) pb at parton level, both corrected for the branching fraction of tt → e/µ+jets. The measurements are compared to the predicted cross section for this pT range from the
POWHEG+PYTHIA6 tt simulation assuming σtot = 252.9 pb, which provides a value of 0.580 pb
at particle level and 1.67 pb at parton level. The cross section for this high-pT region is
there-fore found to be overestimated by 14% in thePOWHEG+PYTHIA6 simulation, but is consistent
within the uncertainties.
Differential cross sections are also measured at both particle and parton levels. Background contributions are subtracted from the t-tagged jet distributions to obtain the distribution for signal. This is unfolded first to the particle level to correct for signal efficiency, acceptance, and bin migrations to yield the cross section in bins of t jet pT and y at particle level. The
data are further unfolded to the parton level to extract the cross section in bins of top quark pT and y. The measurements are compared to predictions from different tt simulations. The
POWHEG+PYTHIA6 and MADGRAPH+PYTHIA6 simulations are observed to overestimate the
cross section, in particular at high ptT, while MC@NLO+HERWIG6 results in a good modeling of the ptT spectrum. The POWHEG+PYTHIA6 and MC@NLO+HERWIG6 simulations model the ytdistributions well, while MADGRAPH+PYTHIA6 significantly overestimates the cross section
for|yt| <1.2. The results are compatible with those from the nonboosted CMS measurement [4]
in the pT range where the two analyses overlap (400–500 GeV). The nonboosted measurement
also observes an overestimate of the cross section for different MC generators in this pTrange,
most prominent for MADGRAPH+PYTHIA6, and an improved modeling of the pT spectrum
using HERWIG 6 for the parton showering. The measurement as a function of parton-level
top quark pT is also compared to theoretical aNNNLO and NNLO calculations. While the
aNNNLO prediction significantly overestimate the measurement, especially for high top quark pT, the NNLO calculations are in good agreement across the full pT range studied.
The analysis presented in this paper extends the differential tt cross section measurement into the pT>1 TeV range. These measurements will help improve the modeling of event generators
in this high-pTrange, an important regime for many new physics searches.
Acknowledgements
We congratulate our colleagues in the CERN accelerator departments for the excellent perfor-mance of the LHC and thank the technical and administrative staffs at CERN and at other CMS institutes for their contributions to the success of the CMS effort. In addition, we grate-fully acknowledge the computing centers and personnel of the Worldwide LHC Computing Grid for delivering so effectively the computing infrastructure essential to our analyses. Fi-nally, we acknowledge the enduring support for the construction and operation of the LHC and the CMS detector provided by the following funding agencies: the Austrian Federal Min-istry of Science, Research and Economy and the Austrian Science Fund; the Belgian Fonds de la Recherche Scientifique, and Fonds voor Wetenschappelijk Onderzoek; the Brazilian Fund-ing Agencies (CNPq, CAPES, FAPERJ, and FAPESP); the Bulgarian Ministry of Education and Science; CERN; the Chinese Academy of Sciences, Ministry of Science and Technology, and Na-tional Natural Science Foundation of China; the Colombian Funding Agency (COLCIENCIAS); the Croatian Ministry of Science, Education and Sport, and the Croatian Science Foundation; the Research Promotion Foundation, Cyprus; the Ministry of Education and Research, Esto-nian Research Council via IUT23-4 and IUT23-6 and European Regional Development Fund, Estonia; the Academy of Finland, Finnish Ministry of Education and Culture, and Helsinki Institute of Physics; the Institut National de Physique Nucl´eaire et de Physique des Partic-ules / CNRS, and Commissariat `a l’ ´Energie Atomique et aux ´Energies Alternatives / CEA, France; the Bundesministerium f ¨ur Bildung und Forschung, Deutsche Forschungsgemeinschaft, and Helmholtz-Gemeinschaft Deutscher Forschungszentren, Germany; the General Secretariat
17
for Research and Technology, Greece; the National Scientific Research Foundation, and Na-tional Innovation Office, Hungary; the Department of Atomic Energy and the Department of Science and Technology, India; the Institute for Studies in Theoretical Physics and Mathematics, Iran; the Science Foundation, Ireland; the Istituto Nazionale di Fisica Nucleare, Italy; the Min-istry of Science, ICT and Future Planning, and National Research Foundation (NRF), Repub-lic of Korea; the Lithuanian Academy of Sciences; the Ministry of Education, and University of Malaya (Malaysia); the Mexican Funding Agencies (BUAP, CINVESTAV, CONACYT, LNS, SEP, and UASLP-FAI); the Ministry of Business, Innovation and Employment, New Zealand; the Pakistan Atomic Energy Commission; the Ministry of Science and Higher Education and the National Science Center, Poland; the Fundac¸˜ao para a Ciˆencia e a Tecnologia, Portugal; JINR, Dubna; the Ministry of Education and Science of the Russian Federation, the Federal Agency of Atomic Energy of the Russian Federation, Russian Academy of Sciences, and the Russian Foundation for Basic Research; the Ministry of Education, Science and Technologi-cal Development of Serbia; the Secretar´ıa de Estado de Investigaci ´on, Desarrollo e Innovaci ´on and Programa Consolider-Ingenio 2010, Spain; the Swiss Funding Agencies (ETH Board, ETH Zurich, PSI, SNF, UniZH, Canton Zurich, and SER); the Ministry of Science and Technology, Taipei; the Thailand Center of Excellence in Physics, the Institute for the Promotion of Teach-ing Science and Technology of Thailand, Special Task Force for ActivatTeach-ing Research and the National Science and Technology Development Agency of Thailand; the Scientific and Techni-cal Research Council of Turkey, and Turkish Atomic Energy Authority; the National Academy of Sciences of Ukraine, and State Fund for Fundamental Researches, Ukraine; the Science and Technology Facilities Council, UK; the US Department of Energy, and the US National Science Foundation.
Individuals have received support from the Marie-Curie program and the European Research Council and EPLANET (European Union); the Leventis Foundation; the A. P. Sloan Founda-tion; the Alexander von Humboldt FoundaFounda-tion; the Belgian Federal Science Policy Office; the Fonds pour la Formation `a la Recherche dans l’Industrie et dans l’Agriculture (FRIA-Belgium); the Agentschap voor Innovatie door Wetenschap en Technologie (IWT-Belgium); the Ministry of Education, Youth and Sports (MEYS) of the Czech Republic; the Council of Science and In-dustrial Research, India; the HOMING PLUS program of the Foundation for Polish Science, cofinanced from European Union, Regional Development Fund; the Mobility Plus program of the Ministry of Science and Higher Education (Poland); the OPUS program of the National Science Center (Poland); MIUR project 20108T4XTM (Italy); the Thalis and Aristeia programs cofinanced by EU-ESF and the Greek NSRF; the National Priorities Research Program by Qatar National Research Fund; the Rachadapisek Sompot Fund for Postdoctoral Fellowship, Chu-lalongkorn University (Thailand); the ChuChu-lalongkorn Academic into Its 2nd Century Project Advancement Project (Thailand); and the Welch Foundation, contract C-1845.
References
[1] CMS Collaboration, “The CMS experiment at the CERN LHC”, JINST 3 (2008) S08004, doi:10.1088/1748-0221/3/08/S08004.
[2] ATLAS Collaboration, “The ATLAS experiment at the CERN Large Hadron Collider”, JINST 3 (2008) S08003, doi:10.1088/1748-0221/3/08/S08003.
[3] CMS Collaboration, “Measurement of differential top-quark pair production cross sections in pp colisions at√s=7 TeV”, Eur. Phys. J. C 73 (2013) 2339,
doi:10.1140/epjc/s10052-013-2339-4, arXiv:1211.2220.
[4] CMS Collaboration, “Measurement of the differential cross section for top quark pair production in pp collisions at√s =8 TeV”, Eur. Phys. J. C 75 (2015) 542,
doi:10.1140/epjc/s10052-015-3709-x, arXiv:1505.04480.
[5] CMS Collaboration, “Measurement of the tt production cross section in the all-jets final state in pp collisions at√s =8 TeV”, Eur. Phys. J. C 76 (2016) 128,
doi:10.1140/epjc/s10052-016-3956-5, arXiv:1509.06076. [6] ATLAS Collaboration, “Measurements of top quark pair relative differential
cross-sections with ATLAS in pp collisions at√s =7 TeV”, Eur. Phys. J. C 73 (2013) 2261, doi:10.1140/epjc/s10052-012-2261-1, arXiv:1207.5644.
[7] ATLAS Collaboration, “Measurements of normalized differential cross sections for tt production in pp collisions at√s =7 TeV using the ATLAS detector”, Phys. Rev. D 90 (2014) 072004, doi:10.1103/PhysRevD.90.072004, arXiv:1407.0371.
[8] ATLAS Collaboration, “Differential top-antitop cross-section measurements as a function of observables constructed from final-state particles using pp collisions at√s =7 TeV in the ATLAS detector”, JHEP 06 (2015) 100, doi:10.1007/JHEP06(2015)100,
arXiv:1502.05923.
[9] ATLAS Collaboration, “Measurements of top-quark pair differential cross-sections in the lepton+jets channel in pp collisions at√s=8 TeV using the ATLAS detector”, (2015). arXiv:1511.04716. Submitted to EPJC.
[10] R. Frederix and F. Maltoni, “Top pair invariant mass distribution: a window on new physics”, JHEP 01 (2009) 047, doi:10.1088/1126-6708/2009/01/047,
arXiv:0712.2355.
[11] ATLAS Collaboration, “Measurement of the differential cross-section of highly boosted top quarks as a function of their transverse momentum in√s = 8 TeV proton-proton collisions using the ATLAS detector”, Phys. Rev. D 93 (2016) 032009,
doi:10.1103/PhysRevD.93.032009, arXiv:1510.03818.
[12] CMS Collaboration, “Searches for new physics using the tt invariant mass distribution in pp collisions at√s =8 TeV”, Phys. Rev. Lett. 111 (2013) 211804,
doi:10.1103/PhysRevLett.111.211804, arXiv:1309.2030. [Erratum: doi:10.1103/PhysRevLett.112.119903].
[13] CMS Collaboration, “Search for resonant tt production in proton-proton collisions at√ s =8 TeV”, Phys. Rev. D 93 (2016) 012001, doi:10.1103/PhysRevD.93.012001, arXiv:1506.03062.
References 19
[14] CMS Collaboration, “Particle-flow event reconstruction in CMS and performance for jets, taus, and EmissT ”, CMS Physics Analysis Summary CMS-PAS-PFT-09-001, 2009.
[15] CMS Collaboration, “Commissioning of the particle-flow event reconstruction with the first LHC collisions recorded in the CMS detector”, CMS Physics Analysis Summary CMS-PAS-PFT-10-001, 2010.
[16] CMS Collaboration, “CMS luminosity based on pixel cluster counting – summer 2013 update”, CMS Physics Analysis Summary CMS-PAS-LUM-13-001, 2013.
[17] P. Nason, “A new method for combining NLO QCD with shower Monte Carlo algorithms”, JHEP 11 (2004) 040, doi:10.1088/1126-6708/2004/11/040, arXiv:hep-ph/0409146.
[18] S. Frixione, P. Nason, and C. Oleari, “Matching NLO QCD computations with Parton Shower simulations: the POWHEG method”, JHEP 11 (2007) 070,
doi:10.1088/1126-6708/2007/11/070, arXiv:0709.2092.
[19] S. Alioli, P. Nason, C. Oleari, and E. Re, “A general framework for implementing NLO calculations in shower Monte Carlo programs: the POWHEG BOX”, JHEP 06 (2010) 043, doi:10.1007/JHEP06(2010)043, arXiv:1002.2581.
[20] J. M. Campbell, R. K. Ellis, P. Nason, and E. Re, “Top-pair production and decay at NLO matched with parton showers”, JHEP 04 (2015) 114,
doi:10.1007/JHEP04(2015)114, arXiv:1412.1828.
[21] S. Alioli, P. Nason, C. Oleari, and E. Re, “NLO single-top production matched with shower in POWHEG: s- and t-channel contributions”, JHEP 09 (2009) 111,
doi:10.1088/1126-6708/2009/09/111, arXiv:0907.4076. [Erratum: doi:10.1007/JHEP02(2010)011].
[22] J. Alwall et al., “The automated computation of tree-level and next-to-leading order differential cross sections, and their matching to parton shower simulations”, JHEP 07 (2014) 079, doi:10.1007/JHEP07(2014)079, arXiv:1405.0301.
[23] S. Frixione and B. R. Webber, “Matching NLO QCD computations and parton shower simulations”, JHEP 06 (2002) 029, doi:10.1088/1126-6708/2002/06/029, arXiv:hep-ph/0204244.
[24] G. Corcella et al., “HERWIG 6: An Event generator for hadron emission reactions with interfering gluons (including supersymmetric processes)”, JHEP 01 (2001) 010, doi:10.1088/1126-6708/2001/01/010, arXiv:hep-ph/0011363.
[25] T. Sj ¨ostrand, S. Mrenna, and P. Skands, “PYTHIA 6.4 physics and manual”, JHEP 05 (2006) 026, doi:10.1088/1126-6708/2006/05/026, arXiv:hep-ph/0603175. [26] M. L. Mangano, M. Moretti, F. Piccinini, and M. Treccani, “Matching matrix elements and
shower evolution for top-quark production in hadronic collisions”, JHEP 01 (2007) 013, doi:10.1088/1126-6708/2007/01/013, arXiv:hep-ph/0611129.
[27] R. Field, “Early LHC underlying event data – findings and surprises”, in Hadron collider physics. Proceedings, 22nd Conference, HCP 2010, Toronto, Canada, August 23-27, 2010. 2010. arXiv:1010.3558.
[28] J. Pumplin et al., “New generation of parton distributions with uncertainties from global QCD analysis”, JHEP 07 (2002) 012, doi:10.1088/1126-6708/2002/07/012, arXiv:hep-ph/0201195.
[29] J. Gao et al., “CT10 next-to-next-to-leading order global analysis of QCD”, Phys. Rev. D
89(2014) 033009, doi:10.1103/PhysRevD.89.033009, arXiv:1302.6246. [30] GEANT4 Collaboration, “GEANT4—a simulation toolkit”, Nucl. Instrum. Meth. A 506
(2003) 250, doi:10.1016/S0168-9002(03)01368-8.
[31] CMS Collaboration, “Determination of jet energy calibration and transverse momentum resolution in CMS”, JINST 6 (2011) P11002,
doi:10.1088/1748-0221/6/11/P11002, arXiv:1107.4277.
[32] M. Cacciari, G. P. Salam, and G. Soyez, “The catchment area of jets”, JHEP 04 (2008) 005, doi:10.1088/1126-6708/2008/04/005, arXiv:0802.1188.
[33] M. Cacciari, G. P. Salam, and G. Soyez, “FastJet user manual”, Eur. Phys. J. C 72 (2012) 1896, doi:10.1140/epjc/s10052-012-1896-2, arXiv:1111.6097.
[34] M. Cacciari, G. P. Salam, and G. Soyez, “The anti-ktjet clustering algorithm”, JHEP 04
(2008) 063, doi:10.1088/1126-6708/2008/04/063, arXiv:0802.1189.
[35] CMS Collaboration, “Identification of b-quark jets with the CMS experiment”, JINST 8 (2013) P04013, doi:10.1088/1748-0221/8/04/P04013, arXiv:1211.4462. [36] CMS Collaboration, “Performance of b-tagging at√s=8 TeV in multijet, tt and boosted
topology events”, CMS Physics Analysis Summary CMS-PAS-BTV-13-001, 2013. [37] M. Wobisch and T. Wengler, “Hadronization corrections to jet cross sections in
deep-inelastic scattering”, (1998). arXiv:hep-ph/9907280.
[38] Y. L. Dokshitzer, G. D. Leder, S. Moretti, and B. R. Webber, “Better jet clustering algorithms”, JHEP 08 (1997) 001, doi:10.1088/1126-6708/1997/08/001, arXiv:hep-ph/9707323.
[39] CMS Collaboration, “Boosted top jet tagging at CMS”, CMS Physics Analysis Summary CMS-PAS-JME-13-007, 2014.
[40] CMS Collaboration, “Performance of electron reconstruction and selection with the CMS detector in proton-proton collisions at√s=8 TeV”, JINST 10 (2015) P06005,
doi:10.1088/1748-0221/10/06/P06005, arXiv:1502.02701.
[41] CMS Collaboration, “Performance of CMS muon reconstruction in pp collision events at√ s =7 TeV”, JINST 7 (2012) P10002, doi:10.1088/1748-0221/7/10/P10002, arXiv:1206.4071.
[42] CMS Collaboration, “Studies of jet mass in dijet and W/Z + jet events”, JHEP 05 (2013) 090, doi:10.1007/JHEP05(2013)090, arXiv:1303.4811.
[43] CMS Collaboration, “Measurement of the inelastic proton-proton cross section at√s=7 TeV”, Phys. Lett. B 722 (2013) 5, doi:10.1016/j.physletb.2013.03.024,
References 21
[44] A. D. Martin, W. J. Stirling, R. S. Thorne, and G. Watt, “Parton distributions for the LHC”, Eur. Phys. J. C 63 (2009) 189, doi:10.1140/epjc/s10052-009-1072-5,
arXiv:0901.0002.
[45] R. D. Ball et al., “Parton distributions with LHC data”, Nucl. Phys. B 867 (2013) 244, doi:10.1016/j.nuclphysb.2012.10.003, arXiv:1207.1303.
[46] S. Alekhin et al., “The PDF4LHC Working Group interim report”, (2011). arXiv:1101.0536.
[47] M. Botje et al., “The PDF4LHC Working Group interim recommendations”, (2011). arXiv:1101.0538.
[48] J. Ott, “The Theta package”,. http://www.theta-framework.org/. [49] M. Czakon and A. Mitov, “Top++: a program for the calculation of the top-pair
cross-section at hadron colliders”, Comput. Phys. Commun. 185 (2014) 2930, doi:10.1016/j.cpc.2014.06.021, arXiv:1112.5675.
[50] A. H ¨ocker and V. Kartvelishvili, “SVD approach to data unfolding”, Nucl. Instrum. Meth. A 372 (1996) 469, doi:10.1016/0168-9002(95)01478-0,
arXiv:hep-ph/9509307.
[51] T. Adye, “Unfolding algorithms and tests using RooUnfold”, in PHYSTAT 2011 Workshop on Statistical Issues Related to Discovery Claims in Search Experiments and Unfolding,
H. Prosper and L. Lyons, eds., p. 313. Geneva, Switzerland, 2011. arXiv:1105.1160. doi:10.5170/CERN-2011-006.313.
[52] M. Czakon, D. Heymes, and A. Mitov, “Dynamical scales for multi-TeV top-pair production at the LHC”, (2016). arXiv:1606.03350.
[53] NNPDF Collaboration, “Parton distributions for the LHC Run II”, JHEP 04 (2015) 040, doi:10.1007/JHEP04(2015)040, arXiv:1410.8849.
[54] S. Dulat et al., “New parton distribution functions from a global analysis of quantum chromodynamics”, Phys. Rev. D 93 (2016) 033006,
doi:10.1103/PhysRevD.93.033006, arXiv:1506.07443.
[55] L. A. Harland-Lang, A. D. Martin, P. Motylinski, and R. S. Thorne, “Parton distributions in the LHC era: MMHT 2014 PDFs”, Eur. Phys. J. C 75 (2015) 204,
doi:10.1140/epjc/s10052-015-3397-6, arXiv:1412.3989.
[56] N. Kidonakis, “NNNLO soft-gluon corrections for the top-quark pT and rapidity
distributions”, Phys. Rev. D 91 (2015) 031501, doi:10.1103/PhysRevD.91.031501, arXiv:1411.2633.
23
A
The CMS Collaboration
Yerevan Physics Institute, Yerevan, Armenia
V. Khachatryan, A.M. Sirunyan, A. Tumasyan
Institut f ¨ur Hochenergiephysik der OeAW, Wien, Austria
W. Adam, E. Asilar, T. Bergauer, J. Brandstetter, E. Brondolin, M. Dragicevic, J. Er ¨o, M. Flechl, M. Friedl, R. Fr ¨uhwirth1, V.M. Ghete, C. Hartl, N. H ¨ormann, J. Hrubec, M. Jeitler1, A. K ¨onig, M. Krammer1, I. Kr¨atschmer, D. Liko, T. Matsushita, I. Mikulec, D. Rabady, N. Rad,
B. Rahbaran, H. Rohringer, J. Schieck1, J. Strauss, W. Treberer-Treberspurg, W. Waltenberger, C.-E. Wulz1
National Centre for Particle and High Energy Physics, Minsk, Belarus
V. Mossolov, N. Shumeiko, J. Suarez Gonzalez
Universiteit Antwerpen, Antwerpen, Belgium
S. Alderweireldt, T. Cornelis, E.A. De Wolf, X. Janssen, A. Knutsson, J. Lauwers, S. Luyckx, M. Van De Klundert, H. Van Haevermaet, P. Van Mechelen, N. Van Remortel, A. Van Spilbeeck
Vrije Universiteit Brussel, Brussel, Belgium
S. Abu Zeid, F. Blekman, J. D’Hondt, N. Daci, I. De Bruyn, K. Deroover, N. Heracleous, J. Keaveney, S. Lowette, S. Moortgat, L. Moreels, A. Olbrechts, Q. Python, D. Strom, S. Tavernier, W. Van Doninck, P. Van Mulders, I. Van Parijs
Universit´e Libre de Bruxelles, Bruxelles, Belgium
H. Brun, C. Caillol, B. Clerbaux, G. De Lentdecker, G. Fasanella, L. Favart, R. Goldouzian, A. Grebenyuk, G. Karapostoli, T. Lenzi, A. L´eonard, T. Maerschalk, A. Marinov, A. Randle-conde, T. Seva, C. Vander Velde, P. Vanlaer, R. Yonamine, F. Zenoni, F. Zhang2
Ghent University, Ghent, Belgium
L. Benucci, A. Cimmino, S. Crucy, D. Dobur, A. Fagot, G. Garcia, M. Gul, J. Mccartin, A.A. Ocampo Rios, D. Poyraz, D. Ryckbosch, S. Salva, R. Sch ¨ofbeck, M. Sigamani, M. Tytgat, W. Van Driessche, E. Yazgan, N. Zaganidis
Universit´e Catholique de Louvain, Louvain-la-Neuve, Belgium
C. Beluffi3, O. Bondu, S. Brochet, G. Bruno, A. Caudron, L. Ceard, S. De Visscher, C. Delaere, M. Delcourt, D. Favart, L. Forthomme, A. Giammanco, A. Jafari, P. Jez, M. Komm, V. Lemaitre, A. Mertens, M. Musich, C. Nuttens, K. Piotrzkowski, L. Quertenmont, M. Selvaggi, M. Vidal Marono
Universit´e de Mons, Mons, Belgium
N. Beliy, G.H. Hammad
Centro Brasileiro de Pesquisas Fisicas, Rio de Janeiro, Brazil
W.L. Ald´a J ´unior, F.L. Alves, G.A. Alves, L. Brito, M. Correa Martins Junior, M. Hamer, C. Hensel, A. Moraes, M.E. Pol, P. Rebello Teles
Universidade do Estado do Rio de Janeiro, Rio de Janeiro, Brazil
E. Belchior Batista Das Chagas, W. Carvalho, J. Chinellato4, A. Cust ´odio, E.M. Da Costa, D. De Jesus Damiao, C. De Oliveira Martins, S. Fonseca De Souza, L.M. Huertas Guativa, H. Malbouisson, D. Matos Figueiredo, C. Mora Herrera, L. Mundim, H. Nogima, W.L. Prado Da Silva, A. Santoro, A. Sznajder, E.J. Tonelli Manganote4, A. Vilela Pereira
Universidade Estadual Paulistaa, Universidade Federal do ABCb, S˜ao Paulo, Brazil
E.M. Gregoresb, P.G. Mercadanteb, C.S. Moona,5, S.F. Novaesa, Sandra S. Padulaa, D. Romero Abadb, J.C. Ruiz Vargas
Institute for Nuclear Research and Nuclear Energy, Sofia, Bulgaria
A. Aleksandrov, R. Hadjiiska, P. Iaydjiev, M. Rodozov, S. Stoykova, G. Sultanov, M. Vutova
University of Sofia, Sofia, Bulgaria
A. Dimitrov, I. Glushkov, L. Litov, B. Pavlov, P. Petkov
Beihang University, Beijing, China
W. Fang6
Institute of High Energy Physics, Beijing, China
M. Ahmad, J.G. Bian, G.M. Chen, H.S. Chen, M. Chen, T. Cheng, R. Du, C.H. Jiang, D. Leggat, R. Plestina7, F. Romeo, S.M. Shaheen, A. Spiezia, J. Tao, C. Wang, Z. Wang, H. Zhang
State Key Laboratory of Nuclear Physics and Technology, Peking University, Beijing, China
C. Asawatangtrakuldee, Y. Ban, Q. Li, S. Liu, Y. Mao, S.J. Qian, D. Wang, Z. Xu
Universidad de Los Andes, Bogota, Colombia
C. Avila, A. Cabrera, L.F. Chaparro Sierra, C. Florez, J.P. Gomez, B. Gomez Moreno, J.C. Sanabria
University of Split, Faculty of Electrical Engineering, Mechanical Engineering and Naval Architecture, Split, Croatia
N. Godinovic, D. Lelas, I. Puljak, P.M. Ribeiro Cipriano
University of Split, Faculty of Science, Split, Croatia
Z. Antunovic, M. Kovac
Institute Rudjer Boskovic, Zagreb, Croatia
V. Brigljevic, D. Ferencek, K. Kadija, J. Luetic, S. Micanovic, L. Sudic
University of Cyprus, Nicosia, Cyprus
A. Attikis, G. Mavromanolakis, J. Mousa, C. Nicolaou, F. Ptochos, P.A. Razis, H. Rykaczewski
Charles University, Prague, Czech Republic
M. Finger8, M. Finger Jr.8
Universidad San Francisco de Quito, Quito, Ecuador
E. Carrera Jarrin
Academy of Scientific Research and Technology of the Arab Republic of Egypt, Egyptian Network of High Energy Physics, Cairo, Egypt
Y. Assran9,10, A. Ellithi Kamel11,11, A. Mahrous12, A. Radi10,13
National Institute of Chemical Physics and Biophysics, Tallinn, Estonia
B. Calpas, M. Kadastik, M. Murumaa, L. Perrini, M. Raidal, A. Tiko, C. Veelken
Department of Physics, University of Helsinki, Helsinki, Finland
P. Eerola, J. Pekkanen, M. Voutilainen
Helsinki Institute of Physics, Helsinki, Finland
J. H¨ark ¨onen, V. Karim¨aki, R. Kinnunen, T. Lamp´en, K. Lassila-Perini, S. Lehti, T. Lind´en, P. Luukka, T. Peltola, J. Tuominiemi, E. Tuovinen, L. Wendland
Lappeenranta University of Technology, Lappeenranta, Finland