A Work Project, presented as part of the requirements for the Award of a Master Degree in Management from the NOVA – School of Business and Economics.
MEASURING THE SOCIAL VALUE OF ASSISTED REPRODUCTIVE TECHNOLOGY
MARGARIDA DO CARMO PINTO BASTO MONTANHA REBELO 3747
A Project carried out on the Master in Management Program, under the supervision of: Professor Pedro Pita Barros
1
Abstract
Reproductive behavioural patterns are undoubtedly changing with the increasing popularity of Assisted Reproductive Technologies (ART). While fulfilling a couple’s wish to be parents, the social value of ART is not easy to quantify. This work project aims at quantifying this by measuring the economic value that one person adds to the state, by creating a model that calculates net transfers with the state throughout the individual’s lifetime. Under average circumstances, the Net Present Value (NPV) of an ART-conceived individual was calculated to be € 20,424.96. Different scenarios were tested, and the work component (namely taxes and pensions) was found to be the most determinant element.
Key Words: Assisted Reproductive Technology, Economic Value of ART, Long-term
2
1. Introduction
Human infertility is a complex condition, which may be caused by several mechanisms – some are curable, but others are not. For cases with no natural solution, ART has appeared as a substitutive method. As it becomes more common, it is important to carefully study ART’s implications, in several spheres. Hence, the investigation question behind this paper was “What is the social value of ART?” and it was answered from an economic perspective, by measuring the value that ART creates in the relationship between an individual and the state of Portugal.
In order to quantify it in a considered manner, a model was developed to assess financial transfers between an average individual and the state and, by comparison, to evaluate if a medically assisted conception would decrease this value. The conclusion was that under average circumstances, the NPV of an ART-conceived individual is € 20,424.96. Several scenarios were considered in order to understand what could significantly change this value and the lowest calculated NPV was equal to -€ 6925.04, in a scenario considering a discount rate of 7%. The paper further compares results to similar models from the existing literature, allowing for an assessment of where Portugal lies in contrast with other countries – overall corresponding to the 8th highest NPV (out of 14), under average conditions.
The general structure of the paper is as follows: section 1 consists of an introduction, section 2 provides general information on infertility and ART, section 3 presents further literature review, section 4 describes the methodology used to develop the model, section 5 introduces the results from the model, and section 6 presents final remarks.
2. Background: Infertility and ART
The incapacity to bear children is tragic for numerous people around the world, being impactful on physical, psychological and social levels. The condition is described by the World Health Organization as “a disease of the reproductive system, defined by the failure to achieve a clinical pregnancy after 12 months or more of regular unprotected sexual intercourse.” (WHO,
3
2018). The concept of infertility is debated, as are many aspects around the topic – definitions and concepts vary across countries, languages and contexts. This contributes to challenges in sharing and reporting information (Zegers-Hochschild, 2009).
Despite the struggle in identifying authentic cases of infertility, the most recent studies estimate it affects between 8 and 12% of couples in the reproductive age stage worldwide (Wyns, 2018). In 10 to 20% of cases, no cause is identified (ESHRE, 2018). Several lifestyle aspects have been related to infertility (such as bodyweight, stress and tobacco). Age is also a key factor: fertility starts declining when women are around 25-30 years old, and most studies suggest women are only able to conceive unaided until they are 40-41 (Wyns, 2018). This is especially relevant nowadays as offspring are more frequently delayed for various reasons – a key trend being that while women previously often dedicated their lives to motherhood, many now work. Personal and socio-economic factors create tension between couples’ desire to have children and, at the same time, the need to delay their births (Habbema, 2015). This increases the number of women who cannot successfully carry children, and thus widens the fertility gap (the difference between the desired or planned number of children and the actual one).
Infertility not only affects couples at a personal level, but also impacts society on a larger scale. We presently live in a world that simultaneously desperately needs to control its population growth while paradoxically facing a fertility issue. On one side, it is obvious that many regions are overpopulated, resulting in inefficient sharing of resources and enhanced inequality; on the other, it becomes evident that the increasing prevalence of infertility is happening simultaneous to a preference for a small family, which has been progressively adopted in the Western world. According to the World Bank, Portugal’s fertility rate in 2016 was of 1.31 births per woman (The World Bank, 2017) – far from 2.1, the generally accepted level to stabilize the population structure (Hoorens, 2007).
4
The reduced number of births, the ageing population, the smaller family pattern and the outward migration trends combine to invert the population pyramid; while the structure of the population decisively affects the balance of public budgets. By dividing a population into 3 major age groups, one can visualize a lifecycle of interactions with the state, in which an individual is a net receiver, then a contributor, and then a receiver again. Net receivers use services without contributing to the budget at that time. Net contributors, on the other hand, must provide enough to off-set government spending with benefits and services for themselves and for net receivers (Pinheiro, 2018). The inverted population pyramid contributes to an unbalance between these two roles. In 2016, Portugal presented an old-age dependency ratio of 31.8 per 100 working people (Eurostat, 2018). A higher dependency causes economic issues such as heavier tax burdens on certain generations; a smaller population base from which to collect taxes, possibly leading to the insolvency of certain institutions or funds; amongst others. Such an imbalance is likely to be heightened as fertility rates remain below replenishment levels. ART may therefore mitigate some of the consequences of infertility: on one side by contributing, even if marginally, for the country to have a stable population, adequately distributed amongst the age groups, which generates healthier public finances; and on the other side by allowing couples to accomplish their profound aspirations to become parents.
ART is the name for all procedures performed to generate a pregnancy which involve in
vitro manipulation of gametes or embryos. It includes In-Vitro Fertilization (IVF),
Intra-Cytoplasmatic Sperm Injection (ICSI) with embryo transfer, and others (Zegers-Hochschild, 2009). Its history began 40 years ago, with the first IVF-conceived baby; and, though it is hard to precisely establish numbers, it is estimated that about 0.1% of the total world population has now been conceived through ART (Faddy, 2018). This translates to over 7 million babies – most of whom born to women aged between 30 and 39 (ESHRE, 2018). In the most recent statistics by ESHRE from 2014, 39 European countries reported a total of close to 800.000 IVF
5
births (ESHRE, 2018). Countries like Korea and Sweden have optimized public subsidy of ART in order to compensate for their low birth rates (Connolly, 2009). In Portugal, ART started in July 1985 and, currently, 27 centres are authorized to perform ART procedures (10 public and 17 private), resulting in 2,504 births in 2015 – amounting to 2.9% of all births in the same year. The overall demand for these procedures is increasing, but national and international figures are still far from the projected total global needs, although the availability of ART has increased greatly, due to both a better coverage and socio-cultural aspects (Ferraretti, 2017).
There are several factors influencing the total usage of ART. Two are obviously medical recommendation and legality, which depend on each country’s specific legislation. In Portugal, the initial law established that ART could only be accessed by infertile couples, but it has since been changed to include a broader group of people (Diário da República, 2017). Another factor is the accessibility to ART – while financial resources were initially thought to be the most determinant factor, several studies have proved accessibility to be more relevant. State subsidies, ease in obtaining loans, insurance protocols, and other practices enable average couples to undertake such investments (Chambers, 2014). Countries with reimbursement plans achieve higher utilization rates, as couples bear the investment upfront but get paid back (Ata, 2010). Other social factors, such as culture, have been found to be relevant – even when affordability is not an issue, a couple will not undergo ART if it is not an acceptable practice in society (Präg, 2017). These are all important aspects to consider when designing subsidy policies. ART is often seen by many of the involved parties as a medical luxury, making it susceptible to financing cuts, despite the empirical evidence that it represents a safe financial investment (Molenaar, 2014). Further studying and evaluating the economic value of ART may be important for policy design.
6
3. Literature Review
For the literature review, several databases (especially, but not only, PubMed) were used. Research keywords included “Economic value of ART”, “Long-term financial impact of ART”, amongst others; the research was as exhaustive as possible but with limitations, as this study is not meant as a meta-analysis. After careful publication review, 9 articles were found to use a similar approach, suggesting it is possible to perform such a study and that its methodology is already relatively standardized. Overall, most authors considered that ART presents an attractive return on investment in their respective countries, even though values may vary. Values are adjusted to each country’s specificities – different social security policies, tax rates, and legislative frameworks governing financial interactions. Specific results of these articles are further-on discussed, in comparison to the ones from this study.
In spite of ART being a fairly recent technique, its economic value has already been subject to several studies. Authors have tried to assess it through quantification of the monetary benefits accruing to the state attributed to ART-conceived individuals. These studies made it possible to evaluate if the economic value attributed to ART is enough to offset the initial investment it carries or if ART is being funded by taxes and represents a financial burden on the rest of society. The methodology they use is based on Generational Accounting (GA).
GA is used to calculate the fiscal burden that living generations face, according to current fiscal conditions and extrapolating them onto future generations (Kotlikoff, 1994). The main goal of GA is to understand if the current fiscal policies are designed to sustain governmental programs – that is, if the tax burden is evenly distributed across generations, or if a past generation has left the future ones in debt, or if the current one will do so (Auerbach, 1999). Applied to ART, this methodology enables value measurement by quantifying the economic transfers generated by an individual during their lifetime. These include any benefits that an average individual will receive in a lifetime, such as health and education, as well as one’s dues
7
such as income tax, value added taxes, old-age pensions, amongst others. Net contributions are calculated by adding both “both positive and negative transfers to and from the state (Molenaar, 2014), and a final NPV is calculated by discounting these transfers to the present year. This general framework ultimately allows to assess whether an ART-conceived individual is a net receiver or contributor to public finances.
4. Methodology
A) Qualitative description of model and its assumptions
After the literature review, a baseline approach was designed: a GA based model was built to estimate financial transactions between ART-conceived singletons and the Portuguese government over their projected lifetime. Given the predictable expenditures and revenues at each age, the net financial contribution (NFC) of each individual per category i, at year t, was calculated as the sum of all economic components. The equation underlying this calculation is the following: (1) NFCt = Tt - H t - E t - PS t, where NFCt represents net transfers of an individual at any given point in time t, T is the tax revenue that the government receives, H represents healthcare costs, E represents education benefits and PS represents pensions. Applying this equation results in a net tax contribution or deficit to the state, at each moment in time, t.
Subsequently, the NPV was derived as the sum of the NFC for each year, multiplied by the discount factor and the probability of being alive. This is demonstrated by the baseline equation: (2) NPV = ∑𝑡 ∑ 𝑖 𝑔𝑖𝑡𝛽𝑡𝜋
𝑡− 𝐼0𝑡 = ∑ 𝑁𝑡 𝑡𝛽𝑡𝜋𝑡, where t represents each time period, i is a given item from public finances, git is the public expense (if <0) or gain (if >0) per individual in category i at time t (NFC in formula(1)), β is the discount factor (𝛽 = 1
1+𝑟, where r is the rate of discount), πt is the probability of being alive at time t and I0 is the initial investment in ART. An initial base-case scenario was defined, and different scenarios were tested afterwards. Several assumptions were made, in order to simplify and give consistency and structure to the
8
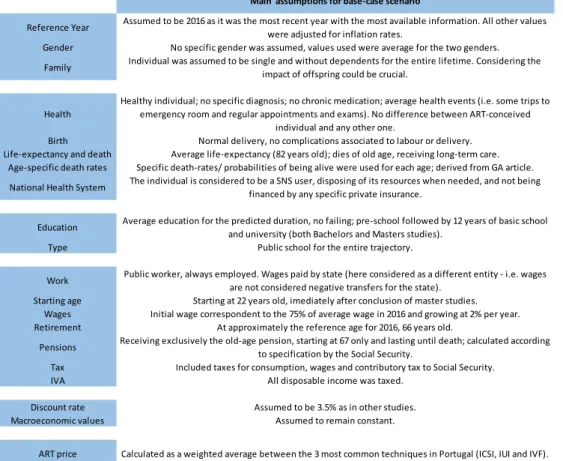
model (described on table 1). The first one was that the new-born individual was considered average in all aspects – education, earnings and health. This assumption is based i) on the fact that no homogeneity was found in the profiles of individuals using ART – that is, couples which undertake ART may be represented by a random sample of the population; and ii) no specific life trajectory for ART-conceived individuals was so far described and correlated with the techniques. Namely, ART does not determine that individuals are more prone to any health condition, social status, or academic or work path. An IVF-conceived 23-year-old girl was inclusively interviewed for empirical information on her life-course (MCR, 2018).
Table 1 - Main assumptions undertaken for base-case scenario
Furthermore, the individual was expected to live through the average life expectancy (81.3 years old, as defined by PorData). Age Specific Death Rates (ASDR) were used for the probability of the individual to be alive at each point in time – these were derived from a GA model developed for Portugal (Pinheiro, 2018). A typical life trajectory was established and divided into six major phases: i) Pre-school: 0-6 years old; ii) Primary Education: 6-15 years
Main assumptions for base-case scenario
Reference Year Assumed to be 2016 as it was the most recent year with the most available information. All other values
were adjusted for inflation rates.
Gender No specific gender was assumed, values used were average for the two genders.
Family Individual was assumed to be single and without dependents for the entire lifetime. Considering the
impact of offspring could be crucial.
Health
Healthy individual; no specific diagnosis; no chronic medication; average health events (i.e. some trips to emergency room and regular appointments and exams). No difference between ART-conceived
individual and any other one.
Birth Normal delivery, no complications associated to labour or delivery.
Life-expectancy and death Average life-expectancy (82 years old); dies of old age, receiving long-term care.
Age-specific death rates Specific death-rates/ probabilities of being alive were used for each age; derived from GA article.
National Health System The individual is considered to be a SNS user, disposing of its resources when needed, and not being
financed by any specific private insurance.
Education Average education for the predicted duration, no failing; pre-school followed by 12 years of basic school
and university (both Bachelors and Masters studies).
Type Public school for the entire trajectory.
Work Public worker, always employed. Wages paid by state (here considered as a different entity - i.e. wages
are not considered negative transfers for the state).
Starting age Starting at 22 years old, imediately after conclusion of master studies.
Wages Initial wage correspondent to the 75% of average wage in 2016 and growing at 2% per year.
Retirement At approximately the reference age for 2016, 66 years old.
Pensions Receiving exclusively the old-age pension, starting at 67 only and lasting until death; calculated according
to specification by the Social Security.
Tax Included taxes for consumption, wages and contributory tax to Social Security.
IVA All disposable income was taxed.
Discount rate Assumed to be 3.5% as in other studies.
Macroeconomic values Assumed to remain constant.
9
old; iii) Secondary Education: 15-18 years old; iv) Superior Education: 18-21 years old; v) Employment: 22-65 years old; vi) Retirement: over 66 years old.
The base-case year was set as 2016, as it was the latest year for which most necessary data was available. Values from earlier years were adjusted for inflation. Regarding the discount rate, there is frequently some uncertainty around the proper value to use. It is mainly influenced by the risk regarding public revenues and expenditures (Pinheiro, 2018), which differs between countries. As the value depends significantly on the outlook of sustainability of public finances, for Portugal, forecasting an accurate value is challenging, as the 2011 crisis was extremely impactful – even requiring financial aid from the EU – and thus the global economic context is hard to predict. Taking this in consideration, a discount rate of 3.5% was used for the base-case, similarly to studies for the UK and Spain. Inflation was not explicitly considered but is implicitly accounted for in the growth of nominal values, as these change according to general inflation, mimicking current patterns; the error associated with trying to predict future inflation rates would be too large. Other unmentioned economic values were also assumed to evolve with the global economy.
The price of ART was considered an initial investment and subtracted from the measured NPV for a statistical life. This price was a weighted average between the 3 most common techniques in Portugal (ICSI, IUI and IVF). These respective prices were also calculated as an average of the prices of the currently authorized centres in the country, as detailed in their websites (values for 2018, detailed on table 1 of Appendix 2). Assumptions specific to each public finance item are detailed on the next section.
B) Quantification of net transfers
The central challenge of this investigation was indeed to quantify each element and define net transfer values for the considered categories (health, education and labour pensions). Several sources were used, such as 1) Instituto Nacional de Estatística’s (INE) large public
10
database from which many values were inferred, particularly from the IDEF 2015/2016 report; 2) PorData, a database using information from official sources, which is organized into a contemporary compilation of important statistics for Portugal and Europe; 3) Diagnosis Related Group reference values (DRG), established by the Ministry of Health to serve as references for hospitals and healthcare centres to define their prices; 4) Other sources included the OECD, the World Bank, the WHO, the Ministry of Education and Court of Auditors, amongst others. The results were integrated into an Excel spreadsheet (refer to table 1 in Appendix 1 to visualize its structure), which generally followed the above-mentioned equation for the NPV, adding the NFCs for each category, discounted to the present year and added across the years.
1) Health: Studies looking for possible differences between health conditions in ART and normally conceived individuals were considered, but none highlighted significant disparities. The need for more studies is pressing, not only to understand ART’s potential impact in health matters, but also to prevent avoidable complications, if they do exist (Fauser, 2014) (Mulder, 2018). Some differences were found but were mostly attributed either to the underlying causes of infertility or to the advanced age of the mother (TACOG, 2016). Therefore, the individual was considered to undergo average health events, and also to be a National Health System (SNS) user as opposed to having a private insurance. The assumptions underlying net transfer calculations are described below. These transfers result in expenses for the state.
i) Delivery costs were for normal vaginal births, as there are no studies confirming the need for any specific measures for the delivery of an ART-conceived individual. The DRG value was used (DRG 560, Severity Level 2): € 667.911. These DRGs were established in 2015 and were not adjusted for 2016, as they are reference values and would still be in use by hospitals then.
1Alternatively, to account for the presumably higher probability of prematurity, the value for preterm labour could have
11
ii) Hospital stays were firstly distributed amongst the age groups. Data for this distribution was not easy to find, as there is no official estimation. However, a study from the Directorate General of Health (DGS) that collected important figures for morbidity and mortality in hospitals in 2013 allowed for these calculations (Nogueira, 2015). After obtaining the proportions for each age group, the total number of hospital stays (in days) was calculated using the figures available from PorData. For continental Portugal, the number was clear (6.938.958 days) but for the autonomous regions, an average number of days per stay was calculated (and found to be equal to 6) and multiplied by the number of total stays, available in the same database. This distribution assigned 53% of total costs to individuals over 65 years old, consistent with other studies completed in Portugal (DGS, 2014). All these stays were assumed to take place at public hospitals. A total of 7.265.732 was obtained and multiplied by the average price, € 889.7, an average value calculated for 2014 by the Portuguese Healthcare Regulation Authority (Soares, 2014) and adjusted for inflation until 2016. This average value takes into consideration the most expensive cases but also the cheapest ones – further studies could increase accuracy by calculating a weighted average considering the relative frequency of each type of stay. The costs for each age group were then divided by the total population in each of them, as provided by INE. It required some adjustments, as the division in age-groups was not an exact match – hence, for each age-group in the INE tables, an equal distribution per year was assumed. After costs were assigned to each group, they were divided by the number of years in the age group correspondent to INE’s (once again assuming an equal distribution), in order to calculate how much one individual spends in hospital stays per year. This assumption is fairly inconsequent, as the total figure will still be attributed to the same person, and the years at which the cost will take place are not so distant for the difference to be relevant.
iii) Appointments with doctors were also distributed amongst age groups and specialties. Only appointments in the SNS were measured, and two types were considered –
12
hospital and health centers. For the former, the total number was provided by PorData and the age proportion was replicated from a study conducted for the CHLN (Sousa, 2014). For the latter, the number of appointments per age group was provided by a study on Primary Healthcare by the Independent Syndicate of Doctors (SIM, 2017). Values used were calculated for people with no diagnosed diseases (as we are assuming the average individual to be healthy). For both types of consultations, the average price was assumed to be given by the DRG value (with a weighted average between the price of first appointments and follow-ups).
iv) Emergency room: The total number of 6.405.707 was retrieved from a report by the Ministry of Health (Minitério da Saúde, 2016). The average price was the DRG value for Serviço de Urgência Médico-Cirúrgico, the second type of emergency episode considered in the SNS (Diário da Repúbloca, 2017). The age distribution was retrieved from the 1st report.
v) Long-term care (LTC): the information available for Portugal is limited and does not allow for calculations to determine the specific probability of one eventually needing LTC, nor the average duration per person. Therefore, estimations for the USA were used as a proxy (Kemper, 2005) and the average price was retrieved from an article for Portugal (Pereira, 2011) and adjusted for 2016, according to inflation rates and in the absence of a specific price index. Individuals were considered to need LTC for the last three years of their lifetime.
2) Education: There is no evidence of causal relationships between being ART-conceived and receiving better education. Hence, calculations were made for an average student in a public school – the Portuguese Education system offers Pre-school from 3 to 6 years old, followed by
Basic-School – 1st cycle for 4 years, 2nd cycle for 2, 3rd for 3 others – and
Secondary/Professional School for 3 years. After this, education is optional but there are several
public universities at accessible prices, with Bachelor-studies lasting for an average 3 years and Master-studies for another 1 or 2 (a 1,5 year-long masters was considered). Resulting transfers are expenses for the state.
13
i) Pre-school: OECD reported the annual average cost per child in Portugal to be € 5,932 (Silva, 2017). Adjusting for 2016, a value of € 5,896.6.
ii) Basic School: in 2012, the Portuguese government requested a study to determine the amount that the Ministry of Education and Culture paid for the entire compulsory education of one student. Adjusting for inflation, € 372.10 were assumed for each of the 12 years of studies.
iii) University (Superior) Education: the government budget for 2016 planned a € 1.055 billion for superior education. Divided by the total number of students (figure provided by PorData), each student will cost the government approximately € 2,960 for education purposes. 3) Work and tax: As for the other categories, there are no indications that ART-conceived individuals will have a different work trajectory than normally conceived ones. The individual was hence considered to start working at the age of 22, after achieving a master’s degree. Considering a 4.5-year long University studies, the individual would only be working for the second-half of the 22nd year. Retirement age was established right after 66 years old, as the reference for 2016 was 66.3 years old (Diário da República, 2014). The individual was considered a public worker, but wages were not accounted for as transfers with the state.
i) Wages: the starting wage was assumed to be € 693.68, 75% of the average wage in 2016, as provided by PorData. Only a percentage of the average value was considered, i) in order to acknowledge that initial salary values are generally lower that the average wage, and ii) at the same time maintaining the assumption that the individual is average (and hence starting with the minimum wage would not be logical). An annual growth rate of 2% was applied to simulate a typical career progression. This value was calculated based on a study from the Bank of Portugal (Banco de Portugal, BP) (Portugal, 2018), which presents real values for average salary per age, not conditional to other factors. This allows for the calculation of a growth rate for each year, the average of which was found to be the 2% rate used. However, two important findings arose from this study. Firstly, salary decreases after the age of 44, which presently may
14
mean that this age group of the labour force is less educated. This emphasizes the relevance of considering conditional values. Secondly, salary increases more rapidly in the initial years of work. This may mean that applying an average growth rate will underestimate the global effect. These findings were not incorporated in the base-case scenario, but in an alternative scenario.
ii) Imposto sobre o Rendimento de Pessoas Singulares: the IRS is the tax that any individual must pay on his earnings over a certain amount. The taxed rate depends on the total annual wages, varying with career progression. Reference tables for a single individual with no dependent household members for 2016 were used (ATA, 2018). In further studies, it would be interesting to consider an eventual marriage and children; this analysis was not performed. The net transfer of IRS represents a gain for the state.
iii) Imposto sobre o Valor Acrescentado: IVA is the tax applied to consumption. It was calculated by estimating an average tax rate per age group and then applying it to the disposable income (DI)2. To do this, initially, consumption was derived from the IDEF and summed for each age group. It was then divided amongst the number of individuals inquired, to obtain an average consumption per type of service or good per individual. Afterwards, official tax rates per category were applied to each type of service or good in each age group, and total IVA per age group was compared to total consumption, in order to calculate an average tax rate per age-group, derived from real-life findings and then applied to DI.
iv) Contributory tax: according to the legislation, Social Security (SS) must receive a total of 34.75% of earned wages, as a contributory tax, paid by both the individual (11% of the wage) and the company employing the individual (23.5% over the earned wage). These rates were applied to annual salaries and resulted in net positive transfers to the state.
2 DI was calculated by multiplying total available earnings (wages minus taxes: IRS and contributory tax) by the consumption
rate (1-average saving rate per age-group, as detailed in the IDEF). DI was assumed as what each individual can freely and will fully spend on various goods).
15
v) Old-age pension: access to old-age pensions is regulated according to the contributory career made by the individual – that is, the pension value is dependent on the total tax paid during lifetime. The longer the individual works, and the higher the wagesreceived, the higher the tax paid, and hence the larger the pensions. Pension rates are updated annually and take into consideration several indicators such as the GDP and the variation in average consumer prices (SS, 2018). A monthly value of € 1060.84 was obtained using SS specific indications, and it represents an expense for the state.
C) Sensitivity & Scenario analysis
As mentioned above, the initial case was built assuming an average individual, but for a broader perspective, a sensitivity analysis was performed. Different scenarios were tested presuming the exact same conditions as the base-case, except for changes in one single variable. Table 2 in Appendix 1 shows scenario characteristics and results. Scenarios were as follows (numbers correspond to scenario numbers): 1, 2: changed variable was the discount rate, considering values of 1% and 7%; 3, 4: the highest and lowest values found for ART price in the existing literature were used (Brazil and UK, respectively); 5, 6: retirement was considered at the age of 60 and 70 years old; 7, 8: scenarios assumed an initial wage correspondent to the minimum and to 1.5x the average wage; 9, 10: annual wage growth rates of 0% and of 4.5% before 44 years old and 0% after were assumed; 11, 12: instead of assuming permanent employment, employment rates per age (as of 2016) were considered, or one year of unemployment every 5 years – an unemployment pension was considered for the unemployed years, calculated with specific SS indications and otherwise, similar conditions were considered (e.g. expenditure and consequent taxes remain equal to the previous year and wages increase at the same rate as before); 13, 14: the individual was assumed to attend public school but only for basic education or only private school, including university; 15, 16: the considered life expectancy was of only 66 years or up to 90 years old.
16
5. Results
For the base-case scenario, a total NPV of € 20,424.96 was calculated for the average ART-conceived individual, compared to the € 23,734.54 correspondent to the average naturally ART-conceived one. For the ART-conceived, the break-even age was reached at 38, two years after the naturally conceived individual. The average individual was estimated to generate a total of € 80,437.83 in revenues, through the respective lifetime. Furthermore, considering ART as an initial investment, its rate of return was calculated as 6.17. Though values are aligned with literature review in suggesting that ART may be a safe investment, it is important to remember that the developed model underestimates the total incremental economic value of a new individual for the state, as it considers only his/her fiscal consequences but not those of the individual’s offspring – suggesting total value could be higher.
Graph 1 – Cumulative NPV curve for the average lifetime
Graph 1 shows the slope that results from plotting the NPV results against time. It is a downward sloping line in the beginning, as education is the main cost for the government and the individual is considered a net receiver. The line starts rising when the individual begins working and becomes a net contributor. It eventually crosses the axis when the NPV equals zero, at the break-even age. Before retirement, the maximum NPV is reached and with retirement, the slope once again turns down, as tax contributions decrease while benefits are still transferred from the state to the individual, for a decreasing NPV.
17
The results for the base-case scenario were in line with literature review findings. Table 2 presents the outcomes for other countries in which similar studies have been conducted, including the ones of this study, for comparison. Denmark presents the highest NPV, about 7.5 times the NPV calculated for Portugal, while Spain’s is only 2.2 times this value. Only the Netherlands and Brazil (and Portugal, under certain economic circumstances) obtained a negative NPV. Overall, Portugal’s values corresponded to the 8th and 13th highest values (with discount rates of 3.5% and 7%, respectively), which may be a consequence of varied economic and socio-political aspects. In fact, certain values involved in the calculations have simple interpretations. For example, the price of ART will reflect the costliness of the underlying healthcare system, as well as the impact of subsidy policies and insurance mandates (Chambers, 2009). Tax contributions can be higher if higher tax rates are established, often seen in unfavourable economic contexts or when a country is trying to recover from a post-crisis. Revenues per individual also translate the cost of living in each country – e.g. the UK will have individuals generating higher nominal revenues, but a lower return rate, as the initial investment is higher. The rate of return (calculated as the NPV of the ART-conceived individual over the initial investment) simultaneously considers the cost of living and of the underlying health system.
Table 2 – Comparison between the investigation’s results and findings from literature review.
Country Discoun t rate N P V Break -ev en age N r N P V N P V (€ )* Break -ev en age Tax contribution Rev enues per indiv idual
Cost of IVF Cost of IVF (€ ) * N RI Belarus (1 ) 9 $ 21,702.00 € 19,097.76 $ 5,509.00 € 4,847.92 Brazil (2 ) 4% $ 83,486.65 31 4 $ 61,428.65 € 54,057.21 40 $ 22,058.00 € 19,411.04 7% $ 21,494.86 32 12 $ -563.00 -€ 495.44 - $ 22,057.86 € 19,410.92 Denmark (3 ) 1 € 154,100.00 € 154,100.00 Greece (4 ) 39 3 € 60,435.00 € 60,435.00 39-41 € 133,947.00 € 17,015.00 € 17,015.00 1.82 K azhak hstan (1 ) 11 $ 2,295.00 € 2,019.60 Japan (5 ) $ 3,956.00 P ortugal 3.5% € 23,734.54 36 8 € 20,424.96 € 20,424.96 38 € 80,437.83 € 3,309.58 6.17 7% -€ 3,615.47 0 13 -€ 6,925.04 -€ 6,925.04 0 € 21,032.38 -2.09 Spain (6 ) 3.5% € 54,672.00 5 € 45,672.00 € 45,672.00 34 € 534,624.00 € 9,000.00 € 9,000.00 5.07 5% € 40,868.00 6 € 31,868.00 € 31,868.00 38 € 280,062.00 3.54 Sweden (7 ) 40 7 SEK 254,000.00 € 24,638.00 41 The N etherlands (8 ) -€ 70,392.00 14 -€ 81,374.00 -€ 81,374.00 U k raine (1 ) 10 $ 9,839.00 € 8,658.32 $ 2,599.00 € 2,287.12 U nited K ingdom (9 ) 3.5% £ 122,127.00 2 £ 109,939.00 € 122,032.29 £ 603,000.00 £ 12,931.00 € 14,353.41 8.50
References and notes: (1 ) Mandrik O, K. S. (2015). Economic value of in vitro fertilization in Ukraine, Belarus and Kazakhstan. ClinicoEconomics and Outcomes Research, 347-356. (2 ) Kröger GB, E. D. (2011). The fiscal outcome of artificil conception in Brazil - creating citizens in developing countries. Human Reproduction, 142-145. (3 ) Connolly MP, P. M. (2011). The
long-term fiscal impact of funding cuts to Danish public fertility clinics. Reproductive Biomedicine Online. (4 ) Fragoulakis V, M. N. (2017). Estimating the long-long-term effects of in vitro fertilization in Greece: an analysis based on a lifetime-investment model. ClinicoEconomis and Outcomes Research, 247-255. (5 ) Chambers GM, S. A. (2009). The economic impact of assisted reproductive technology: a review of selected developed countries. Fertility and Sterility, 2281-2894. (6 ) Villoro R, G.-D. A.-C. (2013). Long-term fiscal implications of funding assisted reproductive therapies: A generational accouting model for Spain. ISPOR 16th annual european congress. Dublin. (7 ) Svensson A, C. M. (2008). Long-term fiscal implications of subsidizing in-vitro fertilization in Sweden: a lifetime tax perspective. Scandinavian Journal of Public Health, 841-849. (8 ) Molenaar LM, C. M. (2014). Costs and benefits of individuals conceived after IVVF: a net
tax evaluation in The Netherlands. Reproductive BioMedicine Online, 239-245. (9 ) Connolly M, G. F. (2009). Assessing long-run economic benefits attributed to an IVF-conceived singleton based on projected lifetime net tax contributions in the UK. Human Reproduction, Vol 24, No 3. 626-632. (N r) is the number correspondent to the ordering of NPV values from largest (1) to
smaller (14) (*) Conversion rates were used as of December 2018. (N P V) Net Present Value. (N RI) Net return on investment.
18
As for the sensitivity and scenario analysis, several possibilities were considered, as described above. Results are presented in table 2 in Appendix 1, and the respective NPVs were plotted in Graph 1 on Appendix 2, for easier visualization. These scenarios were useful to understand which finance item’s value changes are more impactful and how they affect the NPV. Overall, the NPV was predominantly positive, despite variation. However, ART resulted in an expense for the state under 4 scenarios i) when the discount rate was 7%, ii) when there was no wage growth, iii) when the individual was unemployed for 1 year, every 5 years, and iv) when the individual lived to 90 years old. This is an important investigation, to determine the circumstances under which ART may be prejudicial for the state (ignoring other possible non-economic social benefits). Underlying these results is the important finding that career progression and consequent taxes and pensions are the most impactful factors. This is also supported by the characteristics of the scenario resulting in the highest NPV - its initial wage was 1.5x the average salary. The impact of the work component on the final NPV is only logical, as most contributions from the individual to the state arise from taxes on earnings and consumption, and these same earnings determine to what the benefits received will amount.
Other important conclusions were inferred. i) If the economic context is unfavourable and consequently the discount rate is higher, the NPV will lower. ii) A higher ART price will decrease the NPV but will not make it negative, taking into consideration average prices in Portugal. iii) An earlier retirement will decrease the NPV, but so will a later one, as a longer contributory career generally means higher wages and hence higher pensions with state expenses increasing. iv) Lower or higher initial wages are both impactful. v) If there is no annual wage growth, the NPV will strongly decrease. Furthermore, an annual growth that takes into consideration a more realistic career progression, by growing at a rate of 4.5% before the age of 44 and then stabilizing, will provide a very interesting scenario. It captures the impact of an initial rapid growth (with a consequent earlier break-even age, and heavy contributions
19
which will be less discounted by the cost of capital – resulting in a higher NPV) serving as a realistic proxy. vi) Unemployment, too, will have an impact, decreasing the total NPV by reducing tax contributions and increasing negative transfers for the state, through pensions. vii) A different academic may increase the NPV. If costs with education are lower, or even non-existent to the state, the NPV will be higher and the break-even will be reached earlier, as education costs are significant negative transfers, in earlier stages of life. viii) Lastly, a shorter or longer life will be impactful, with the individual having more value to the government if dying earlier, before retirement, and a lower value if dying long after retirement.
6. Final Remarks
The results of this investigation confirm that, if ART is considered an investment by the government and its return is measured by an economic model that assesses the financial transfers between the generated individual and the state, investing in these techniques is not harmful for public finance, under the most reasonable scenarios. The fact that the resulting NPV is most frequently positive can be interpreted as an indication that ART is an attractive investment to the state, and hence funding it represents a good use of public resources, as it will likely generate economic rewards in the future. This may even be the case for countries with less prosperous economies, especially if considering other benefits. These could be the economic benefits related to an individual’s offspring, which would also be impactful in the long-term, or other non-economic benefits. Some may be the overall effect of closing the fertility gap, with subsequent demographic and fiscal effects, but also the mitigation of infertility’s psychological, social and even clinical consequences.
Another important finding from this study was the different impact of the categories of financial transfers with the state (health, education and work). Transfers such as tax and pensions, which are related to labour (and especially to wages) were the most determinant for the final results. This is so because firstly, positive contributions to the state are all determined
20
by the individual’s earnings (IRS and contributory tax depend on wages, IVA depends on consumption which depends on disposable income, which depends on earnings); secondly, pensions depend on how much the individual has contributed to the government through tax, and the smaller the pension, the more is retained by the government.
Regarding health, its costs for the government are globally distributed throughout an average lifetime, showing higher values for the beginning and end of life, but without major differences between the values. Education costs, however, only exist in the first years of life, but represent an important element, as they are large costs and take place at an early stage of life, with consequent less impact of the discount factor on the final value. Other elements of public expenses – such as costs related to security, sovereignty, defence, etc. – were not directly considered. This was so because total costs were considered not to change significantly with the existence of one individual – one additional person has a marginal impact and a public good with fixed costs will not be sensitive to it.
Although this study was built on an extensive research, ultimately answering the question underlying it, further improvements could be made in subsequent investigations. One would be to find more precise and detailed data (e.g. in order to more accurately determine the value for initial salary, or to more precisely estimate LTC costs). Furthermore, other variables could be considered to enlarge the scope of the investigation. For example, some authors studied the difference between the value generated by males versus females – and Molenaar et al (2014) inclusively found the NPV of ART-conceived males to be almost three times the value generated by females. Other variables to analyse could be the age of the mother (and if it can change the NPV in any way), the number of babies born from one single treatment (sharing the fixed costs), amongst others.
Another interesting analysis stemming from this study could be to design strategies to enhance the value of ART, after analysing the different scenarios. One strategy could be to
21
optimize the timing and number of cycles per age group, to increase the probability of conceiving, while also decreasing the number of multiple pregnancies, which carry more risks. Another strategy could be to leverage on the relatively low cost of ART in Portugal to achieve a higher return rate. Such an analysis may be important when designing policies for further subsidies – and, when doing so, other ethical concerns must be contemplated.
It is important to consider that ART is expensive for individuals, but affordable from the society’s perspective and hence governments may be charged with the responsibility of providing it to its citizens. However, ethical concerns remain – does it make sense for ART to be a healthcare priority? For one, it does not always exactly correct the problem of infertility – it frequently only becomes close to natural reproduction (particularly when it involves gamete donation, surrogacy or others, such as for same-sex couples). From a justice and equality perspective, does it make sense to finance these procedures, which are not a treatment but rather a secondary need, when so many diseases remain untreated? And does it make sense to generate life when, simultaneously there were 16.000 abortions in Portugal in 2016 (PorData, 2016)? Where can one find and define limits and how do these translate into actual policies? All these questions need to be assessed in timely manner, so that ART may be used in a responsible manner. Individual and national interests must be aligned when designing policies – never forgetting the need to protect minorities, but also remembering to support policies that will be sustainable in the long run.
7. Bibliography
Aduaneira, ATA - Autoridade Tributária e. 2018. "Tabelas de retenção do IRS." Autoridade
Tributária e Aduaneira.
Ata, Baris, and Emre Seli. 2010. "Economics of assisted reproductive technologies." Current
Opinion in Obstetrics and Gynecology.
Auerbach, Alan J, Jagadeesh Gokhale, and Laurence J Kotlikoff. 1999. "Generational Accounts: a meaningful alternative to deficit accounting." University of Chicago.
22
Borght, Mélodie Vander, and Christine Wyns. 2018. "Fertility and infertility: Definition and epidemiology." Clinical biochemistry.
Chambers GM, Sullivan AE, Ishihara O, Chapman GM, Adamson D. 2009. "The economic impact of assisted reproductive technology: a review of selected developed countries." Fertility
and Sterility 2281-2894.
Connolly, Mark P, Gallo F, Hoorens S, and W Ledger. 2009. "Assessing long-run economic benefits attributed to an IVF-conceived singleton based on projected lifetime net tax contributions in the UK." Human Reproduction Vol 24, No 3. 626-632.
Connolly, Mark P, Marteen J Postma, Simone Crespi, Anders Nyboe Andersend, and Søren Ziebed. 2011. "The long-term fiscal impact of funding cuts to Danish public fertility clinics." Reproductive Biomedicine Online.
Diário da República. 2014 .1.ª série — N.º 249 — 26 de dezembro.,—. 2015. 1.ª série — N.º 153 — 7 de agosto de 2015. 2014. 2.ª série — N.º 2 - 3 de janeiro de 2014." Lisboa.
Direção-Geral da Saúde. 2014. PORTUGAL idade maior em números. Lisboa: Direção de Serviços de Informação e Análise - DGS.
Eurostat. 2018. Tables, Graphs and Maps Interface (TGM) tables. August 17. https://ec.europa.eu/eurostat/tgm/table.do?tab=table&init=1&language=en&pcode=tps00198 &plugin=1.
Faddy, Malcom J, Matthew D Gosden, and Roger G Gosden. 2018. "A demographic projection of the contribution of assisted reproductive technologies to world population growth." Reproductive Biomedicine Online Volume 36, Issue 4, Pages 455–458.
Fauser, BC, P Devroey, K Diedrich, B Balaban, M Bonduelle, HA Delemarre-van de Waal, C Estella, et al. 2014. "Health outcomes of children born after IVF/ICSI: a review of current expert opinion and literature." Reproductive Biomedicine Online 162-182.
Ferraretti, A.P., K. Nygren, A. Nyboe Andersen, J. de Mouzon, M. Kupka, C. Calhaz-Jorge, C. Wyns, L. Gianaroli, V. Goossens, and for the European Society of Human Reproduction and Embryology (ESHRE) The European IVF-Monitoring Consortium (EIM). 2017. "Trends over 15 years in ART in Europe: an analysis of 6 million cycles." Human Reproduction Open. Habbema, JD, Marinus J Eijkemans, Henri Leridon, and Egbert R te Velde. 2015. "Realizing a desired family size: when should couples start?" Human Reproduction 2215-2221.
Hoorens, S, F Gallo, JAK Cave, and JC Grant. 2007. "Can assisted reproductive technologies help to offset population ageing? An assessment of the demographic and economic impact of ART in Denmark and UK." Human Reproduction 2471-2474.
Kemper, Peter, Harriet L Komisar, and Lisa Alecxih. 2005-2006. "Long-term care over an uncertain future: what can current retirees expect?" Inquiry: a journal of medical care
organization, provision and financing 335-50.
Kotlikoff, Laurence J, Alan J Auerbach, and Jagadeesh Gokhale. 1994. "Generational Accounting: A Meaningful Way to Evaluate Fiscal Policy." Journal of Economic Perspectives,
volume 8 73-94.
Molenaar, LM, Mark P Connolly, B Huisman, MJ Postma, PGA Hompes, F van der Veen, and BWJ Mol. 2014. "Costs and benefits of individuals conceived after IVVF: a net tax evaluation in The Netherlands." Reproductive BioMedicine Online 239-245.
23
Mulder, Callista L, Joana B Serrano, Lisa AE Catsburg, Tessa J Roseboom, Sjoerd Repping, and van Pelt Ans MM. 2018. "A practical blueprint to systematically study life-long health consequences of novel medically assisted reproductive treatments." Human Reproduction 784-792.
Nogueira, Paulo J, Andreia S Costa, and e Rosa Matilde V. 2015. "A publicação Morbilidade Hospitalar (Serviço Nacional de Saúde) 2013: conhecer e interpretar." Portugal - Saúde em
números - Revista Científica da Direção-Geral da Saúde, October: 15.
Pereira, Pedro Manuel Afonso. 2011. "Viabilidade Económico – Financeira do Projecto da Unidade de Cuidados Continuados Integrados de Longa Duração e Manutenção da Fundação COI." Dissertação para a Obtenção do Grau de Mestre em Gestão da Saúde.
Pinheiro, Jorge. 2018. Generational Accounting for Portugal. Lisboa: Universidade Católica Portuguesa.
Portugal, Pedro, Pedro Raposo, and Hugo Reis. 2018. "Sobre a distribuição de salários e a dispersão salarial."
Präg, Patrick, and Mills Melinda C. 2017. "Cultural determinants influence assisted reproduction usage in Europe more than economic and demographic factors." Human
Reproduction 2305–2314.
Silva, Samuel. 2017. Famílias portuguesas estão entre as que mais gastam com o
pré-escolar. June 21.
https://www.publico.pt/2017/06/21/sociedade/noticia/familias-portuguesas-estao-entre-as-que-mais-gastam-com-o-preescolar-1776384.
SIM - Sindicato Independente dos Médicos. 2017. "DIMENSÃO PONDERADA DAS LISTAS DE UTENTES DOS MÉDICOS DE FAMÍLIA."
Soares, Manuela Goucha. 2014. Estado paga 880 euros por cada dia de internamento no
SNS. 04 10.
https://expresso.sapo.pt/sociedade/estado-paga-880-euros-por-cada-dia-de-internamento-no-sns=f865020.
Sousa, Rafaela Rosa de. 2014. "Caraterização do acesso ao Centro Hospitalar Lisboa Norte, EPE : análise do acesso e da utilização da consulta externa e da urgência do Centro Hospitalar Lisboa Norte, EPE." ENSP: GOSS - Dissertações de Mestrado.
SS - Segurança Social. 2018. Pensão de velhice. November 2018. http://www.seg-social.pt/pensao-de-velhice.
The American College of Obstetricians and Gynecologists. 2016. Perinatal Risks associated
with Assisted Reproductive Technology. September.
https://www.acog.org/Clinical-Guidance- and-Publications/Committee-Opinions/Committee-on-Obstetric-Practice/Perinatal-Risks-Associated-With-Assisted-Reproductive-Technology?IsMobileSet=false.
The World Bank. 2017. Fertility rate,
total.https://data.worldbank.org/indicator/SP.DYN.TFRT.IN. WHO. 2018. Infertility
definitionsandterminology. https://www.who.int/reproductivehealth/topics/infertility/definitio
ns/en/.
Zegers-Hochschild, Fernando, David G Adamson, Silke Dyer, Catherine Racowsky, Jacques de Mouzone, Rebecca Sokol, Laura Rienzig, et al. 2009. "International Committee for Monitoring Assisted Reproductive Technology (ICMART) and the World Health Organization (WHO) revised glossary of ART terminology, 2009." Fertility and Sterility Vol. 92, No. 5 1520-524.
24 Appendix 1 Id a d e B ir th s H o sp it a l st a y s A p p o in tm e n ts LT C ER P ro b a b il it y o f b e in g e m p lo y e d W a g e IR S O ld -a g e p e n si o n IV A D is co u n t fa ct o r IV F c o st T o ta l T o ta l x d is co u n t C u m u la ti v e N P V N P V a v e ra g e A R T c o st R e v e n u e s C u m u la ti v e re v e n u e s * d is co u n t ra te R a te o f re tu rn To ta l H M In d iv id u al Co m p an y 2016 0 1 1 1 1 6 6 7 .9 1 -€ 2 1 .5 1 -€ 1 0 1 .9 3 -€ 2 6 7 .9 9 -€ 3 .5 % € 3 ,3 0 9 .5 8 1 ,0 5 9 .3 4 -€ -1 0 5 9 .3 3 8 1 3 9 1 ,0 5 9 .3 4 -€ 4 ,3 6 8 .9 2 -€ -€ -€ -1 .3 2 2017 1 0 .7 7 5 5 5 0 .2 2 4 4 5 0 .2 4 0 4 7 0 .2 0 7 4 4 2 1 .5 1 -€ 1 0 1 .9 3 -€ 7 9 .1 7 -€ 1 5 7 .1 4 -€ -1 5 1 .8 2 4 8 7 1 6 1 ,2 1 1 .1 6 -€ 4 ,5 2 0 .7 4 -€ -€ -€ -1 .3 7 2018 2 0 .9 7 2 9 0 .0 2 7 1 0 .0 2 9 4 8 0 .0 2 4 5 8 2 1 .5 1 -€ 1 0 1 .9 3 -€ 7 9 .1 7 -€ 1 9 7 .1 2 -€ -1 8 4 .0 1 7 2 6 7 2 1 ,3 9 5 .1 8 -€ 4 ,7 0 4 .7 6 -€ -€ -€ -1 .4 2 2019 3 0 .9 8 5 1 4 0 .0 1 4 8 6 0 .0 1 6 5 0 .0 1 3 1 3 2 1 .5 1 -€ 1 0 1 .9 3 -€ 7 9 .1 7 -€ 5 ,8 9 6 .6 2 -€ 6 ,0 9 6 .2 2 -€ -5 4 9 8 .4 4 4 8 1 4 6 ,8 9 3 .6 3 -€ 1 0 ,2 0 3 .2 0 -€ -€ -€ -3 .0 8 2020 4 0 .9 8 8 5 5 0 .0 1 1 4 5 0 .0 1 2 1 3 0 .0 1 0 7 3 2 1 .5 1 -€ 1 0 1 .9 3 -€ 7 9 .1 7 -€ 5 ,8 9 6 .6 2 -€ 6 ,0 9 6 .9 2 -€ -5 3 1 3 .1 0 9 8 3 1 1 2 ,2 0 6 .7 3 -€ 1 5 ,5 1 6 .3 1 -€ -€ -€ -4 .6 9 2021 5 0 .9 8 9 7 7 0 .0 1 0 2 3 0 .0 0 9 9 3 0 .0 1 0 5 4 2 1 .5 1 -€ 9 3 .5 5 -€ 7 9 .1 7 -€ 5 ,8 9 6 .6 2 -€ 6 ,0 8 8 .8 7 -€ -5 1 2 6 .6 6 8 0 7 8 1 7 ,3 3 3 .4 0 -€ 2 0 ,6 4 2 .9 8 -€ -€ -€ -6 .2 4 2022 6 0 .9 8 7 9 2 0 .0 1 2 0 8 0 .0 1 1 7 3 0 .0 1 2 4 5 2 1 .5 1 -€ 9 3 .5 5 -€ 7 9 .1 7 -€ 3 7 2 .0 1 -€ 5 6 3 .9 0 -€ -4 5 8 .7 3 4 6 9 8 1 1 7 ,7 9 2 .1 4 -€ 2 1 ,1 0 1 .7 1 -€ -€ -€ -6 .3 8 2023 7 0 .9 8 9 0 7 0 .0 1 0 9 3 0 .0 1 1 5 8 0 .0 1 0 2 4 2 1 .5 1 -€ 9 3 .5 5 -€ 7 9 .1 7 -€ 3 7 2 .0 1 -€ 5 6 4 .1 3 -€ -4 4 3 .3 9 8 2 0 5 6 1 8 ,2 3 5 .5 4 -€ 2 1 ,5 4 5 .1 1 -€ -€ -€ -6 .5 1 2024 8 0 .9 9 0 1 8 0 .0 0 9 8 2 0 .0 0 9 5 4 0 .0 1 0 1 2 2 1 .5 1 -€ 9 3 .5 5 -€ 7 9 .1 7 -€ 3 7 2 .0 1 -€ 5 6 4 .3 4 -€ -4 2 8 .5 6 7 0 4 9 6 1 8 ,6 6 4 .1 0 -€ 2 1 ,9 7 3 .6 8 -€ -€ -€ -6 .6 4 2025 9 0 .9 9 1 1 5 0 .0 0 8 8 5 0 .0 0 9 5 7 0 .0 0 8 0 8 2 1 .5 1 -€ 9 3 .5 5 -€ 7 9 .1 7 -€ 3 7 2 .0 1 -€ 5 6 4 .5 3 -€ -4 1 4 .2 1 3 5 5 4 8 1 9 ,0 7 8 .3 2 -€ 2 2 ,3 8 7 .8 9 -€ -€ -€ -6 .7 6 2026 10 0 .9 9 1 4 4 0 .0 0 8 5 6 0 .0 0 7 4 4 0 .0 0 9 7 5 2 1 .5 1 -€ 6 3 .2 8 -€ 7 9 .1 7 -€ 3 7 2 .0 1 -€ 5 3 4 .5 8 -€ -3 7 8 .9 7 2 1 3 0 9 1 9 ,4 5 7 .2 9 -€ 2 2 ,7 6 6 .8 7 -€ -€ -€ -6 .8 8 2027 11 0 .9 8 8 9 8 0 .0 1 1 0 2 0 .0 1 0 6 6 0 .0 1 1 4 2 1 .5 1 -€ 6 3 .2 8 -€ 7 9 .1 7 -€ 3 7 2 .0 1 -€ 5 3 4 .1 8 -€ -3 6 5 .8 8 1 3 7 2 4 1 9 ,8 2 3 .1 7 -€ 2 3 ,1 3 2 .7 5 -€ -€ -€ -6 .9 9 2028 12 0 .9 8 8 9 4 0 .0 1 1 0 6 0 .0 1 2 5 8 0 .0 0 9 4 7 2 1 .5 1 -€ 6 3 .2 8 -€ 7 9 .1 7 -€ 3 7 2 .0 1 -€ 5 3 4 .1 7 -€ -3 5 3 .5 0 3 3 8 1 7 2 0 ,1 7 6 .6 7 -€ 2 3 ,4 8 6 .2 5 -€ -€ -€ -7 .1 0 2029 13 0 .9 8 8 3 4 0 .0 1 1 6 6 0 .0 1 0 4 2 0 .0 1 2 9 8 2 1 .5 1 -€ 6 3 .2 8 -€ 7 9 .1 7 -€ 3 7 2 .0 1 -€ 5 3 4 .0 7 -€ -3 4 1 .4 8 6 7 6 9 1 2 0 ,5 1 8 .1 6 -€ 2 3 ,8 2 7 .7 4 -€ -€ -€ -7 .2 0 2030 14 0 .9 8 8 5 1 0 .0 1 1 4 9 0 .0 1 5 3 7 0 .0 0 7 3 3 2 1 .5 1 -€ 6 3 .2 8 -€ 7 9 .1 7 -€ 3 7 2 .0 1 -€ 5 3 4 .1 0 -€ -3 2 9 .9 5 5 8 8 1 4 2 0 ,8 4 8 .1 2 -€ 2 4 ,1 5 7 .6 9 -€ -€ -€ -7 .3 0 2031 15 0 .9 8 6 5 3 0 .0 1 3 4 7 0 .0 1 5 6 6 0 .0 1 1 1 4 1 5 .5 3 -€ 5 8 .5 0 -€ 7 9 .1 7 -€ 3 7 2 .0 1 -€ 62% 5 2 3 .1 5 -€ -3 1 2 .2 6 3 2 4 3 8 2 1 ,1 6 0 .3 8 -€ 2 4 ,4 6 9 .9 6 -€ -€ -€ -7 .3 9 2032 16 0 .9 7 9 8 7 0 .0 2 0 1 3 0 .0 2 5 0 4 0 .0 1 4 9 9 1 5 .5 3 -€ 5 8 .5 0 -€ 7 9 .1 7 -€ 3 7 2 .0 1 -€ 62% 5 2 2 .1 3 -€ -3 0 1 .1 1 5 0 3 1 5 2 1 ,4 6 1 .4 9 -€ 2 4 ,7 7 1 .0 7 -€ -€ -€ -7 .4 8 2033 17 0 .9 7 6 8 8 0 .0 2 3 1 2 0 .0 2 9 6 6 0 .0 1 6 3 2 1 5 .5 3 -€ 5 8 .5 0 -€ 7 9 .1 7 -€ 3 7 2 .0 1 -€ 62% 5 2 1 .6 7 -€ -2 9 0 .6 7 7 3 4 7 9 2 1 ,7 5 2 .1 7 -€ 2 5 ,0 6 1 .7 5 -€ -€ -€ -7 .5 7 2034 18 0 .9 7 3 7 4 0 .0 2 6 2 6 0 .0 4 0 3 2 0 .0 1 1 5 3 1 5 .5 3 -€ 5 8 .5 0 -€ 4 5 .8 2 -€ 2 ,9 6 0 .1 7 -€ 62% 3 ,0 7 6 .8 7 -€ -1 6 5 6 .4 6 8 3 5 1 2 3 ,4 0 8 .6 4 -€ 2 6 ,7 1 8 .2 2 -€ -€ -€ -8 .0 7 2035 19 0 .9 6 5 0 8 0 .0 3 4 9 2 0 .0 5 1 9 7 0 .0 1 7 2 8 1 5 .5 3 -€ 5 8 .5 0 -€ 4 5 .8 2 -€ 2 ,9 6 0 .1 7 -€ 62% 3 ,0 7 5 .8 3 -€ -1 5 9 9 .9 1 2 9 1 1 2 5 ,0 0 8 .5 5 -€ 2 8 ,3 1 8 .1 3 -€ -€ -€ -8 .5 6 2036 20 0 .9 6 2 7 6 0 .0 3 7 2 4 0 .0 5 6 5 8 0 .0 1 7 1 1 5 .5 3 -€ 7 0 .4 1 -€ 4 5 .8 2 -€ 2 ,9 6 0 .1 7 -€ 74% 3 ,0 8 7 .0 2 -€ -1 5 5 1 .4 3 2 4 3 7 2 6 ,5 5 9 .9 9 -€ 2 9 ,8 6 9 .5 6 -€ -€ -€ -9 .0 3 2037 21 0 .9 5 2 8 1 0 .0 4 7 1 9 0 .0 6 6 8 2 0 .0 2 6 5 6 1 5 .5 3 -€ 7 0 .4 1 -€ 4 5 .8 2 -€ 2 ,9 6 0 .1 7 -€ 74% 3 ,0 8 5 .7 1 -€ -1 4 9 8 .3 3 1 8 9 9 2 8 ,0 5 8 .3 2 -€ 3 1 ,3 6 7 .8 9 -€ -€ -€ -9 .4 8 2038 22 0 .9 5 1 1 2 0 .0 4 8 8 8 0 .0 7 7 0 9 0 .0 1 9 2 7 1 5 .5 3 -€ 7 0 .4 1 -€ 4 5 .8 2 -€ 1 ,4 8 0 .0 8 -€ 74% 4 ,1 6 2 .0 5 € 2 4 9 .7 2 € 3 5 4 .0 1 € 4 5 7 .8 3 € 9 8 8 .4 9 € 4 4 4 .6 4 € 2 0 8 .6 0 1 4 5 7 1 2 7 ,8 4 9 .7 2 -€ 3 1 ,1 5 9 .2 9 -€ 2 ,0 5 0 .0 4 € 7 1 .7 5 € -9 .4 1 2039 23 0 .9 4 9 0 .0 5 1 0 .0 7 8 6 4 0 .0 2 2 2 8 1 5 .5 3 -€ 7 0 .4 1 -€ 4 5 .8 2 -€ 74% 9 ,9 0 5 .6 8 € 5 9 4 .3 4 € 8 4 2 .5 4 € 1 ,0 8 9 .6 2 € 2 ,3 5 2 .6 0 € 4 ,7 5 4 .0 6 € 2 1 5 4 .9 4 5 7 4 2 2 5 ,6 9 4 .7 7 -€ 2 9 ,0 0 4 .3 5 -€ 4 ,8 7 9 .1 0 € 2 4 2 .5 2 € -8 .7 6 2040 24 0 .9 4 6 5 4 0 .0 5 3 4 6 0 .0 7 9 0 1 0 .0 2 7 1 3 1 5 .5 3 -€ 7 0 .4 1 -€ 4 5 .8 2 -€ 74% 1 0 ,1 0 3 .7 9 € 6 0 6 .2 3 € 8 5 9 .3 9 € 1 ,1 1 1 .4 2 € 2 ,3 9 9 .6 5 € 4 ,8 5 1 .9 6 € 2 1 2 4 .9 5 1 6 2 6 2 3 ,5 6 9 .8 2 -€ 2 6 ,8 7 9 .4 0 -€ 4 ,9 7 6 .6 8 € 4 1 6 .7 0 € -8 .1 2 2041 25 0 .9 4 0 3 7 0 .0 5 9 6 3 0 .0 8 8 2 0 .0 2 9 9 5 1 3 .5 1 -€ 7 3 .2 0 -€ 4 5 .8 2 -€ 85% 1 0 ,3 0 5 .8 7 € 7 7 2 .9 4 € 8 5 1 .8 6 € 1 ,1 3 3 .6 5 € 2 ,4 4 7 .6 4 € 5 ,0 8 1 .4 6 € 2 1 5 0 .2 0 3 2 4 1 2 1 ,4 1 9 .6 2 -€ 2 4 ,7 2 9 .1 9 -€ 5 ,2 0 6 .0 9 € 5 9 8 .9 2 € -7 .4 7 To ta ls P ro b a b il it y o f b e in g a li v e H ea lt h Ed u ca ti o n W o rk O th er fa ct o rs C o n tr ib u ti v e t a x Tabl e 2 – Sc enar io s descrip tio n and re sul ts, co m p ari n g t o v alu es fo r av erag e in d iv id u al. Tabl e 1 – M ain e xce l sprea d sheet with m ain c ate go ri es: health, e d u cati o n and w o rk. N P V B re a k -e v e n a g e N P V B re a k -e v e n a g e Ba se 3 .5 % € 3 ,3 0 9 .5 8 66 7 5 % o f a ve ra ge w ag e 1% N ev er Fu ll ed u ca ti o n , al w ay s p u b lic 82 8 0 ,4 3 7 .8 3 € € 2 3 ,7 3 4 .5 4 36 € 2 0 ,4 2 4 .9 6 38 6 .1 7 1 1% € 2 4 4 ,2 9 6 .2 4 € 3 2 ,7 8 4 .4 5 31 € 2 9 ,4 7 4 .8 7 32 8 .9 1 2 7% € 2 1 ,0 3 2 .3 8 -€ 3 ,6 1 5 .4 7 --€ 6 ,9 2 5 .0 4 --2 .0 9 3 € 2 ,2 8 7 .1 2 € 8 0 ,4 3 7 .8 3 € 2 3 ,7 3 4 .5 4 36 € 2 1 ,4 4 7 .4 2 38 9 .3 8 4 € 1 9 ,4 1 1 .0 4 € 8 0 ,4 3 7 .8 3 € 2 3 ,7 3 4 .5 4 36 € 4 ,3 2 3 .5 0 47 0 .2 2 5 60 € 7 0 ,6 3 1 .3 2 € 7 ,4 1 5 .9 6 36 € 4 ,1 0 6 .3 9 38 1 .2 4 6 70 € 8 0 ,6 4 2 .9 0 € 2 2 ,4 4 9 .0 1 36 € 1 9 ,1 3 9 .4 4 38 5 .7 8 7 M in im u m w ag e € 5 6 ,2 6 2 .3 8 € 3 ,8 2 5 .7 5 44 € 5 1 6 .1 7 46 0 .1 6 8 1 .5 x av er ag e w ag e € 1 8 9 ,8 1 8 .0 7 € 1 1 5 ,4 7 6 .1 7 28 € 1 1 2 ,1 6 6 .6 0 28 3 3 .8 9 9 0% € 5 0 ,2 4 3 .9 7 € 6 8 3 .7 4 40 -€ 2 ,6 2 5 .8 4 43 -0 .7 9 10 4 .5 % + 0 % € 1 1 5 ,7 9 9 .0 6 € 5 2 ,3 9 4 .3 9 34 € 4 9 ,0 8 4 .8 1 35 1 4 .8 3 11 W / em p lo ym en t ra te s o f 2 0 1 6 € 7 7 ,2 7 3 .0 0 € 2 2 ,4 2 7 .4 3 37 € 1 9 ,1 1 7 .8 5 39 5 .7 8 12 O n ce e ve ry 5 y ea rs € 6 9 ,3 9 7 .7 7 € 1 ,0 9 3 .5 4 43 -€ 2 ,2 1 6 .0 4 46 -0 .6 7 13 Ba si c sc h o o l, al w ay s p u b lic € 8 6 ,7 1 4 .1 4 € 3 5 ,2 7 3 .0 7 31 € 3 1 ,9 6 3 .4 9 33 9 .6 6 14 N o e d u ca ti o n co st s fo r st at e € 8 0 ,4 3 7 .8 3 € 4 8 ,9 3 5 .9 0 24 € 4 5 ,6 2 6 .3 2 25 1 3 .7 9 15 66 € 7 8 ,7 1 7 .3 0 € 4 9 ,1 5 9 .9 9 36 € 4 5 ,8 5 0 .4 1 38 1 3 .8 5 16 90 € 8 3 ,8 2 1 .3 8 -€ 6 1 .5 0 36 -€ 3 ,3 7 1 .0 8 38 -1 .0 2 R a te o f re tu rn N o rma ll y-co n ce iv e d A R T-co n ce iv e d S ce n a ri o D is co u n t fa ct o r A R T p ri ce R e ti re m e n t a g e In it ia l w a g e W a g e g ro w th U n e m p lo y m e n t E d u ca ti o n Li fe e xp e ct a n cy R e v e n u e s