UNIVERSIDADE DE LISBOA
FACULDADE DE CIÊNCIAS
DEPARTAMENTO DE BIOLOGIA ANIMAL
Dissertação
Mestrado em Biologia Evolutiva e do Desenvolvimento
2013
Analysis of the molecular interactions between
Msx1 and other key players during mouse limb
development
1
Dissertação
Mestrado em Biologia Evolutiva e do Desenvolvimento
2013
UNIVERSIDADE DE LISBOA
FACULDADE DE CIÊNCIAS
DEPARTAMENTO DE BIOLOGIA ANIMAL
Analysis of the molecular interactions between
Msx1 and other key players during mouse limb
development
Joana Cristina Reino Carvalho
Dissertação orientada por: Doutor Benoît Robert
3
Acknowledgements
First I would like to thank to all the people in the lab, especially Benoît my supervisor for his encouragement and suggestions and Mathura, whom I closely work with for helping me with pretty much everything inside and outside the bench throughout my internship.
To professor Sólveig, who accepted to be my internal supervisor and was always present and willing to offer her help whenever I had a doubt or problem.
Then I would like to thank to all my friends in Paris that made my life brighter and more enjoyable while I was in this new foreign country taken aback from my comfort zone and made me feel at home again. Thank you very much Fernando, Mathura, Jeremy and all the others that, one way or another, made me smile!
And finally a special thanks to all my family for their unconditional support throughout this whole journey. Without you, I wouldn’t have made it this far. I love you all very much!
4
Abstract
In vertebrates, the anteroposterior (AP) growth and patterning of the limb bud rely on an intricate regulatory genetic network involving Shh and Gli3. Although the mechanism allowing Shh to modulate Gli3 activity is well documented, the role of Msx genes, which constitute a small family of genes encoding homeodomain transcription factors that have been implicated in AP limb patterning, within this genetic network remains poorly understood. Based on empirical evidence generated by previous studies, we hypothesized that Msx genes may interact with the transcription factor Gli3, particularly, with its repressor form, Gli3R in order to drive limb morphogenesis. To test this hypothesis, we performed a series of protein interaction assays using the Proximity Ligation Assay (PLA) technique followed by quantification analysis. Using this technique we were able to produce evidence supporting our initial assumption admitting the in vivo interaction between the transcription factors Msx1 and Gli3R in the forelimb and hindlimb bud at 11.5 dpc. In parallel, we also investigated the involvement of these transcription factors in the BMP signaling pathway, by testing their ability to interact with the PSmad1,5,8 protein complex, the intracellular transducer of the BMP signaling cascade. Using the same experimental approach, we were able to demonstrate that both Msx1 and Gli3R interact with this protein complex in mesenchymal cells of the forelimb at 11.5 dpc. Based on these results and on the fact that the BMP signaling pathway has been systematically implicated in the apoptotic events taking place in the limb, together with the observation that the absence of Msx genes and/or Gli3 result in phenotypes concomitant with apoptosis impairment, we propose that Msx1, Gli3R and the Psmad1,5,8 proteins interact with each other in order to form a trimeric nuclear transcriptional complex that will drive the expression of BMP target genes involved in cell death regulation.
5
Resumo
Nos vertebrados, o crescimento e padronização anterior-posterior (AP) do botão do membro é regulado através de uma rede genética altamente complexa, cujos principais intervenientes incluem o fator parácrino Sonic hedgehog (Shh) e o fator de transcrição Gli3. A nível molecular, o principal papel do fator parácrino Shh durante o desenvolvimento do membro é contrabalançar a atividade do fator de transcrição Gli3, impedindo a formação de Gli3R, a forma truncada da proteína Gli3 que atua como um potente repressor transcricional que se acumula principalmente nas células da região anterior do botão do membro que não expressam Shh (Wang et al., 2000). Estas interações genéticas resultam na pré-padronização do botão do membro, definindo claramente duas regiões distintas: a região anterior, onde as células expressam altos níveis de Gli3R e baixos de Gli3A, e a região posterior que, uma vez que se encontra na proximidade da Zona de Atividade Polarizante (ZPA), o local de síntese do fator Shh, possui contrariamente à região anterior elevados níveis de Gli3A e baixos de Gli3R (Wang et al., 2000; Zeller et al., 2009).
Apesar do mecanismo envolvido na regulação da atividade do fator Gli3 através da sinalização Shh estar bem documentado na literatura, o papel dos genes Msx, que constituem uma pequena família de fatores de transcrição envolvidos na morfogénese e padronização AP do botão do membro, no âmbito desta rede genética ainda não é bem conhecido. Diversos estudos têm sugerido que os genes Msx desempenham um papel fundamental na morfogénese do membro, interagindo com o fator de transcrição Gli3, mais especificamente com a sua forma repressora Gli3R. A prova mais direta que aponta para a existência de uma interação entre estes dois genes foi obtida no laboratório a partir de uma experiência de co-imunoprecipitação (Co-IP) realizada num sistema in vitro constituído por células HEK293 que foram co-transfectadas com cDNAs codificantes dos alelos Msx1 e Gli3R marcados com sequências C-myc e Flag, respetivamente. Os resultados obtidos posteriormente por Western Blot revelaram que era possível precipitar ambas as proteínas GLI3R e MSX1 utilizando anticorpos direcionados contra as sequências C-myc e Flag dos alelos Msx1 e Gli3R respetivamente, indicando que estas proteínas têm capacidade de interagir uma com a outra nas condições experimentais estabelecidas neste sistema artificial (O. Goupille and B. Robert, unpublished data). Contudo, é importante salientar que neste sistema
6
artificial o nível de expressão destas proteínas não é controlado e pode, portanto, não corresponder aos níveis endógenos a que as células do botão do membro estão sujeitas
in vivo. Assim, de modo a contornar este problema, é necessário estabelecer um sistema
adequado que permita o estudo in vivo destas interações genéticas que ocorrem durante o desenvolvimento do membro embrionário, que constitui, no fundo, o principal objetivo do trabalho aqui apresentado.
Com a finalidade de investigar a relação entre os fatores de transcrição Msx1 e Gli3R in
vivo utilizando o botão do membro como modelo experimental, começámos por gerar
uma série de estirpes animais transgénicas, contendo construções genéticas que nos permitiriam detetar a existência de interações entre estes fatores de transcrição in vivo. Após o cruzamento destas linhagens transgénicas, gerámos embriões com 11 dias pós-coito heterozigóticos para Prx1Cre/0; Msx1HA-His/+; RosaGli3R-Flag/+; Gli3Flox/+ nos quais realizámos uma série de experiências de interações entre proteínas, incluindo Co-IP e a técnica de Proximity Ligation Assay (PLA) seguida de uma análise estatística quantitativa. Através desta última foi possível demonstrar que os fatores de transcrição Msx1 e Gli3R interagem in vivo tanto nas células mesenquimais do membro anterior como do membro posterior aos 11 dias pós-coito.
Por outro lado, outros estudos focados no papel dos genes Msx e de componentes da cascata de sinalização BMP na formação do palato têm vindo a sugerir que estes genes interagem com elementos desta via de sinalização, que não o recetor Bmpr1A, de modo a promover a formação do palato (Liu et al., 2005; Zhang et al., 2002). Paralelamente, em 1998 Liu et al. demonstraram que num sistema in vitro constituído por células COS1 transfectadas com isoformas full-length ou truncadas da proteína Gli3, apenas as proteínas truncadas na sua extremidade carboxílica (estruturalmente semelhantes ao repressor transcricional Gli3R) tinham capacidade de se associar a proteínas Smad endógenas através do seu domínio zinc-finger, levantando assim a possibilidade de que as proteínas Gli poderão também interagir in vivo com esta mesma cascata de sinalização através das proteínas Smad. Com base nestes resultados, decidimos também investigar em mais detalhe o envolvimento destes fatores de transcrição na via de sinalização BMP, testando a sua capacidade de interagir com o complexo proteico PSmad1,5,8, o transdutor de sinal intracelular responsável pela regulação da transcrição de genes-alvo desta via de sinalização. Tirando partido da mesma abordagem experimental, conseguimos demonstrar que ambos os fatores de transcrição Msx1 e
7
Gli3R interagem com este complexo proteico nas células mesenquimais do membro anterior aos 11 dias pós-coito.
Após termos verificado que os fatores de transcrição Msx1 e Gli3R interagem um com o outro e que ambos estão envolvidos na cascata de sinalização BMP interagindo com o complexo proteico PSmad1,5,8, estávamos interessados em investigar os processos biológicos que têm lugar no botão do membro que poderiam ser controlados por estes complexos proteicos. Uma vez que já tinha sido demonstrado que mutantes Gli3-/- e
Msx1-/-; Msx2-/+ apresentam malformações nos membros provocadas pela não ocorrência de apoptose (Aoto et al., 2002; Lallemand et al., 2009), colocámos imediatamente a hipótese de que o fator de transcrição Msx1, juntamente com Gli3R e com o complexo proteico PSmad1,5,8 poderiam estar envolvidos no controlo da apoptose que tem lugar no botão do membro durante o desenvolvimento embrionário. De forma a investigar esta possibilidade e a confirmar que de facto os genes Msx estão envolvidos neste processo, realizámos uma série de experiências de imunofluorescência contra Caspase3 utilizando embriões Msx1-/-; Msx2-/- com o objetivo de avaliar o padrão de distribuição e intensidade da apoptose presente no botão do membro. Os resultados obtidos indicaram claramente que na ausência de Msx1 e Msx2, há uma diminuição drástica na morte celular programada na região anterior do botão do membro, confirmando assim que de facto estes genes são indispensáveis para a ocorrência de apoptose e, em última instância, para a morfogénese e padronização do botão do membro.
Tendo como base estes resultados, juntamente com o facto da via de sinalização BMP ter sido sistematicamente apontada como estando implicada na regulação da apoptose que tem lugar nas células mesenquimais do botão do membro de mamíferos e aves (Guha et al., 2002; Yokouchi et al., 1996; Zou and Niswander, 1996), acrescido ao facto de se ter demonstrado que a ausência de genes Msx e/ou Gli3 resulta no aparecimento de anomalias provocadas pela diminuição e/ou ausência de morte celular programada no botão do membro (Aoto et al., 2002; Lallemand et al., 2009), propomos um modelo em que os fatores de transcrição Msx1 e Gli3R interagem com o complexo proteico PSmad1,5,8 de modo a formar um trímero nuclear transcricional responsável pela indução de genes-alvo da cascata de sinalização BMP diretamente envolvidos no controlo da apoptose. Apesar de ter sido possível demonstrar através da PLA que existem interações entre estas três proteínas no botão do membro in vivo, muitos aspetos
8
relacionados com a sua natureza celular e molecular ficaram ainda por esclarecer. Assim, no futuro é necessário investigar estas interações proteicas em mais detalhe por forma a esclarecer, em primeiro lugar, qual é o papel desempenhado pelo fator de transcrição Msx1 na apoptose mediada através da cascata de sinalização BMP. Em segundo lugar, descobrir quais os domínios e motivos proteicos que permitem a estas proteínas interagirem fisicamente umas com as outras. Em terceiro lugar, tentar perceber de que forma é que estas interações proteicas regulam a expressão de genes-alvo da via de sinalização BMP e quais são as consequências que isso acarreta em termos da morfogénese e padronização do membro. E, finalmente, investigar em mais detalhe de que modo é que a apoptose mediada através da cascata de sinalização BMP é regulada temporal e espacialmente e quais serão os outros fatores de transcrição e/ou cofatores envolvidos nesse processo.
Palavras-chave: Padronização anterior-posterior | Genes Msx | Gli3 | Desenvolvimento
9
Table of Contents
Acknowledgements ... 3 Abstract ... 4 Resumo ... 5 I. Introduction ... 10I.1. Vertebrate limb development ... 10
I.2. Anteroposterior growth and patterning of the limb bud ... 12
I.3. The Shh/Gli3/Msx regulatory genetic network ... 14
I.4. The involvement of Msx1 and Gli3R in the BMP signaling pathway ... 17
II. Objectives ... 19
III. Materials and Methods ... 20
III.1. Mouse strains and genotyping ... 20
III.2. LacZ staining ... 22
III.3. Alcian Blue cartilage staining ... 22
III.4. Alizarin Red skeletal staining ... 22
III.5. Limb bud protein extraction... 23
III.6. Co-Immunoprecipitation (Co-IP) and Western Blotting ... 23
III.7. Proximity Ligation Assay (PLA) ... 23
III.8. Immunofluorescence ... 25
III.9. Statistical analysis ... 27
IV. Results ... 28
IV.1. Overexpression of Gli3R driven by Prx1-Cre causes limb defects ... 28
IV.2. Gli3R and MSX1 interact in vivo at E11.5 in the limb bud ... 29
IV.3. Gli3R and Msx1 interact with the BMP pathway through Smads... 31
IV.4. Apoptosis is deregulated in the limb bud of Msx1-/-; Msx2-/- ... 33
V. Discussion ... 35
V.1. The relationship between Msx1, Gli3R and the BMP cascade ... 35
V.2. Concluding remarks ... 39
References ... 40
Appendix I – Supplementary data ... 44
Appendix II – Solutions and buffers ... 45
10
I. Introduction
The study of the complex processes and signaling networks underlying the development of an adult organism from the initial relative simplicity of a zygote could be defined as the main goal of Developmental Biology.
During development, the formation of a new organism results from the coordinated combination of multiple processes including growth, morphogenesis and cellular differentiation through a temporal and spatial regulation of gene expression and cell behaviour. However, the processes by which an undifferentiated field of cells acquire spatial pattern and undergo coordinated differentiation are not fully understood (Berge
et al., 2008; Ros and Fernandez-Teran, 2008).
The limb has long been a pioneering model system for examining the molecular mechanisms of tissue patterning and morphogenesis during development. The first genetic studies performed since the 1940s, focused mainly on elucidating the functions of a particular gene or pathway during limb bud development, but the challenge now is to understand how the genes and pathways interact to orchestrate limb organogenesis (Zeller et al., 2009).
I.1. Vertebrate limb development
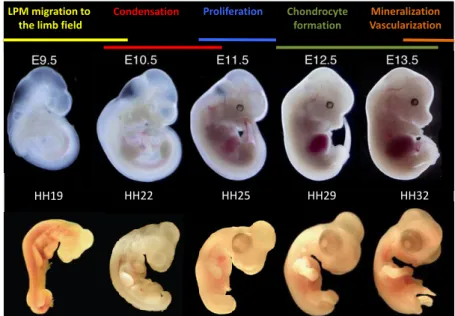
In vertebrates, the developing limb emerges from the flank mesenchyme at predetermined positions along the embryonic axis. Around 9.5 dpc (days post coitum) in the mouse and 19HH in the chick, the forelimb buds arise from the embryo trunk at the level of the heart. In the mouse, about half a day later, the hindlimb buds begin to protrude near the posterior end of the embryo at the level of the kidneys (Taher et al., 2011; Zeller et al., 2009). At this stage each limb bud is composed of a meshwork of apparently homogeneous undifferentiated and highly proliferative mesenchymal cells derived from the lateral plate mesoderm (LPM) covered by the surface ectoderm, that colonize the limb field around E9.5 (HH19) up to E10.5 (HH22) (Taher et al., 2011). The mesoderm contains the progenitors of skeletal elements, tendons and other connective tissues that will be present in the fully-formed limb, whereas the surface ectoderm gives rise to the skin and other cutaneous structures such as feathers on birds or hairs on mammals. Shortly after the limb buds emerge, changes in cell shape and
11
position within the surface ectoderm result in the appearance of a ridge around E10.5 (HH22), the apical ectodermal ridge (AER), which runs along the distal margin of each limb bud (Taher et al., 2011; Towers and Tickle, 2009). This thickened specialized epithelium is required for limb bud outgrowth, as it produces signals that promote proximo-distal elongation. As the bud elongates, the cells near the body wall begin to differentiate, while the cells at the bud tip will remain undifferentiated. In the meantime, these mesenchymal cells start to form small compact aggregates called precartilage condensations that will prefigure the limb skeletal elements found in the adult. From E11.5 (HH25) up to E13.5 (HH32), the cartilage differentiates from the condensations, giving rise to the skeletal primordial. By E12.5 (HH29) the digits start to appear and from E13.5 onward, the cartilaginous skeleton starts to mineralize and is slowly replaced by bone tissue. Simultaneously, the limbs become vascularized, as they are invaded by blood vessels that will ensure a constant blood flow to maintain tissue viability during limb outgrowth (Hall and Miyake, 2000; Towers and Tickle, 2009) (Fig.1).
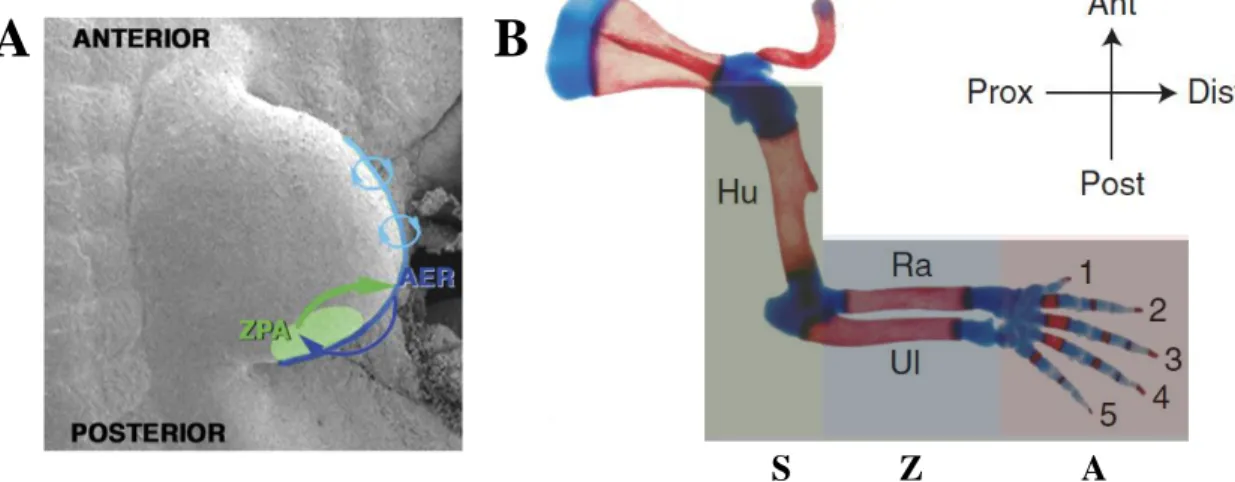
Immediately after the AER has formed, a second limb organizer emerges in the posterior region of the limb bud, the zone of polarizing activity (ZPA). It is the interplay between the AER, ZPA, ectoderm and the underlying mesenchyme that control the elongation along the proximo-distal (PD) axis
(shoulder to fingers), the flattening along the dorso-ventral (DV) axis (back of hand to palm), the number, and the identity of digits along the antero-posterior (AP) axis (thumb to little finger) (Taher et al., 2011) (Fig.2A). It takes seven days after the wing buds first
HH19 HH22 HH25 HH29 HH32
LPM migration to the limb field
Condensation Proliferation Chondrocyte formation
Mineralization Vascularization
Figure 1 Vertebrate limb development. Overview of the main events taking place during vertebrate limb development as a function of developmental stage and model organism (mouse on the top panel and chick on the bottom panel). E, time in days following fertilization; HH, Hamburger and Hamilton developmental stages .
12
appear (and about five days in the mouse forelimb) for the complete skeleton to form, with the stylopod (humerus) forming first, followed by the intermediate segments composing the zeugopod (radius and ulna) and the distal autopod elements (wrist and digits) forming last (Towers and Tickle, 2009; Bénazet and Zeller, 2009) (Fig.2B).
I.2. Anteroposterior growth and patterning of the limb bud
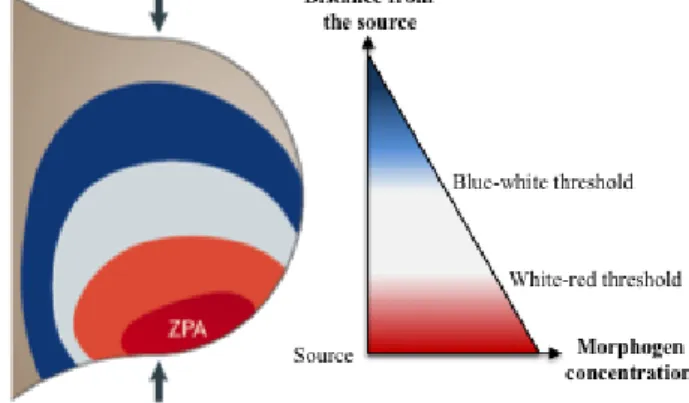
In vertebrates, the antero-posterior (AP) growth and patterning of the limb bud is coordinated by a small posterior mesenchymal region called the zone of polarizing activity (ZPA), which is considered the posterior organizer of the limb bud due to its potential to instruct cells with respect to their AP fates (Robert and Lallemand, 2006; Zeller et al., 2009). Grafting experiments in chick have shown that anterior ectopic grafts of ZPA cells are able to induce mirror-image digit duplications along the AP axis, which at first sight, can apparently be explained by the French-flag model formulated by Wolpert in 1969 (Wolpert, 1969) (Fig.3). This model postulated that ZPA cells produce a morphogen signal whose diffusion establishes a spatial gradient across the limb bud,
Figure 2 Limb bud organization throughout development. (A) The limb bud organizers. Scanning electron micrograph of a mouse limb bud showing the zone of polarizing activity (ZPA, in green) located in the posterior limb bud mesenchyme and the apical ectodermal ridge (AER, in blue). These two signaling centers communicate by reciprocal signaling interactions (arrows). (B) Skeletal preparation of mouse forelimb stained with alcian blue and alizarin red at birth. The stylopod (S, in green) gives rise to the most proximal limb skeletal elemento, the humerous (Hu). The zeugopod (Z, in blue) forms the radius (Ra) and the ulna (Ul). The distal autopod (A, in red) forms the wrist bones, the palm bones and the digits. Red and blue histological stains mark ossified bone and cartilage, respectively. The antero-posterior and the proximo-distal axis are depicted above.
Adapted from Bénazet and Zeller, 2009 and Zeller and Zuniga, 2007
S Z A
B
A
13
with its highest concentration in the posterior mesenchymal region corresponding to the ZPA. In response, mesenchymal cell fates were specified according to three distinct threshold values of the morphogen (depicted in the model by the three colors of the French flag), depending on their
distance from the source (Zeller, 2004; Zeller et al., 2009). After twenty years of intensive searching for the long-lost Wolpert's morphogen, a small diffusible protein called Sonic Hedgehog (SHH) was identified as the morphogen signal produced by the ZPA (Riddle et
al., 1993). After being secreted by the ZPA, the SHH protein diffuses across the limb bud to elicit responses at a distance in
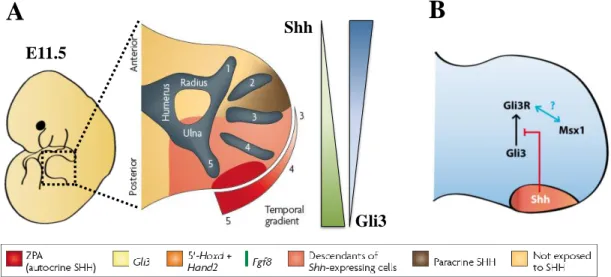
the mesenchyme, as suggested by grafting experiments showing that Shh-expressing fibroblasts are able to induce mirror-image digit duplications when placed anteriorly in the limb bud mesenchyme (Lewis et al., 2001). Furthermore, genetic experiments have revealed that the lack of Shh during limb bud morphogenesis resulted in the loss of posterior limb structures, including the ulna and digits 5 to 2, thus proving the absolute requirement of Shh signaling for the AP growth and patterning of the vertebrate limb (Chiang et al., 2001; Kraus et al., 2001). Although most studies converge on the existence of a spatial morphogen gradient, none has analyzed the kinetics of SHH gradient formation and the postulated threshold responses, nor the direct contribution of ZPA cells to digit primordia. To address these issues, a series of experiments were devised in order to label all Shh-expressing cells and follow their descendants throughout time during limb development (Ahn and Joyner, 2004; Harfe et al., 2004). These cell lineage tracing experiments revealed that Shh descendant cell populations give rise to posterior digits (from digit 5 to 3), whereas digit 2 is the only skeletal element whose specification is entirely dependent on long-range SHH signaling (Fig.4A). These results challenged the relevance of the spatial morphogen gradient
Figure 3 The French-flag model proposed by Wolpert. The ZPA in the posterior limb bud mesenchyme is indicated in red and corresponds to the highest point of the SHH morphogenetic gradient established across the entire limb bud. The identities of the limb bud mesenchymal cells are specified by threshold levels of the morphogen, depicted in the model by the three colors of the French flag.
14
E11.5
Shh
Gli3
A
B
proposed earlier by Lewis Wolpert and, together with other studies, contributed to the establishment of a new model postulating that mesenchymal cells are able to acquire a kinetic memory of the SHH signal they have received and subsequently respond according to the exposure time length (i.e. the posterior cells exposed to SHH the longest are fated to become digit 5, whereas anterior cells never exposed to SHH are fated to become digit 1) (Zeller, 2004).
I.3. The Shh/Gli3/Msx regulatory genetic network
At the molecular level, the main role of Shh during limb development is to counteract the activity of the transcription factor Gli3 by preventing the formation of Gli3R, a truncated form of the Gli3 protein that acts as a transcriptional repressor (Wang et al., 2000). To fulfill its function, Shh signaling acts at two distinct levels: first it represses
Gli3 transcription in a dose-dependent manner, such that Gli3 mRNA is transcribed
according to a gradient opposite to Shh which increases from the anterior to the posterior region of the limb bud (Fig.4).
Figure 4 The Shh/Gli3/Msx regulatory genetic network controls the antero-posterior pre-patterning of the limb bud. (A) Specification of anteroposterior identities by a spatial and temporal gradient of Shh and Gli3. Descendants from Shh-expressing cells give rise to digits 4 and 5, and contribute to digit 3. Cells that give rise to digit 2 and parts of digit 3 are specified by long-range SHH signaling. The digit 1 is specified in a SHH-independent manner. The transcriptional repression of Gli3 by Shh signaling is responsible for the establishment of a Gli3 gradient from posterior to anterior. (B) The involvement of Msx within the Shh/Gli3 genetic network. A set of evidences suggest that the transcription factor Msx1 may be involved in this genetic network by interacting with Gli3R, the repressor form of the transcription factor Gli3. Adapted from Zeller et al., 2009
15
Second, it is required to prevent the processing of Gli3 into its repressor form, Gli3R, which accumulates primarily in cells that do not express Shh. These genetic interactions result in the pre-patterning of the nascent limb bud, defining two clearly distinct regions: the anterior limb bud containing high levels of Gli3R and low Gli3A levels, and the converse in the posterior region close to the Shh signaling domain (Wang et al., 2000; Zeller et al., 2009). Nevertheless, while the mechanism allowing Shh to modulate Gli3 activity is well documented, the role of other genes important for AP patterning within this regulatory genetic network remains poorly understood. Due to their involvement in AP limb patterning, Msx genes, which constitute a small family of genes encoding homeodomain transcription factors, are considered good candidates for interacting within this genetic loop (Lallemand et al., 2009; Bensoussan et al., 2011). In the mouse, the Msx family comprises three members, two of which, Msx1 and Msx2, were proposed to play a role in limb development as both are expressed from the onset of limb bud outgrowth in the ectoderm and mesoderm as well (Davidson et al., 1991; Robert et al., 1991) (Fig.5 and Fig.S.1). Due to the high level of functional redundancy between these two genes, neither Msx1 nor Msx2 null mutants display limb abnormalities. However, Msx1-/-; Msx2-/- double homozygous mutants exhibit several malformations along the AP axis, including the loss of anterior autopod and zeugopod structures and, later on, the abnormal overgrowth of the remaining anterior part of the autopod mesenchyme (Lallemand et al., 2005).
Several lines of evidence suggest that Msx genes may play a crucial role in limb morphogenesis by interacting with the transcription factor Gli3, and in particular with its repressor form, Gli3R (Fig.4B). First, Lallemand and
co-workers have demonstrated that at E11.5 there is an overlapping expression domain of Msx1 and Gli3, corresponding to the most anterior region of the limb bud (presumptive
Figure 5 Expression pattern of Msx1 and Msx2 visualized in whole- mount at E11.5, using the lacZ reporter. Both Msx1 (left panel) and Msx2 (right panel) are highly expressed in the distal region of the limb bud, in the central nervous system and in the olfactory bulb. The forelimb (FL) and hindlimb (HL) of each embryo are shown beside each panel.
16
territory of digit 1), where both genes are expressed at a high level. This spatial and temporal co-localization suggested that these two transcription factors might share similar functions during limb bud development, which was supported by results showing that in the absence of Msx genes and/or Gli3, the limb bud anterior apoptotic domain normally observed at E11.5 was absent, suggesting that both genes are required for apoptosis of anterior tissues in the limb at this specific time point (Aoto et al., 2002; Lallemand et al., 2009). Furthermore, in Msx and Gli3 mutants, anterior and posterior identity markers have their expression similarly affected, i.e., the anteriorly restricted Pax9 is downregulated in Gli3-/- and Msx1-/-; Msx2+/-, whereas the posterior marker Hand2 expands anteriorly in both cases (Y. Lallemand and B. Robert, unpublished data; Bowers et al., 2012). In an effort to address the role of Msx genes within the Shh/Gli3 regulatory genetic network and investigate possible epistatic interactions, Lallemand et
al. have created a series of Shh and Msx compound mutants and analyzed their
phenotypes. In a Shh-/- null mutant backgroundwhere Gli3R is overproduced, all digits but digit one are lost because of extensive apoptosis of the mesenchyme (te Welscher et
al. 2002). In this genetic context, limb skeletal analyses have demonstrated that when
Msx genes are also mutated, digit formation was partially restored because apoptosis is prevented in the domain where Msx are normally expressed. Interestingly, te Welscher
et al. (2002) and Litingtung Litingtung et al. (2002) had previously shown that a similar
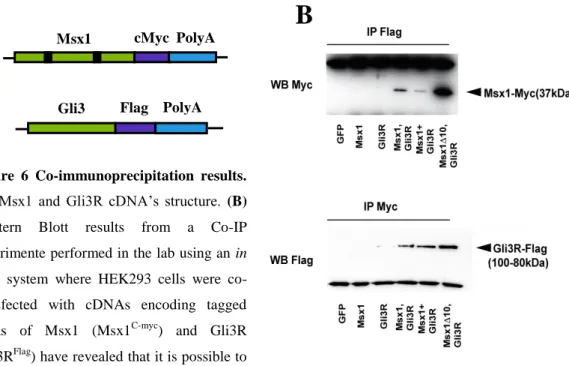
phenotype rescue is observed when functional Gli3 alleles are removed in a Shh-/- null mutant background. Taken together, these results demonstrate that both Msx1 and Gli3 are epistatic over Shh and suggest, once again, that both transcription factors play identical roles during limb development and might, possibly, interact with each other. Finally, the most direct evidence pointing to an interaction between these two genes was provided by a Co-IP experiment performed in the lab using an in vitro system where HEK293 cells were co-transfected with cDNAs encoding tagged forms of Msx1 (Msx1C-myc) and Gli3R (Gli3RFlag). The Western Blot results have revealed that it was possible to cross-precipitate both GLI3R and MSX1 proteins using antibodies raised against the C-myc and the Flag tag of Msx1 and Gli3R, respectively, indicating that these two proteins are able to interact with each other under these experimental conditions (O. Goupille and B. Robert, unpublished data) (Fig.6). However, it is important to highlight the fact that the expression level of these proteins is not controlled in these experiments and thus might not reflect what happens in vivo in the
17
limb bud. In order to solve this issue, it is imperative to establish a proper in vivo system that allows the study of genetic interactions taking place during limb bud development, which is the main goal of the present work.
I.4. The involvement of Msx1 and Gli3R in the BMP signaling pathway
Previous studies addressing palate formation in the mouse have demonstrated that embryos lacking Bmpr1A or Msx1 developed a cleft palate, a craniofacial malformation where the two palatal shelves are not completely joined to form the hard palate (Liu etal., 2005; Zhang et al., 2002). Surprisingly, transgenic mice harboring the human Bmp4 gene driven specifically in the craniofacial region by the mouse Msx1 promoter on an
Msx1-/- null mutant background displayed palatal closure, suggesting that Msx genes are interacting with the BMP signaling pathway in order to drive palate formation (Zhang et
al., 2002). Nevertheless, other studies have demonstrated that the phosphorylation of the Bmp receptor following ligand binding is not compromised in Msx1; Msx2 deficient mice, indicating that Msx1 is acting at a different level in the BMP signaling cascade (Liu et al., 2005; Ovchinnikov et al., 2006). Interestingly, the finding that Gli2 and Gli3 are expressed in close proximity to many sites of active BMP signaling (Lee et al., 1997), together with the observation that many Human syndromes arising from
Figure 6 Co-immunoprecipitation results. (A) Msx1 and Gli3R cDNA’s structure. (B) Western Blott results from a Co-IP experimente performed in the lab using an in
vitro system where HEK293 cells were
co-transfected with cDNAs encoding tagged forms of Msx1 (Msx1C-myc) and Gli3R (Gli3RFlag) have revealed that it is possible to cross-precipitate both MSX1 and GLI3R proteins using antibodies against the Flag and the C-myc tag of Gli3R and Msx1, respectively (top and bottom panel, respectively).
Msx1 cMyc PolyA
Gli3 R
Flag PolyA
cross-precipitate both MSX1 and GLI3R proteins using antibodies against the Flag and the C-myc tag of Gli3R and Msx1, respectively (top and bottom panel, respectively).
Courtesy of Benoît Robert, Dr.
18
mutations that produce truncated Gli3 proteins result in defects reminiscent of those caused by BMP signaling impairment (Kang et al., 1997), raised the possibility that these Gli proteins may also interact with the BMP cascade and that this might occur via the Smad proteins, which constitute the intracellular transducers of the TGFβ family members, including BMP’s. In the BMP signaling cascade, the Smad1,5,8 protein complex becomes phosphorylated following ligand binding to their receptor. These, after associating with Smad4, translocate into the nucleus where they will bind to specific DNA domains and promote the transcription of BMP target genes, thus constituting the active transcription factors in the BMP pathway (Kimelman, 2006). By taking advantage of an in vitro system where COS1 cells were transfected either with full-length or truncated forms of Gli3, Liu et al. (1998) were able to demonstrate that only carboxy-terminally truncated Gli3 proteins (structurally similar to the Gli3R transcriptional repressor) were able to associate with endogenous Smads through their zinc finger domain. Taken together these results prompted us to investigate, in a more detailed manner, the involvement of Msx1 and Gli3R in the BMP signaling pathway, by testing whether these proteins are able to bind and interact with the PSmad1,5,8 protein complex, thus modulating its transcriptional activity over BMP target genes.
19
II. Objectives
Although a significant amount of indirect evidences point to the existence of genetic interactions between the transcription factors Msx1 and Gli3R, it remains to be demonstrated whether direct interactions between these corresponding proteins can be demonstrated at the in vivo level. Thus, the main goal of this project is to establish a proper in vivo system that allows the study of endogenous protein interactions taking place during mouse limb bud development. To this end, we aim to:
1. Raise transgenic mice lines harboring constructs that will allow for the in vivo
detection of Msx1 and Gli3R and test their efficiency;
2. Untangle the relationship between Msx1 and Gli3R using the mouse limb bud at
11.5 dpc as a model system;
3. Investigate the involvement of Msx1 and Gli3R in the BMP signaling cascade
20
III. Materials and Methods
III.1. Mouse strains and genotyping
In order to study the potential endogenous interactions between Msx1 and Gli3R we have used a transgenic mouse line harboring a Cre-inducible Gli3 repressor containing a flag sequence inserted into the Rosa26 locus (Vokes et al., 2008), together with a floxed Gli3 allele (Blaess et al., 2008) and a non-inducible tagged form of the Msx1 gene (N. Duval and B. Robert, unpublished data) (Fig.7). By crossing homozygous males belonging to the murine line carrying these transgenes with homozygous females harboring the Cre recombinase driven by the Prx1 limb enhancer (Logan et al., 2002), it was possible to generate heterozygous
embryos for Prx1Cre/0; Msx1HA-His/+; RosaGli3R-Flag/+; Gli3Flox/+ where Gli3R-Flag was specifically expressed in the early forelimb bud mesenchyme from 9.5 dpc and only one of the Gli3 endogenous alleles was functional. This is to significantly decrease the formation of endogenous non-flagged Gli3R that would compete with the flagged form in interaction assays. Although the use of the Prx1-Cre line proved out to be extremely useful, we also encountered a potential complicating aspect regarding the penetrance of the
transgene when transmitted maternally. According to Logan et al. (2002), in this case germline recombination might occur in the offspring, resulting in the expression of Cre outside the limb field from the very first stages of development. The penetrance of this germline recombination event relied also on the particular strain and gene that ought to be defloxed. This potential loss of tissue and stage specificity raised a problem and prompted us to analyze the Cre recombinase activity in E11.5 embryos using the
Figure 7 Mating strategy adopted to generate heterozygous embryos for Prx1Cre/0; Msx1HA-His/+; RosaGli3R-Flag/+; Gli3Flox/+. The structure of the transgenes present in the animals are shown on both sides of the panel.
21
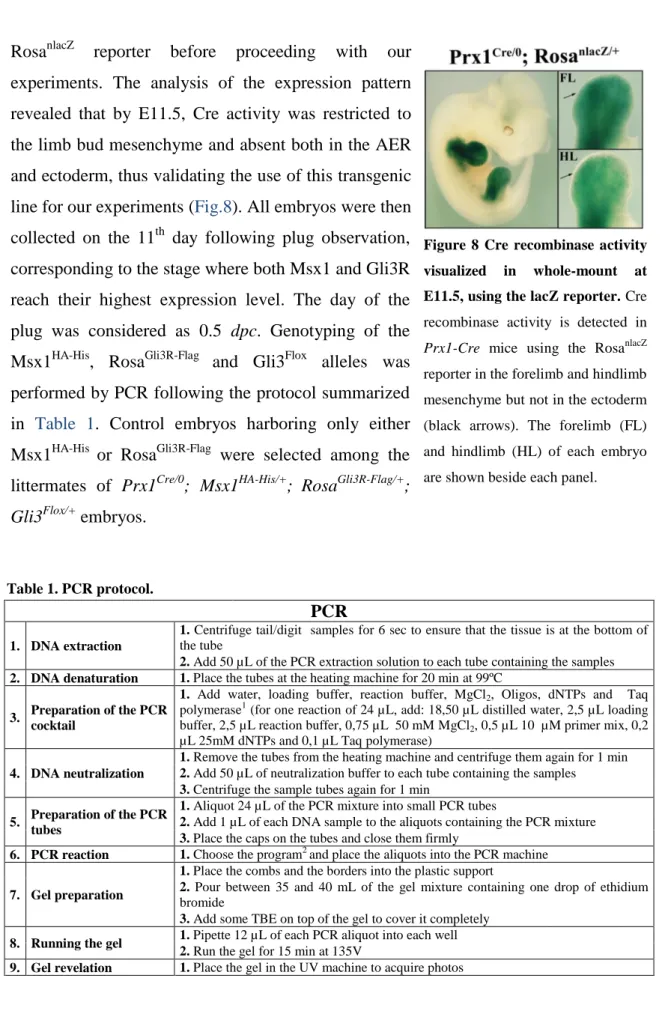
RosanlacZ reporter before proceeding with our
experiments. The analysis of the expression pattern revealed that by E11.5, Cre activity was restricted to the limb bud mesenchyme and absent both in the AER and ectoderm, thus validating the use of this transgenic line for our experiments (Fig.8). All embryos were then collected on the 11th day following plug observation, corresponding to the stage where both Msx1 and Gli3R reach their highest expression level. The day of the plug was considered as 0.5 dpc. Genotyping of the Msx1HA-His, RosaGli3R-Flag and Gli3Flox alleles was performed by PCR following the protocol summarized in Table 1. Control embryos harboring only either Msx1HA-His or RosaGli3R-Flag were selected among the littermates of Prx1Cre/0; Msx1HA-His/+; RosaGli3R-Flag/+; Gli3Flox/+ embryos.
1 The quantities of each reagent should be adjusted to the number of reactions 2
35 cycles for Msx1HA-His and Gli3Flox and 40 cycles for RosaGli3R-Flag Table 1. PCR protocol.
PCR
1. DNA extraction
1. Centrifuge tail/digit samples for 6 sec to ensure that the tissue is at the bottom of
the tube
2. Add 50 µL of the PCR extraction solution to each tube containing the samples
2. DNA denaturation 1. Place the tubes at the heating machine for 20 min at 99ºC
3. Preparation of the PCR cocktail
1. Add water, loading buffer, reaction buffer, MgCl2, Oligos, dNTPs and Taq
polymerase1 (for one reaction of 24 µL, add: 18,50 µL distilled water, 2,5 µL loading buffer, 2,5 µL reaction buffer, 0,75 µL 50 mM MgCl2, 0,5 µL 10 µM primer mix, 0,2
µL 25mM dNTPs and 0,1 µL Taq polymerase)
4. DNA neutralization
1. Remove the tubes from the heating machine and centrifuge them again for 1 min
2. Add 50 µL of neutralization buffer to each tube containing the samples
3. Centrifuge the sample tubes again for 1 min
5. Preparation of the PCR tubes
1. Aliquot 24 µL of the PCR mixture into small PCR tubes
2. Add 1 µL of each DNA sample to the aliquots containing the PCR mixture
3. Place the caps on the tubes and close them firmly
6. PCR reaction 1. Choose the program2 and place the aliquots into the PCR machine
7. Gel preparation
1. Place the combs and the borders into the plastic support
2. Pour between 35 and 40 mL of the gel mixture containing one drop of ethidium
bromide
3. Add some TBE on top of the gel to cover it completely
8. Running the gel 1. Pipette 12 µL of each PCR aliquot into each well
2. Run the gel for 15 min at 135V
9. Gel revelation 1. Place the gel in the UV machine to acquire photos
Figure 8 Cre recombinase activity visualized in whole-mount at E11.5, using the lacZ reporter. Cre recombinase activity is detected in
Prx1-Cre mice using the RosanlacZ
reporter in the forelimb and hindlimb mesenchyme but not in the ectoderm (black arrows). The forelimb (FL) and hindlimb (HL) of each embryo are shown beside each panel.
22
III.2. LacZ staining
Embryos from E11.5 up to E13.5 were dissected in PBS 1X and fixed in 4% PFA at 4ºC for one hour. After being washed three times in PBS 1X, these embryos were placed in a solution containing the enzyme β-galactosidase (see Appendix II for a complete list of the solutions and buffers used in the experiments) and then incubated at 4ºC overnight under slight agitation in the absence of light. On the next day, the embryos were washed three times in PBS 1X in order to stop the reaction and photographed under the binocular stereoscopic microscope.
III.3. Alcian Blue cartilage staining
Embryos from E13.5 up to E15.5 were dissected in PBS 1X and fixed in 4% PFA at 4ºC overnight. After being washed three times in PBS 1X, these embryos were refixed in 80% Ethanol overnight at 4ºC. On the following day, the embryos were placed in a staining solution containing Alcian Blue (see Appendix II) and kept for one day at 4ºC under slight agitation. Afterwards, they were washed twice in 80% Ethanol-20% Acetic acid and kept overnight at 4ºC. On the following day we proceeded to the visualization step by washing the embryos twice in 70% Ethanol-1% HCl solution keeping them again overnight at 4ºC. On the last day, the embryos were placed in 1% NaOH for 5-10 min to clear the skin and reveal the cartilage blue staining, washed twice in PBS 1X and photographed under the binocular stereoscopic microscope.
III.4. Alizarin Red skeletal staining
4-day old pups (P4) were euthanized by asphyxia with dry ice, eviscerated and then boiled at 70ºC for 20 min. After removing the skin, the newborns were fixed in 70% Ethanol overnight at 4ºC. On the following day, they were transferred into 1% NaOH and kept for one day to allow soft tissue dissociation. Afterwards the solution was replaced by adding fresh 1% NaOH together with 2 mL of Alizarin Red (see Appendix II) and the newborns were kept in for 1-2 days at 4ºC without agitation. To clear the skeleton, the newborns were then kept in 0,01% NaOH for several days. After removing all the unspecific red staining, they were washed twice in PBS 1X and photographed under the binocular stereoscopic microscope.
23
III.5. Limb bud protein extraction
For protein extraction of endogenous MSX1 and GLI3R proteins, both forelimbs and hindlimbs from E11.5 embryos were dissected in PBS 1X and placed on an eppendorf tube containing 20 µL of Lysis Buffer (20 µL of Lysis Buffer/limb bud) (see Appendix II). Afterwards, the limbs were repeatedly pipetted with a 200 µL pipette in order to improve tissue dissociation. The entire extraction procedure was performed on ice to avoid protein degradation. Following the extraction procedure, the limb bud lysates were then centrifuged for 30 min at 13 000 rpm at 4ºC and the supernatants were recovered and stored at -80ºC until further use.
III.6. Co-Immunoprecipitation (Co-IP) and Western Blotting
For Co-IP of endogenous MSX1 and GLI3R embryonic proteins, primary antibodies raised against the HA tag of Msx1 (Anti-HA Sigma Aldrich, ref: H6908) and the Flag tag of Gli3R (Anti-Flag Sigma Aldrich, ref: F1804) were covalently linked to magnetic Dynabeads® as described in the product protocol summarized in Table 2. Afterwards, the beads and limb bud lysates from E11.5 embryos were mixed and incubated with tilting and rotation. The Dynabeads®-Ab-Antigen bound complex was then eluted for direct downstream analysis by Western blotting, following the protocol summarized in
Table 3. After being separated by SDS-PAGE electrophoresis, the proteins from the lysates were transferred onto a nitrocellulose membrane. The membranes were then washed in blocking buffer solution, incubated with primary and secondary antibodies and imaged by chemiluminescence. Controls included a negative control where the protein extract was not associated with the antibody (-Ab), an input (positive control) corresponding to the pure limb bud extract, the IPs for each individual protein to guarantee that they were present in the limb extract, and finally the Co-IP.
III.7. Proximity Ligation Assay (PLA)
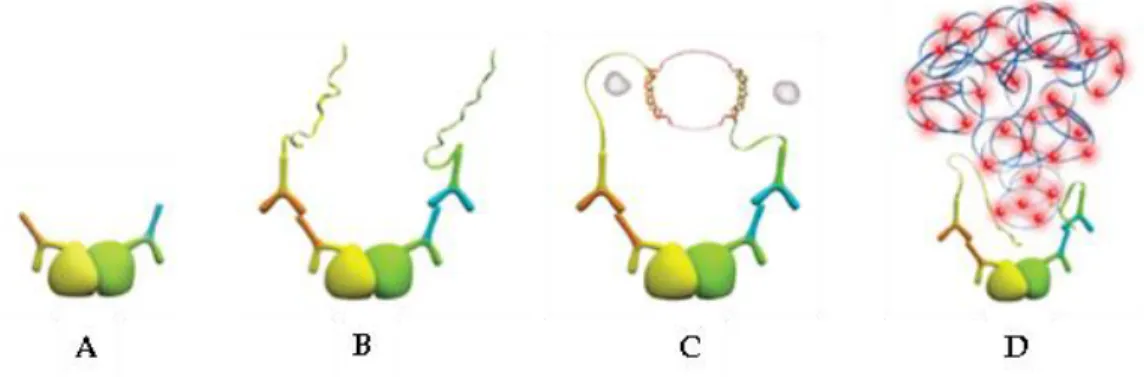
The PLA assay allows the in situ visualization of protein-protein interactions within cells using primary antibodies directed against specific proteins together with oligonucleotide-conjugated secondary antibodies. The principle is that when the PLA secondary probes are in close proximity (i.e. when two proteins are interacting with
24
each other), the DNA strands can interact and form a dsDNA loop. After joining of the two oligonucleotides by enzymatic ligation, they are amplified via rolling circle amplification using a polymerase. Following the DNA amplification reaction, fluorescent-labeled complementary oligonucleotide probes highlight the reaction site as a distinct bright dot when viewed under the fluorescence microscope (Fig.9).
In order to investigate possible interactions between MSX1, GLI3R and the PSmad1,5,8 protein complex, E11.5 Prx1Cre/0; Msx1HA-His/+; RosaGli3R-Flag/+; Gli3Flox/+ and Prx1Cre/0; Msx1HA-His/+ control embryos were dissected in PBS 1X and fixed in 4% PFA at 4ªC overnight. On the next day after being washed three times in PBS 1X, these embryos were embedded using Tissue Freezing Medium. The blocks containing the embryos were stored at -20ºC until they were sectioned transversally at the cryostat (sections with 12 µm of thickness). Afterwards, the sections were washed in PBS 1X to remove the freezing medium, blocked and incubated with the primary antibodies (see Appendix III for a complete list of the antibodies used in the experiments) at 4ºC overnight. The following steps were performed using the Duolink In Situ Orange Starter Kit, according to the manufacturer protocol summarized in Table 4. Sections of the forelimbs, hindlimbs and neural tube were then photographed using the 63x objective of the Zeiss LSM700 confocal microscope with the DAPI (λ=358 nm) and Cy3 (λ=550 nm) filters. The pictures taken were then analyzed using Adobe Photoshop CS5, ImageJ and Icy.
Figure 9 Principle of the PLA. A. Primary antibodies bind to their respective proteins. B. Duolink PLUS and MINUS secondary antibodies bind to the primary antibodies. C. When the PLUS and MINUS probes are in close proximity (less than 40 nm), the ssDNA reach each other and, with the Duolink Ligase solution, the strands form a dsDNA loop. D. After amplification, fluorescent probes bind to the complementary oligonucleotide sequence and the reaction site can be visualized under a fluorescence microscope.
25
III.8. Immunofluorescence
Embryos were dissected in PBS 1X and fixed in 4% PFA at 4ºC overnight. On the next day after being washed three times in PBS 1X, both forelimbs and hindlimbs were dissected in PBS 1X and embedded using Tissue Freezing Medium. The blocks containing the limb buds were stored at -20ºC until they were sectioned transversally at the cryostat (sections with 12 µm of thickness). Afterwards, an immunodetection against Caspase3 (see Appendix III) was performed on the transverse sections obtained in order to analyse the apoptosis taking place in the limb bud in the normal and Msx1-/-; Msx2
Immunoprecipitation using Dynabeads®
1.
Wa
shin
g
1. Resuspend Dynabeads® thoroughly by vortexing 1-2 min
2. Transfer 50 μL of Dynabeads® to a tube, place on the magnet and remove the supernatant 3. Remove the tube from the magnet and resuspend the Dynabeads® in 500 μL of 0.1 M Na-acetate pH 5
4. Place the tube on the magnet and remove the supernatant 5. Repeat steps 3 and 4 twice
2.
Ig
ca
pture
1. Dilute 1 µL of Anti-HA or Anti-Flag in 100 µL of PBS-0,1% Tween-20 and add it to the solution containing the washed Dynabeads®
2. Incubate with slow tilting and rotation for 1h at RT
3. Place the test tube on the magnet for 2 min and pipette off the supernatant
4. Remove the tube from the magnet and resuspend the Dynabeads® in 500 μL of 0.1 M Na-acetate pH 5
5. Place the tube on the magnet and remove the supernatant 6. Repeat steps 3 and 4 twice
3. Cro ss lin kin g
1. Wash the Dynabeads®-Ig complex in 1 mL of 0.2 M triethanolamine, pH 8.2 for 5 min, with the use of the magnet
2. Resuspend the Dynabeads®-Ig complex in 1 mL of freshly made 20 mM DMP in 0.2M triethanolamine, pH 8.2
3. Incubate with gentle mixing for 30 min at 20°C. Place the tube on the magnet and discard the
supernatant.
4. Remove the tube from the magnet and stop the reaction by resuspending the Dynabeads® - Ig complex in 1 ml of 50 mM Tris, pH 7.5
5. Incubate for 15 min with gentle mixing at RT
6. Wash the Dynabeads®- Ig complex 1 time with 100 µL of PBS-0,1% Tween-20
4. Ant ig en bin d
ing 1. Add 200 µL of the sample containing antigen directly to the Dynabeads®- Ig complex 2. Incubate overnight with slow tilting and rotation at 4ºC
3. Place the tube on the magnet and discard the supernatant
4. Wash the Dynabeads® on the following day three times with 1mL of PBS 1X 5. Place the tube on the magnet and remove the supernatant
5.
E
lutio
n 1. Prepare 20 µL of Laemlli-5%β-mercaptoethanol and mix with 20 µL of 0.1M Citrate, pH 2 2. Add the mixture to the Dynabeads®-Ig-Ag complex and incubate for 10 min at 70ºC
3. Place the tube on the magnet and remove the supernatant 4. Load the supernatant directly onto a gel for downstream analysis Table 2. Immunoprecipitation protocol using Dynabeads®.
26
Proximity Ligation Assay
1. Blocking 1. Add blocking solution to the slides. Incubate for 1h at 37ºC. 2. Remove the blocking solution
2. Primary antibodies
1. Dilute the primary antibodies in the Antibody Diluent solution provided in the Kit and incubate overnight at 4ºC in a humidity chamber (Anti-mouse 1:50 and Anti-rabbit 1:500)
2. Wash in 1X Wash Buffer A 2 times 5 min
3. PLA® probes
1. Dilute the MINUS and PLUS probes 1:5 in the Antibody Diluent solution and apply it to the slides
2. Incubate in a pre-heated humidity chamber for 60 min at 37ºC 3. Wash in 1X Wash Buffer A 2 times 5 min
4. Ligation
1. Dilute the Ligation stock 1:5 in H2O
2. Add Ligase to the Ligation solution at a 1:40 dilution and vortex 3. Add the Ligation-Ligase solution to each slide
4. Incubate in a pre-heated humidity chamber for 30 min at 37ºC 5. Wash in 1X Wash Buffer A 2 times 2 min
5. Amplification
1. Dilute the Amplification stock 1:5 in H2O
2. Add Polymerase to the Amplification solution at a 1:80 dilution and vortex
3. Add the Amplification-Polymerase solution to each slide 4. Incubate in a pre-heated humidity chamber for 100 min at 37ºC 5. Wash in 1X Wash Buffer B 2 times 10 min
6. Wash in 0,01X Wash Buffer B for 1min 7. Let the slides dry at RT in the dark 6. Imaging
1. Mount the slides with Duolink In Situ Mounting Medium with DAPI 2. Wait 15 min before visualizing in a fluorescence or confocal microscope or store the slides at -20ºC
Western Blotting
1. Running the gel 1. Load the samples onto the gel and run it for 1h at 150V 2. Remove the gel from the apparatus
2. Transferring
1. Prepare the sandwich for transferring, by placing Whatman paper, nitrocellulose membrane, the equilibrated gel and Whatman paper soaked in transfer buffer onto the Trans-Blot SD semi-dry cell
2. Roll a pipette over the sandwich to remove bubbles 3. Run for 30 min at 10V
3. Blocking 1. Place the nitrocellulose membrane in TBS-5% milk-0,1% Tween-20 and incubate for 1h at RT under gentle agitation
4. 1st Antibodies
1. Dilute the primary antibodies (Anti-HA or Anti-Flag 1:1000) in TBS-5% milk-0,1% Tween-20 and incubate overnight at 4ºC
2. Wash 5 times 5 min in TBS-0,1% Tween-20 under gentle agitation at RT 5. 2nd Antibodies
1. Dilute the secondary antibodies (Anti-rabbit or Anti-mouse HRP-conjugated 1:10000) in TBS-5% milk-0,1% Tween-20 and incubate for 1h at RT
2. Wash 5 times 5 min in TBS-0,1% Tween-20 under gentle agitation at RT
6. Revelation
1. Place the nitrocellulose membrane onto Saran wrap paper and transfer it to an X-ray cassette
2. Mix 250 µL of the two reagents provided in the Super Signal West Pico Chemiluminescent Substrate and apply it directly over the nitrocellulose membrane
3. Reveal by exposing the Hyper Film ECL from 1-5 min Table 3 Western Blotting protocol.
27
mutant background, respectively. The protocol followed is summarized in Table 5. Sections of the forelimbs and hindlimbs were then photographed using the 63x objective of the Zeiss LSM700 confocal microscope with the Alexa Fluor 488 (λ=495 nm) and the DAPI (λ=358 nm) filters. The pictures taken were then analyzed using Adobe Photoshop CS5 and ImageJ.
III.9. Statistical analysis
For the PLA, the area (in mm2) and fluorescence observed on the transverse sections of the forelimb, hindlimb and neural tube were determined using the Spot Detector plugin of the Icy software. The fluorescence density of each section was then calculated by the quotient between the number of fluorescent dots detected and the area in mm2 of the section. Data was grouped in two major sets, one for the Prx1Cre/0; Msx1HA-His/+; RosaGli3R-Flag/+; Gli3Flox/+ triple compound embryos and the other for the controls, and three subsets, forelimb, hindlimb and neural tube. Sets were analyzed using the Microsoft Excel 2010 software and statistical significance was evaluated using a two-tailed T test assuming unequal variance. Differences between sets were considered statistically relevant only when the p-value was inferior to 0,05.
Table 5 Immunofluorescence protocol.
Immunofluorescence on sections
1. Freezing medium removal 1. Wash in PBS 1X, 2 times 5 min at RT
2. Permeabilization 1. Wash in PBS-0,2% TritonX-100 for 20 min at RT
3. Blocking 1. Block in PBS-1% BSA-5% GS-0,5% Triton X100 for 1h at RT 4. Primary antibodies 1. Dilute the antibodies in PBS-1% BSA-5% GS-0,5% Triton X100 and
incubate overnight at 4ºC in a humidity chamber
5. Washes 1. Wash in PBS 1X, 3 times 10 min at RT
6. Secondary antibodies 1. Dilute the antibodies in PBS-1% BSA-5% GS-0,5% Triton X100 and
incubate for 1h at RT in a humidity chamber in the absence of light
7. Washes 1. Wash in PBS 1X, 1 time 10 min at RT, in the absence of light 8. Hoechst staining 1. Dilute Hoechst in PBS 1X (1:2000)
2. Incubate for 5 min at RT in the absence of light
9. Washes 1. Wash in PBS 1X, 2 times 10 min at RT, in the absence of light 10. Dako Mounting
1. Place 2 or 3 drops of Dako mounting medium on top of the slide 2. Place the coverslip on top of the slide by using fine forceps, carefully to
avoid air bubbles
11. Storage & Observation 1. Store the slides at -20ºC in the absence of light
28
IV. Results
IV.1. Overexpression of Gli3R driven by Prx1-Cre causes limb defects
Although previously we had verified that Cre activity driven by the Prx1 limb enhancer element was restricted to the limb field (Fig.8), we had not tested whether this transgene would drive the expression of flagged Gli3R in the limb. Thus, in order to test the functionality of the transgene, we carried out a series of morphological analyses using heterozygous Prx1Cre/0; RosaGli3R-Flag/+ and Prx1Cre/0 control embryos and newborns. The Alcian Blue cartilage staining revealed that Prx1Cre/0; RosaGli3R-Flag/+ embryos from 13.5 up to 15.5 dpc, displayed a series of limb abnormalities associated with growth impairment, including shortening of the three limb segments accompanied by central and/or posterior polydactily with syndactily in the autopod (Fig.10A–D and Fig.S.2). These limb malformations became even more conspicuous later during development, as shown by the Alizarin Red skeletal staining performed on 4-day old pups (P4) (Fig.10E–F).Figure 10 Alcian Blue and Alizarin Red skeletal staining of Prx1Cre/0; Rosa Gli3R-Flag/+ embryos and newborns. E15.5 Prx1Cre/0; RosaGli3R-Flag/+ embryos (A) display
a set of limb abnormalities compared to Prx1Cre/0 control embryos (B), including shortening of the three limb segments, specially the zeugopod (C, lower picture) and digit duplications in the autopod (D, right picture). At P4, these defects are even more striking (E, F). Forelimb controls are shown on the top (C and E) and on the left (D and F). The stylopod, zeugopod and autopod are depicted in the pictures by the letters S, Z and A, respectively. The digits – thumb to little finger – correspond to numbers 1 to 5; the digit duplications are indicated with an *.
29
Noticeably, although several defects were observed at the level of the limbs, neither the embryos nor the newborns displayed any abnormalities elsewhere, indicating that the overexpression of Gli3R was active specifically in the limb field, thus proving that our construct was working properly when driven by Prx1-Cre. Interestingly, the abnormalities observed were much more severe in the forelimbs, comparing to the hindlimbs (Fig.S.2), which may be due to the fact that the Prx1-Cre transgene becomes active later in the hindlimbs, resulting in the overexpression of Gli3R to take place too late to have an early effect.
IV.2.
Gli3R and MSX1 interact in vivo at E11.5 in the limb bud
In order to investigate possible interactions between MSX1 and GLI3R, we started by attempting to co-immunoprecipitate both proteins from limb bud extracts prepared from E11.5 Prx1Cre/0; Msx1HA-His/+;RosaGli3R-Flag/+; Gli3Flox/+ heterozygous embryos. Although we were able to detect in the IP’s a band of approximately 80 kDa corresponding to GLI3R and another around 35 kDa corresponding to MSX1, we were not able to detect either of these proteins by Co-IP (data not shown), meaning that either these two proteins do not interact with each other in vivo, or the amount of protein complexes present is below the detection threshold of this technique. This is highly possible especially considering that all the experiments were conducted on embryos heterozygous for the tagged and flagged forms of Msx1 and Gli3R, respectively. In an attempt to untangle whether this preliminary result was due to technical constraints, we decided to investigate possible in vivo interactions between these two proteins using Proximity Ligation Assay (PLA). For these experiments we embedded and sectioned
Prx1Cre/0; Msx1HA-His/+; RosaGli3R-Flag/+; Gli3Flox/+ heterozygous embryos together with
Prx1Cre/0; Msx1HA-His/+; Gli3Flox/+ control embryos. The PLA was then performed on the transverse sections containing the forelimbs, hindlimbs and the neural tube which was used as an internal negative control. The fluorescence observed and area (in mm2) on each section was quantified using the Spot Detector plugin of the Icy software. Fluorescent dots indicative of the MSX1-GLI3R interaction were detected at a high frequency in the forelimb and hindlimb mesenchyme of E11.5 embryos carrying Msx1HA-His and RosaGli3R-Flag, whereas almost no fluorescence was detected in the forelimbs and hindlimbs of their counterparts harboring only Msx1HA-His (Fig.11A’–D’). No fluorescence was detected in the dorsal region of the neural tube on both compound
30
mutant and control embryos, demonstrating yet again that the expression of Gli3RFlag driven by Prx1-Cre is restricted to the limb field (Fig.11E’–F’).
The fluorescence quantification supported even further these observations by revealing that on both forelimbs and hindlimbs there were significant differences in the fluorescence density (calculated by the quotient between the number of fluorescent dots detected and the area in mm2 of the sections) between compound and control embryos, whereas in the dorsal neural tube no significant differences were detected between compound and control embryos (Fig.11G). Taken together, these preliminary results support the existence of an in vivo interaction between MSX1 and GLI3R both in the forelimbs and hindlimbs at 11.5 dpc.
** **
n.s.
**
Figure 11 MSX1 and GLI3R interact with each other in the forelimbs and hindlimbs mesenchyme at 11.5 dpc. Fluorescent dots indicative of the MSX1-GLI3R interaction were detected in the forelimbs (B’) and hindlimbs (D’) of E11.5 embryos carrying Msx1HA-His and RosaGli3R-Flag, whereas almost no fluorescence wa
was detected in forelimbs (A’) and hindlimbs (C’) of their counterparts harboring only Msx1HA-His. No fluorescence was detected in the neural tube of both triple compound mutant (F’) and control embryos (E’). The cell nuclei observed on the DAPI channel are shown in (A–F), whereas the fluorescence dots indicative of protein interactions observed on the Cy3 channel are shown in (A’– F’). The fluorescence quantification revealed that in both forelimbs and hindlimbs there were significant differences between compound and control embryos, as opposed to the neural tube (G). ** p-value < 0,01; n.s. non-significant. nFL=8; nHL=10; nNT=3.
31
IV.3.
Gli3R and Msx1 interact with the BMP pathway through Smads
These results encouraged us to pursue our protein interaction assays, this time to test the involvement of both Msx1 and Gli3R in the BMP signaling pathway via the PSmad1,5,8 protein complex. For these experiments we followed the same procedure as before, embedding and sectioning Prx1Cre/0; Msx1HA-His/+; RosaGli3R-Flag/+; Gli3Flox/+heterozygous embryos together with Prx1Cre/0; Msx1HA-His/+; Gli3Flox/+ and Prx1Cre/0 control embryos. The PLA was then performed on the transverse sections containing the forelimbs, hindlimbs and the neural tube which was used as an internal negative control. The fluorescence observed and area (in mm2) on each section was quantified using the Spot Detector plugin of the Icy software. Fluorescent dots indicative of the GLI3R-PSmad1,5,8 interaction were detected only in the forelimbs mesenchyme of E11.5 embryos carrying Msx1HA-His and RosaGli3R-Flag, whereas almost no fluorescence was detected in the forelimbs of their counterparts harboring only Msx1HA-His (Fig.12A’–B’).
fluorescence was detected in forelimbs (A’) and hindlimbs (C’) of their counterparts harboring only Msx1HA-His. No fluorescence was detected in the neural tube of both triple compound (F’) and control embryos (E’). The cell nuclei observed on the DAPI channel are shown in (A–F), whereas the fluorescence dots indicative of protein interactions observed on the Cy3 channel are shown in (A’– F’). The fluorescence quantification revealed that in the forelimbs there were significant differences between compound and control embryos, as opposed to the hindlimbs and the neural tube (G). * p-value < 0,05; n.s. non-significant. nFL=3; nHL=2; nNT=2.
Figure 12 GLI3R and the PSmad1,5,8 protein complex interact in the forelimbs mesenchyme at 11.5 dpc. Fluorescent dots indicative of the GLI3R-PSmad1,5,8 interaction were detected in the forelimbs (B’) but not in the hindlimbs (D’) of E11.5 embryos carrying Msx1HA-His and RosaGli3R-Flag, whereas almost no fluorescence was detected in forelimbs (A) and hindlimbs (C) of their counterparts harboring only Msx1HA-His. No fluorescence was detected in the neural tube of both triple compound (F) and control embryos (E). The fluorescence quantification revealed that in the forelimbs there were significant differences between compound and control embryos, as opposed to the hindlimbs and the neural tube (G). * p-value < 0,05; n.s. non-significant. nFL=3;
nHL=2; nNT=2.
n.s. n.s.
32
No fluorescence was detected in the hindlimbs and in the dorsal region of the neural tube on both triple compound and control embryos (Fig.12C’–F’). Supporting these results, the fluorescence quantification revealed that there were statistically significant differences only in the fluorescence density between the forelimbs of compound mutant and control embryos (Fig.12G). As for MSX1-PSmad1,5,8 we observed that the fluorescent dots indicative of interaction were restricted, as in the GLI3R-PSmad1,5,8 assay, to the forelimbs of E11.5 embryos carrying both Msx1HA-His and RosaGli3R-Flag (Fig.13C’).
whereas the fluorescence dots indicative of protein interactions observed on the Cy3 channel are shown in (A’– F’). The fluorescence quantification revealed that in the forelimbs there were significant differences between compound and control embryos, as opposed to the hindlimbs and the neural tube (J). * p-value < 0,05; n.s. non-significant. nFL=2; nHL=3; nNT=2.
Figure 13 MSX1 and the PSmad1,5,8 protein complex interact in the forelimbs mesenchyme at 11.5 dpc. Fluorescent dots indicative of the MSX1-PSmad1,5,8 interaction were detected in the forelimbs (C’) but not in the hindlimbs (F’) of E11.5 embryos carrying Msx1HA-His and RosaGli3R-Flag, whereas almost no fluorescence was detected in forelimbs (A’, B’) and hindlimbs (D’, E’) of their counterparts harboring only Msx1HA-His or Prx1Cre. No fluorescence was detected in the neural tube of control (G’), double (H’) and triple (I’) compound embryos. The cell nuclei observed on the DAPI channel are shown in (A–F), whereas the fluorescence dots indicative of protein interactions observed on the Cy3 channel are shown in (A’– F’).
n.s. n.s.