School performance: An IDEB analysis of the seven
municipalities in the ABC region
Desempenho escolar: uma análise do IDEB dos municípios da região do ABC
Paulo Sérgio Garcia1, Leandro Campi Prearo2, Maria do Carmo Romero3, Anderson Secco4, Marcos Sidnei Bassi5
Municipal University of São Caetano do Sul, USCS, São Caetano do Sul, São Paulo, Brazil
Abstract
The quality of basic education in Brazil has been monitored, especially by the Basic Education Development Index (Índice de Desenvolvimento da Educação Básica – IDEB), created in 2007. This index combines students’ achievement in the System of Assessment for Basic Education (Sistema de Avaliação da Educação Básica- SAEB) for states and, the Brazilian Exam (Prova Brasil) for municipalities, with the school flow (taking into account dropout numbers). This study analyzes the IDEB of the seven municipalities in the ABC region, performing multiple comparisons using mixed methodology. It was analyzed the IDEB of each city, regarding the schools’ level of education (Elementary Education I e II). It were considered in the analysis, the school development with respect to achieving the goals established by the several administrative spheres and by the INEP, as well as, the proportion of students who reached the appropriate level in the competences of reading, text interpretation and the competence of problem solving. Concurrent, it was analyzed with school Principals, all the information to contextualize the quantified data. The results showed gradual and continuous evolution in the index of Elementary Education I in municipal and state spheres, and minimal growth or stagnation in Elementary Education II. A reality even harder is presented in the learning of mathematics. At the data contextualization, the absence of positive continuity from the results of Elementary Education I, to Elementary Education II, was attributed to the characteristics of each segment, such as number of teachers, type of treatment given to the student, methods used, references shared and accepted, school organization, and school management. This data may assist the schools in the qualitative improvement of education in the cities of this region.
Keywords: School performance. IDEB in the ABC region. Elementary Education. Quality of education.
Resumo
A qualidade da Educação Básica no Brasil tem sido monitorada, sobretudo, pelo Índice de Desenvolvimento da Educação Básica (IDEB), criado em 2007, que combina o desempenho dos alunos no Sistema de Avaliação da Educação Básica (SAEB), para os estados, e na Prova Brasil, para os municípios, e o fluxo escolar. Este estudo analisa o IDEB dos municípios que formam a região do ABC paulista, realizando várias comparações por meio de metodologia mista. Analisou-se o índice, 1 Coordinator at the Education Observatory of the ABC region, Post-doctorate at the Faculty of Education,
University of São Paulo. Email: [email protected]
2 Education Observatory of the ABC region. Email:[email protected]. 3 Education Observatory of the ABC region. Email: [email protected] 4 Education Observatory of the ABC region. Email:[email protected] 5 Education Observatory of the ABC region. Email:[email protected].
em cada uma das cidades, referente ao nível de Ensino Fundamental I e II. Foram considerados, na análise, o desenvolvimento das escolas, no que tange ao alcance das metas estipuladas pelas diferentes esferas administrativas e pelo INEP, e as proporções de alunos que atingiram o nível adequado na competência de leitura e interpretação de texto e na de resolução de problemas. Concomitantemente, foram analisadas, junto aos diretores das escolas, informações que contextualizassem os dados quantificados. Os resultados mostraram evolução gradual e contínua do índice no Ensino Fundamental I, nas esferas municipal e estadual, e crescimento ínfimo ou estagnação no Fundamental II. Uma realidade ainda mais dura se apresenta na aprendizagem da matemática. Na contextualização dos dados, a ausência de continuidade positiva dos resultados do Fundamental I para o II foi atribuída às características de cada segmento como o número de professores, o tipo de tratamento dado ao jovem, os métodos utilizados, as referências compartilhadas e aceitas, a organização da escola e a gestão escolar. Esses dados podem auxiliar as escolas no aprimoramento qualitativo da educação nas cidades da região.
Palavras-chave: Desempenho escolar, IDEB na região do ABC, Ensino
fundamental, Qualidade do ensino.
Introduction
In Brazil, in recent decades, Basic Education, especially the Elementary and High School, has being monitored through indexes that evaluate student performance in standardized tests, using also the school rates of approval and reprobation. In the state of São Paulo, for example, the Index of Education Development of the São Paulo State (Índice de Desenvolvimento da Educação do Estado de São Paulo- IDESP) was created by the local educational authorities with the purpose of monitoring the education. The IDESP is a quality’s indicator of the Elementary and High School that uses the students’ performance in the exams from the System of School Performance Assessment of the State of São Paulo (Sistema de Avaliação de Rendimento Escolar do Estado de São Paulo - SARESP) and, the school flow.
At the national level, the IDEB, created by Decree No. 6094 of 24 April 2007, was implanted to follow and monitor the quality of Elementary Education Schools, focusing on the 5th and 9th year. Such index combines the performance of students in the disciplines of Portuguese and Mathematics and, the school flow.
The creation of IDEB represents a pioneering initiative in Brazil, because from it became possible to monitor the quality of education under two aspects that are equally important: school performance, represented by rates of approval, reprobation and dropouts, and the learning, captured through the performance average in the Brazil Exam and the SAEB. The logic of this indicator relates to the idea that, in a quality school, the student advances in his formative path, passes the year and learns, without wasting time with reprobation.
This is an indicator that has as premise, the idea that an educational system where students fail systematically and where a large portion leaves the school before completing Basic Education is not a desirable system, even considering that a portion of young people complete the Basic Education achieving high performance in standardized tests. On the other hand, it is also not desirable for a system that all students complete the Basic Education with little learning, even if in the right period.
Studies about the IDEB, among them the one of Roitman and Mozart (2001) and Vidal and Vieira (2011), which analyzed the behavior of this indicator in early and last years of Elementary School in 10 municipalities of Ceará (Brazil), showed that the progress on this indicator are greater in the early years than in the final years of Elementary School. However, these studies do not have explanations for this situation, in its results, or feature some general considerations, that do not allow the creation of particularized actions to assist schools and cities.
This study starts from a bigger research project of the Education Observatory, from the São Paulo’s ABC region. It investigates the situation of IDEB in Elementary Education I (Ensino Fundamental I - EFI) and Elementary Education II (Ensino Fundamental II - EFII), of the ABC region municipalities, in the state and municipal sphere, seeking, in parallel, in the perspective of school directors, explanations to contextualize the data that were found.
It is intended that the results of this study, made available to the municipalities and school managers, contribute to the understanding of the phenomenon and to improve the quality of education, considering that the region seeks, through the Consortium between cities of the ABC region, discuss and improve the education of the seven cities.
The logics of IDEB
The Decree no. 6,094, dated 24 April 2007, shows that:
Art.3º. The quality of basic education will be gauged, objectively, based on the IDEB, calculated and published periodically by the INEP, from the data on scholastic performance, combined with the students’ performance, constant in the school census and in the System of Assessment for Basic Education (Sistema de Avaliação da Educação Básica- SAEB), which is composed by the National Assessment of Basic Education (Avaliação Nacional da Educação Básica- ANEB) and, the National Assessment of School Performance (Brazil Exam).
The IDEB seeks to enlarge the possibilities of society mobilization in favor of education, since the indicator is nationally comparable through results that bring together learning with school flow. The equilibrium of these two dimensions provides that, if a network or educational system count with many reprobation to obtain better results in the Brazil Exam (Prova Brasil), the flow will be affected, indicating quality problems. The same is true if the school approves students improperly, on the account of low income. In these parameters, it is a public policy that seeks the quality of education, that is, a tool for monitoring the quality goals from the Education Development Plan, which establishes as a goal that, in 2022, the IDEB of Brazil will be 6.0 (average goal comparable to an educational system of quality from developed countries).
The IDEB is considered more than just a statistical indicator; it is a conductor of policies to the quality improvement of education in schools, at national, state and municipal levels. It allows the establishment of intermediary individual goals for schools, enabling the search for quality of teaching. Such goals are the paths established by individual evolution of indices, so that Brazil reaches the educational level of countries from the Organization for Economic Co-operation
and Development6. This means advancing from the national average of 3.8, in
2005, to an IDEB of 6.0, in the first phase of Elementary School.
The goals are differentiated for each teaching network and schools, and are presented biennially from 2007 to 2021. The central idea is that each state, municipality and school has to improve their indicators, contributing so that Brazil meets the goal of 6.0 in 2022, year of the independence bicentennial. Even for those schools that have already reached the goal, it is expected to continue improving. And for those educational networks and schools that have problems, it is foreseen specific support to help them in their performance.
The IDEB varies from zero to 10 points on a scale of quality, and the higher the note, better is the students’ performance and greater is the regularity in the school flow. In this case, the result of the Brazil Exam, which is presented in points on a proficiency scale (SAEB Scale), is positioned and distributed in four levels: insufficient, basic, proficient and advanced. The Qedu portal, developed by Meritt and Lemann Foundation and with advisement of Professor Francisco Soares (now president of Inep), whose goal is allowing that the Brazilian society follows the teaching quality in public schools, considers that learning is appropriate at the junction of levels proficient and advanced.
The IDEB introduces, according to Ronca (2013), some positive points, such as the articulation between the concepts of flow and performance, fostering an understanding of the quality of schools and systems, assisting managers and teachers in identifying competencies and difficulties of students in the subjects assessed - Portuguese and Mathematics. The IDEB also assists in diagnosing, monitoring, and in the grouping of information for the creation of public policies, establishing objective and individualized goals for each school, educational system, municipalities and states in Brazil. Such situation has the goal, among others, of controlling and developing actions to fight school failure.
However, the IDEB also presents several limitations. In fact, it is not possible to assume the IDEB as a device to understand the quality of Basic Education. The assessments on a large scale, using only two factors, school flow and student performance, associated directly with the issue of reading and mathematics, are not able to capture the complexity of school.
According to Garcia (2015), the complexity of school cannot be captured by only one quality indicator, being related to many other dimensions. The author asserts that there is not an isolated factor, which explains, for example, the good performance of students. There is a “magnetic field” formed by multiple factors that sustain and support the learning and the good performance of students. Other authors (RUTTER et al, 1979) had already signaled that at school there is a wide variety of mechanisms, which act in a combined way and, are more intense than any individual factor acting singly. The same researchers suggested that there is a kind of school global ethos7. Likewise Barbosa and Fernandes (2001), in this sense, affirm
that are varied the factors that act concomitantly, and in a complex interaction, at various levels of social insertion, to determine good student performance.
6 OECD: acts at international and intergovernmental spheres, bringing together the most industrialized countries of the world, as well as some emerging. Is headquartered in Paris, France, and is a body composed by 34 members. The organization was founded on 14 December 1961.
7 The concept refers to the question that each school has an articulated set of ways to think, organize and carry out the educative and pedagogy practice and, this “school culture” influences the variability of the educational effects on students.
In another study, Garcia (2014) showed that it is not fair the comparison between schools located in areas of risk, without adequate infrastructure, with teachers poorly trained and precarious working conditions, attending youth who came from poor families, with low income and parents often illiterate, with those who came from other institutions, located in major centers, which have good infrastructure, teachers with appropriate training, students from families with high socioeconomic level and significant cultural capital.
There is also the matter that the IDEB has induced, by the media, a way of classification among schools that have good and bad results. Such situation, according to Soares and Xavier (2013), has gained a more punitive nature, for many schools, instead of a formative one, as was the original idea when the indicator was created.
Despite these negative points, it must be recognized that the IDEB creation, as an educational public policy, allows monitoring the quality of school, helps in the fight against school failure, expands the society mobilization possibilities in favor of education and allows monitoring the teaching goals. On the part of schools, they recognize that a high performance of IDEB means to be much more recognized and valued by the community.
The region ABC of São Paulo
The ABC region is part of the metropolitan region of São Paulo. Seven cities compose the area. They are the municipalities of Santo André (SA), São Bernardo do Campo (SBC), São Caetano do Sul (SCS), Diadema (D), Mauá (M), Ribeirão Pires (RP) and Rio Grande da Serra (RGS).
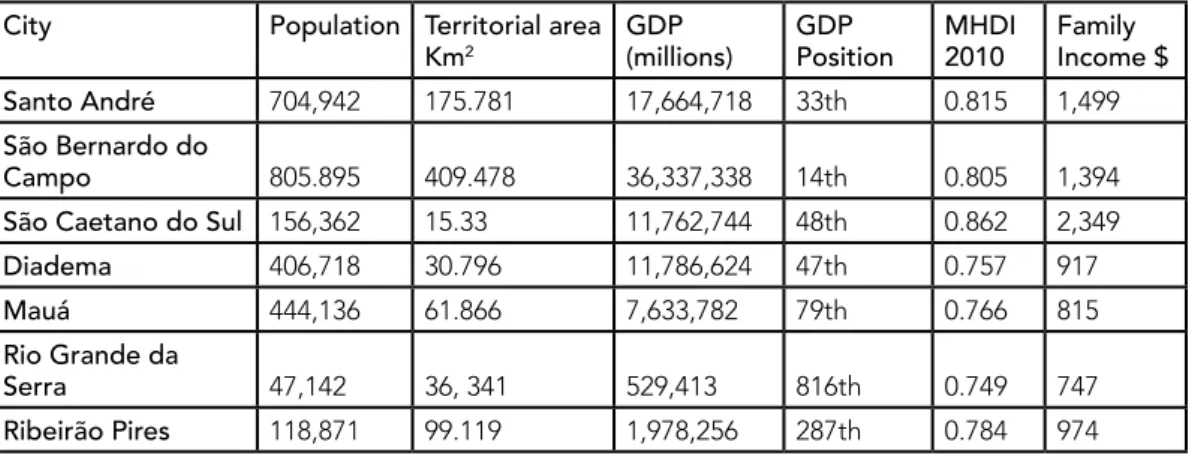
It is a region with more than 2.5 million inhabitants, area of 635 km² (IBGE, 2014), an industrial GDP (PIB) of approximately R$27 billion, being considered the second of the state and, the third of the country. Data of the Consortium between cities of the ABC region (2013) have showed that there are 44 thousand formal establishments, generating 800 thousand jobs, more or less 37 thousand commercial and service units, with 530 thousand jobs and 6.3 thousand industrial units.
Table 01 shows the demographic characteristics of the region:
City Population Territorial area
Km2
GDP
(millions) GDPPosition MHDI2010 Family Income $
Santo André 704,942 175.781 17,664,718 33th 0.815 1,499
São Bernardo do
Campo 805.895 409.478 36,337,338 14th 0.805 1,394
São Caetano do Sul 156,362 15.33 11,762,744 48th 0.862 2,349
Diadema 406,718 30.796 11,786,624 47th 0.757 917
Mauá 444,136 61.866 7,633,782 79th 0.766 815
Rio Grande da
Serra 47,142 36, 341 529,413 816th 0.749 747
Ribeirão Pires 118,871 99.119 1,978,256 287th 0.784 974
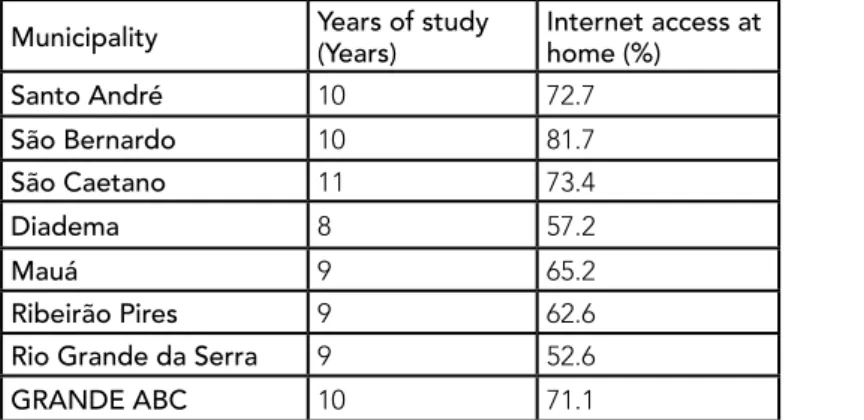
São Bernardo has the largest area, population and GDP, but São Caetano has the largest Municipal Human Development Index (MHDI) and higher family incomes. Table 02 shows the years of study and the internet access of cities:
Municipality Years of study(Years) Internet access at home (%)
Santo André 10 72.7 São Bernardo 10 81.7 São Caetano 11 73.4 Diadema 8 57.2 Mauá 9 65.2 Ribeirão Pires 9 62.6
Rio Grande da Serra 9 52.6
GRANDE ABC 10 71.1
Table 02: shows the years of study and the access to internet - Source: Cities and ABC region - USCS/2014 In all of the cities, the population has, on average, 10 years of study, showing that this is a region with higher indices of education than the Brazilian reality, which does not exceed eight years of studies (PNAD, 2013). However, as can be seen in Table 02, the region still has not solved, the problems regarding access to internet; in some municipalities, the access is a little larger than 50%.
Data from the School Census of 2013 showed that the ABC region had 198 municipal public schools and 160,680 enrollments in Elementary School. On the other hand, the state education network counted with 327 institutions and 273,054 students enrolled.
The region has already advanced in relation to the basic components of school infrastructure. All schools in the region had electricity (100%) and filtered water (100%). In general, schools had computer labs (state schools 89%; municipal schools 90.4%), a few libraries (state schools 15%; municipal schools 63%) and a few science laboratories (state schools 34.9%; municipal schools 6.6%). In some items, the region still needs to advance, since Brazilian studies have already showed that the use of science laboratories and the library, infrastructure components, are decisive for the academic performance of students (MENEZES FILHO, 2007; BIONDI; FELÍCIO, 2007).
Data supplied by the Education Observatory of the ABC region, of 2015, have showed that the schools, in general, have rooms for teachers and direction, printers and copiers. In terms of spaces intended for special education, the school units had toilets (municipal schools: 66.2%; state schools: 20.8%), dependencies for the physically disabled (municipal schools: 45.5%; state schools: 17.4%) and a classroom for special attendance (municipal schools: 33.3%; state schools: 16.8%).
The principals group of Elementary Education in the region is formed, in the majority, by women, as much in the municipal sphere as state, with age over 40 years, trained in Pedagogy courses, in private institutions and in classroom courses. Most have some kind of specialization of 360 hours and works an average of 40 hours a week (Education Observatory of the ABC region, 2015).
In Elementary Education there are, in the region, 7,397 teachers of the municipal educational system and 13,778 of the state system. Almost 90% are women who consider themselves white, have some kind of specialization of 360 hours, and 50% are over the age of 50 (Education Observatory of the ABC region, 2015).
Methodology
This study is part of a bigger research project of the Education Observatory, from the São Paulo’s ABC region, that investigates the situation of IDEB in Elementary Education I and II, of the ABC region municipalities, in the state and municipal sphere. The project foresees, among other things, the contextualization of data, made through the participation of a group of school principals from the same region.
It is a mixed study, which involves the methodologies: a) quantitative analysis, aiming to identify and compare the indices of IDEB in each municipality, from the year 2007, seeking to find differences, similarities and possible relations between them. Due to the size of the sample (seven municipalities), it was not possible, in the research presented here, the achievement of statistical tests. It was decided, then, by an exploratory data assessment, analyzed through tables; b) qualitative research, seeking to contextualize the results from the perspectives of school directors from the region, through exploratory analysis as well.
The region was selected because it is one of the richest in the country. Its average HDI-M (of Municipalities), in 2010, was approximately 0.792. The population had, on average, 10 years of studies and the schools had adequate infrastructure for student learning.
For obtaining the information, we used data from the School Census of 2013, available at the portal of the National Institute for Educational Studies and Research (Inep)8, of the information repository of the University of São Caetano do Sul and
the Education Observatory of São Paulo’s ABC region.
The information for this study, obtained in these three sources, were distributed in three complementary categories, previously selected: 1) school development of the seven municipalities, 2) IDEB of municipalities: average, goals and variations, and 3) proportion of students who have learned properly the competences of reading and problem solving.
In the first category were collected and grouped data on: a) number of municipal schools, b) amount of enrolments in the segment of Elementary Education, c) participation of educational units in the IDEB of 2013, d) amount of schools that have already reached the individual goal, e) amount of schools that have already reached the municipal goal, f) amount of schools that have already reached the Brazil goal of 2022. In the second, the data were grouped into: a) IDEB noted, b) goals established by the Inep for each of the cities in the 5th and 9th years starting from the year 2007 and, c) absolute variations.
In the third category, were grouped the information about the proportion of students who have learned properly the competences of reading and text interpretation and the problem solving competence, in the 5th and 9th years, of the municipal and state educational networks.
The data collected, are then, related to 5th and 9th grade of Elementary Education, in the disciplines of Portuguese and Mathematics (in the competences of reading, text interpretation and in the problem solving competence), of schools from the municipal and state educational networks and of the municipalities of São Paulo’s ABC region.
From the results found and in order to explain them, were invited to be interviewed directors of municipal and state schools of the seven municipalities. Of those, only 8 Inep - http://portal.inep.gov.br/basica-censo
17 directors from four cities agreed to participate, being: three of Santo André, two from state schools and one from a municipal school; four of São Bernardo, two and two; seven of São Caetano, five and two; three of Diadema, one and two. The educational units selected, attended students in the two stages, EFI and EFII, and have showed progress in the IDEB from 2011 to 2013.
The interviews with open questions collected information seeking to understand the lack of positive developments in the results of the IDEB from the EFI for the EFII. In other words, what factors could explain the major advancements in the early years and the stagnation in the final years of schools from the ABC region.
The data were analyzed based on an inductive approach, suitable for the construction of the substantive theories about phenomena or social events (CORBIN; STRAUSS, 1998). The testimony of the directors were decomposed through a thematic investigation, highlighting the more present and significant themes. From the codification of such analysis, it was possible to filter the data, using codes and descriptors (axial coding). In this way, all the regularities, similarities and differences were grouped together and this conversion and reduction allowed the creation of subcategories.
Results
The results are presented, initially, contextualizing the number of municipality schools, the amount of enrolments in the segment of Elementary Education, the participation of the educational units in the IDEB 2013, the amount of schools that have reached already the individual goal, municipal goal and the Brazil goal for the year 2021. Subsequently, are shown the data observed of IDEB and the goals established by Inep to each of the seven cities, in the fifth and ninth years, starting from the year of 2007. Are presented also the proportion of students who have learned properly the competences of reading, text interpretation and the problem resolution competence, in the fifth and ninth years (of municipal and state educational networks). Finally, the results found are contextualized.
The development of the schools of seven municipalities
In Elementary Education, the Brazilian schools have totaled 141,260 units, with 45 federal schools, 25,003 state schools, 93,866 municipal schools and 22,346 belonging to the private sphere (School Census, 2013). The ABC region had 1,331 schools, representing more or less 0.7% of total Brazilian schools. In the Elementary Education of municipalities, there are 198 educational institutions and 327 of the state (Education Observatory of the ABC region, 2015).
In Elementary Education there were 29,069,281 students studying in Brazilian schools (School Census, 2013). In the ABC region, the schools of Elementary Education had 160,680 enrolments in the municipal sphere and 273,054 in the state sphere (Education Observatory of the ABC region, 2015).
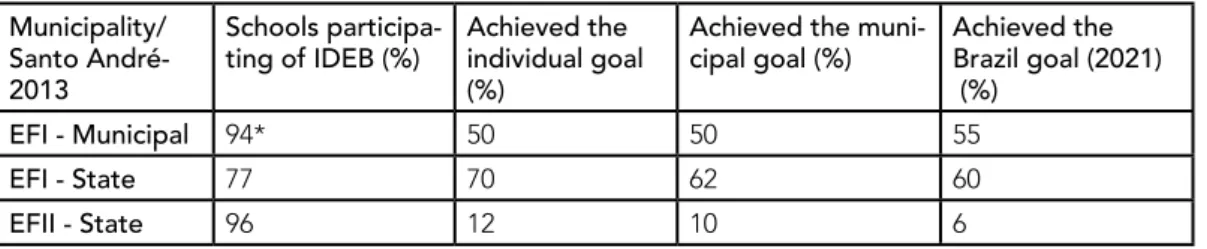
The city of Santo André, in accordance with the School Census of 2013, had 51 municipal schools and 84 state schools of Elementary Education. Regarding the attending of students, there were 18,482 students enrolled in the municipal sphere and 41,990 in the state sphere. The municipality had schools of Elementary Education I, municipal and state, indicating that this segment has not been fully municipalized. Table 03 summarizes the results:
Municipality/ Santo André-2013
Schools
participa-ting of IDEB (%) Achieved the individual goal (%)
Achieved the
muni-cipal goal (%) Achieved the Brazil goal (2021) (%)
EFI - Municipal 94* 50 50 55
EFI - State 77 70 62 60
EFII - State 96 12 10 6
Table 03: situation of schools in the municipality of Santo André.
* The reasons for the non-participation of a school may be associated with insufficient number (below 20) of students in the Brazil Exam of that year so that the results are disseminated or they may not have classes of fifth or ninth year
In this municipality, among the Elementary Education schools, those related to the early years of the state sphere were those that reached most the individual and municipal goal, and were those that most have reached or exceeded the Brazil goal of 2021.
The municipality of São Bernardo do Campo, according to the School Census of 2013, had 72 municipal schools and 73 state schools of Elementary Education. These units of teaching had 40,755 students enrolled in the municipal sphere and 42,515 in the state sphere. Table 04 shows the results:
Municipality/ São Bernardo do Campo- 2013
Schools
participa-ting of IDEB (%) Achieved the indi-vidual goal (%) Achieved the mu-nicipal goal (%) Achieved the Brazil goal (2021) (%)
EFI - Municipal 92 70 57 75
EFII - State 100 25 17 12
Table 04: situation of schools in the municipality of São Bernardo do Campo.
The city of São Bernardo do Campo attends students in Elementary Education in municipal and state schools. The EFI is met in municipal units and has already been municipalized and the EFII by the state schools of the municipality.
The city of São Caetano do Sul, as shown in the School Census of 2013, had 20 municipal schools and 10 state schools of Elementary Education. All of these educational establishments had 11,220 students enrolled in the municipal sphere and 2,783 in the state sphere. Table 05 shows the results.
Municipality/ São Caetano do Sul - 2013
Schools
participa-ting of IDEB (%) Achieved the individual goal (%)
Achieved the
muni-cipal goal (%) Achieved the Brazil goal (2021) (%)
EFI - Municipal 90 70 80 100
EFII - Municipal 70 40 10 90
EFII - State 100 40 10 10
Table 05: situation of schools in the municipality of São Caetano do Sul.
In São Caetano do Sul, in Elementary Education I, all schools have already reached or exceeded the Brazil goal 2021. The attending of EF II is performed by municipal and state educational institutions.
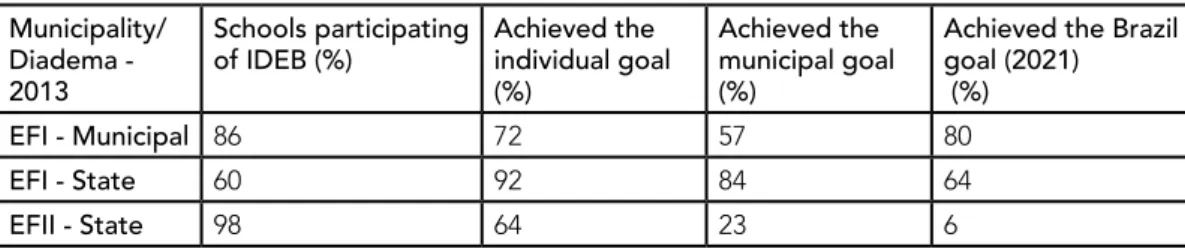
The municipality of Diadema, in accordance with the School Census of 2013, had 27 municipal schools and 56 state schools of Elementary Education. Of these, in relation to the number of students enrolled, there were 12,956 in municipal units and 39,302 in the state units. Table 06 summarizes the results.
Municipality/ Diadema -2013
Schools participating
of IDEB (%) Achieved the individual goal (%)
Achieved the municipal goal (%)
Achieved the Brazil goal (2021)
(%)
EFI - Municipal 86 72 57 80
EFI - State 60 92 84 64
EFII - State 98 64 23 6
Table 06: situation of schools in the city of Diadema.
The lowest number of schools that has participated of the IDEB in 2013 is located in the EFI in the state sphere. However, this segment was the one that most reached the individual and municipal goal.
The city of Mauá, in accordance with the School Census of 2013, had 16 municipal schools and 64 state schools of Elementary Education. These educational units had 3,214 students enrolled in the municipal sphere and 44,389 in the state sphere. Table 07 shows the results:
Municipality/ Mauá-2013
Schools participating
of IDEB (%) Achieved the individual goal (%)
Achieved the municipal goal (%)
Achieved the Brazil goal (2021)
(%)
EFI - State 95 85 6 50
EFII - State 88 25 15 12
Table 07: situation of schools in the municipality of Mauá.
The municipality of Mauá counts with municipal and state schools of EFI and EFII in attendance of students. However, as only one municipal school has participated in the IDEB 2013, it was not considered in this analysis due to the low representativeness of the sample.
The city of Ribeirão Pires, as shown in the School Census of 2013, had 9 municipal schools and 29 state schools of Elementary Education. All of them had 3,420 enrollments in the municipal sphere and 9,696 in the state sphere. Table 08 summarizes the results:
Municipality/ Ribeirão Pires -2013
Schools participating
of IDEB (%) Achieved the individual goal (%) Achieved the municipal goal (%) Achieved the Brazil goal (2021) (%) EFI - Municipal 100 90 70 90 EFI - State 100 50 50 100 EFII - Municipal 78 78 56 56 EFII - State 100 40 35 15
Table 08: situation of schools in the municipality of Ribeirão Pires.
In this municipality, the EFI municipal schools were those that most reached the individual and municipal goal. The Brazil goal, however, was most reached by the state educational units. In the EFII, the municipal schools obtained better results.
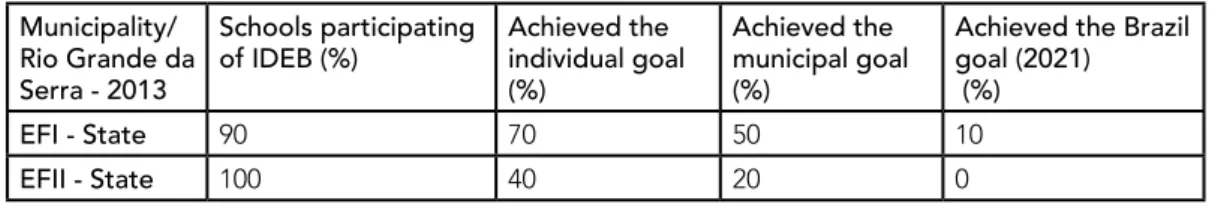
The municipality of Rio Grande da Serra, in accordance with the School Census of 2013, had 3 municipal schools and 11 state schools of Elementary Education. Of these, 176 enrollments were located in the municipality and 5,091 in the state. Table 09 summarizes the results:
Municipality/ Rio Grande da Serra - 2013
Schools participating
of IDEB (%) Achieved the individual goal (%)
Achieved the municipal goal (%)
Achieved the Brazil goal (2021)
(%)
EFI - State 90 70 50 10
EFII - State 100 40 20 0
Table 09: situation of schools in the municipality of Rio Grande da Serra.
The data of the School Census of 2013 showed that the city of Rio Grande da Serra meets students of Elementary Education I and II in the state sphere. Of both segments, few schools have reached the Brazil goal 2021.
From the results presented, the city of Santo André, in the EFI, was the one in which fewer schools reached the individual goal, municipal goal and the Brazil goal 2021. Were considered the number of municipality schools, amount of enrollment in the segment of Elementary Education, participation of the educational units in the IDEB 2013, amount of schools that have already reached the individual goal, municipal goal, the Brazil goal 2021. In the same segment, in São Caetano, the units of education have reached more the goals and in Ribeirão Pires are located the education establishments that reached more the individual goal.
In the segment of state schools of Elementary Education I, Rio Grande da Serra was the municipality in which less schools reached the goals (individual goal, municipal goal, the Brazil goal 2021). On the other hand, the city of Diadema was characterized for being the one that reached more the three goals.
In the EFII municipal, the city of São Caetano do Sul showed the worst results in relation to the goals: 60% of schools did not reach the individual goal. It is important to emphasize that this segment, EFII municipal, has attendance in this city, in Ribeirão Pires and in the municipality of Mauá, and this last has only one school performing such service.
In the Elementary Education II of state schools, the city of Santo André showed the worst efficiency in relation to the goals: almost 90% have not reached the individual goal. The best result, in this segment, was in the municipality of Ribeirão Pires.
The IDEB of municipalities: average, goals and variations.
The distribution of attendance, Elementary Education I and II of the ABC region, presents certain particularities according with the social, economic and demographic characteristics of each city. São Caetano do Sul, Mauá (only one school) and Ribeirão Pires count with municipal schools of EFII, what does not happen in other municipalities, where all attendance occurs in state schools. In all of the cities, the state sphere is present in the EFII.
The following charts expand the understanding about the IDEB of each municipality. Chart 01 summarizes the data observed in each city, the 5th year’s goal of the municipal educational networks and the absolute variation (IDEB X GOAL) with the beginning in 2007 until 2013.
Municipal Sphere: Fund. I - Fifths years -- IDEB OBSERVED
GOAL (Inep) VARIATION (IDEB X GOAL) Municipality 2007 2009 2011 2013 2007 2009 2011 2013 2007 2009 2011 2013 Santo André 4.9 5.1 5.4 5.6 4.8 5.1 5.5 5.8 0.1 0 - 0.1 - 0.2 São Bernardo 5.1 5.5 5.8 6.0 4.9 5.3 5.6 5.9 0.2 0.2 0.2 0.1 São Caetano - 5.9 6.4 6.6 - - 6.2 6.4 - - 0.2 0.2 Diadema 5.0 5.2 5.4 5.9 4.8 5.1 5.5 5.8 0.2 0.1 - 0.1 0.1 Mauá - - - -Ribeirão Pires 5.7 5.8 5.9 6.1 5.2 5.5 5.9 6.1 0.5 0.3 0 0 Rio Grande - - -
-Chart 01: IDEB Observed of fifths years -- Elementary Education I (municipal)
* in the city of Mauá only one school participated in the IDEB 2013 and was not considered in the analysis.
In general, in the IDEB observed in Elementary Education I, municipal, the cities showed growth in the scores and followed closely the goals established by the National Institute of Researches. Many of these goals have already been overcome by the cities. The variations between IDEB and GOALS are positive in almost all cases, a sign of gradual evolution, constant and continuous, begun in 2007. In 2011 and 2013, São Caetano has presented the highest positive variations.
São Bernardo do Campo and Diadema have presented the highest growth between 2007 and 2013, 0.9 points. Ribeirão Pires in 2007 and 2009, and São Caetano in 2013 showed the highest positive absolute variations. The highest average in 2013 was of São Caetano do Sul (6.6).
Chart 02 shows the data of IDEB observed of fifths years -- Elementary Education I (state):
State Level: Fund. I - Fifths years – IDEB OBSERVED
GOAL (Inep) VARIATION (IDEB X GOAL) Municipality 2007 2009 2011 2013 2007 2009 2011 2013 2007 2009 2011 2013 Santo André 4.9 5.5 5.8 6.0 5.1 5.4 5.8 6.0 - 0.2 0.1 0 0 São Bernardo - - - -São Caetano - - - -Diadema 5.0 5.2 5.4 5.9 4.8 5.2 5.6 5.8 0.2 0 - 0.2 0.1 Mauá 4.8 5.4 5.6 6.0 4.8 5.1 5.5 5.7 0 0.3 0.1 0.3 Ribeirão Pires 4.9 5.6 6 6.2 5.1 5.4 5.8 6.1 - 0.2 0.2 0.2 0.1 Rio Grande 4.3 4.8 5.2 5.2 4.3 4.6 5.0 5.3 0 0.2 0.2 - 0.1 Chart 02: IDEB observed of fifths years -- Elementary Education I (state)
The data of IDEB observed in Elementary Education I, in the state sphere, are quite similar to those of the municipal sphere, with growth in scores and monitoring close to the goals established by Inep. The majority of cities had already reached or exceeded those goals. The variations between IDEB and GOALS are positive in almost all cases, showing an evolution in the indicator. Maua in 2009 and 2013, Ribeirão Pires and Rio Grande da Serra, in 2011, had the highest positive variations. The cities of Ribeirão Pires, Mauá and Santo André showed high growth rates between 2007 and 2013, respectively, 1.3, 1.2 and 1.1. Ribeirão Pires had the best score in 2009, 2011 and 2013.
The Charts 03 and 04 highlight the understanding about the IDEB of each municipality, showing the indicator observed in each city, the goal projected for the 9th years of municipal and state education network and the absolute variation (IDEB X GOAL) starting in 2007 until 2013.
Municipal Sphere: Fund. II - Ninth years -- IDEB OBSERVED
GOAL (Inep) VARIATION (IDEB X GOAL) Municipality 2007 2009 2011 2013 2007 2009 2011 2013 2007 2009 2011 2013 Santo André - - - -São Bernardo - - - -São Caetano - 5.7 5.2 5.3 - - 5.9 6.1 - - - 0.7 - 0.8 Diadema - - - -Mauá - - - -Ribeirão Pires 4.8 5.3 5.4 5.4 4.9 5.0 5.3 5.7 - 0.1 0.3 0.1 - 0.3 Rio Grande - - -
-Chart 03: IDEB observed of the ninth years-- Fundamental Education II (Municipal)
* In the city of Mauá only one school participated in the IDEB 2013 and was not considered in the analysis.
Three municipalities, São Caetano, Mauá and Ribeirão Pires, performed the attendance for students in Elementary Education II in the municipal sphere. In 2013, year of the last admeasurement, the cities were, or advanced or, remained stable in the IDEB. Nevertheless, both cities analyzed had negative variation between the observed and the goal of 2013, and São Caetano presented the worst variation (0.8 negative).
Chart 04:
State Level: Fund. II - Ninth years -- IDEB OBSERVED
GOAL (Inep) VARIATION (IDEB X GOAL) Municipality 2007 2009 2011 2013 2007 2009 2011 2013 2007 2009 2011 2013 Santo André 4.2 4.5 4.2 4.2 4.2 4.3 4.6 5.0 0 0.2 - 0.4 - 0.8 São Bernardo 4.2 4.4 4.3 4.5 4.3 4.4 4.7 5.1 - 0.1 0 - 0.4 - 0.6 São Caetano 4.6 4.5 4.7 4.9 4.5 4.7 4.9 5.3 0.1 - 0.2 - 0.2 - 0.4 Diadema 3.8 4.1 4.2 4.5 3.9 4.0 4.3 4.7 - 0.1 0.1 - 0.1 - 0.2 Mauá 4.1 4.2 4.4 4.4 4.1 4.2 4.5 4.9 0 0 - 0.1 - 0.5 Ribeirão Pires 4.3 4.7 4.6 4.8 4.2 4.3 4.6 5.0 0.1 0.4 0 - 0.2 Rio Grande 3.9 4.1 4.2 4.2 4.0 4.2 4.5 4.8 - 0.1 - 0.1 - 0.3 - 0.6 Chart 04: IDEB observed of the ninth years -- Fundamental Education II (State)
In the Elementary Education II, state sphere, the municipalities, or kept themselves with the same result of 2011 or, have increased 0.2 or 0.3 points in 2013. Such situation, despite indicating some progress in the IDEB, must be analyzed with caution, since in 2013 all cities had negative variation between indicator and goal, signaling an alert situation in this sphere of teaching level. This indicates that none of the municipalities has fulfilled the goal established by Inep.
Analyzing the municipalities, their respective indices, goals and variations it can be observed that in Santo André, EFI municipal and of state, the IDEB has been showing constant evolution. In the case of state schools, this segment also showed evolution starting from the score 5.1 in 2007 and reaching 6.0 in 2013. The
situation of the EFII is different. In spite of the indicator being practically constant, in 2013, was observed a large number of schools below the individual goal. In this city, the EFI indicators, municipal and state, have showed constant tendency of growth, while those of the EFII remained stagnant.
In São Bernardo do Campo, EFI indicators showed gradual growth, constant and bigger than the projection indicated by Inep. However, EFII, despite a small growth rate, between 2007 and 2013, the IDEB was lesser than the projection and remained almost stagnated in the period.
Municipal and state schools of Elementary Education I and II have presented evolution in the indicator in different percentages in the city of São Caetano do Sul. The municipal EFI showed gradual and constant evolution went from 5.9 in 2007 to 6.6 in 2013, the greatest growth. The municipal EFII declined from 2009 to 2011 and growth in 2013, whereas those of state, showed an increase of 0.4 points (4.5 to 4.9) in the same period. In São Caetano, the EFI indicators have progressed more than those of the EF II.
In Diadema, in Elementary Education I and II, the IDEB has been showing gradual and constant evolution over the years. The average of the EFI municipal went from 5.0 in 2007 to 5.9 in 2013. In the state sphere, of the same segment, the evolution went from 4.8 to 5.9. In the EFII, numbers also have evolved: from 3.8 (2007) to 4.5 (2013). The indicators, EFI and EFII have showed the IDEB of 2013 very close to the goal established by INEP and, with advances.
The city of Mauá, in the EFI, presented gradual evolution, steady and progressive, starting from an average of 4.8 in 2007, reaching 6.0 in 2013. The EFII, on the other hand, despite a small progress between 2007 and 2011, remained without elevations of averages, being stagnated from 2011 until 2013.
In Ribeirão Pires the evolution of EFI, in both spheres, was gradual, steady and progressive. The EFII, despite being below the goal projected for 2013, presented evolution during the period from 2007 to 2013 on both educational networks, municipal and state.
Lastly, the municipality of Rio Grande da Serra, in both segments, EFI and EFII presented evolution on the indicator with different percentages. The EFI had a gradual, continuous and progressive improvement, except in 2013. In the EFII, on the other hand, the increase was smaller (0.3 points).
What can be inferred of these data, in general, is that the EFI, municipal and state, throughout the São Paulo ABC region, features gradual, constant and continuous growth. What does not happen with the EFII, where development has been very small or has remained stagnant and well below the target set by Inep.
Proportion of students and appropriate learning
The collected data allowed to position the municipalities regarding the proportion of students with proper learning in the competence of reading, text interpretation and problem solving, both in the fifths as in the ninth year of municipal and state education networks. Chart 05 shows the results of the seven municipalities studied in the state sphere:
Municipality Municipal Sphere 5th year 9th year P (%) M (%) P (%) M (%) 2009 2011 2013 2009 2011 2013 2009 2011 2013 2009 2011 2013 Santo André 40 49 53 37 41 43 - - - - -São Bernardo 50 54 59 49 49 52 - - - -São Caetano 63 75 76 62 70 78 71 71 65 58 49 49 Diadema 39 45 56 37 38 50 - - - -Mauá 27 40 - 21 34 - 15 17 - 1.0 4.0 - Ribeirão Pires 59 56 68 59 55 60 52 49 47 21 31 33 Rio Grande - - -
-Chart 05: Proportion of students who have learned properly the competence of reading, text interpretation and the competence of problem solving, of the 5th and 9th years of municipal network.
* In the city of Mauá only one school participated in the IDEB 2013 and was not considered in the analysis.
Data in chart 05 have showed, of the fifths years, in the competences of reading, text interpretation and in the problem solving, that all municipalities have improved their results. In most cases, the proportion of students who have learned properly in both competences is higher than 50%.
In the ninth year, however, there was a decrease in the municipality of São Caetano do Sul, between 2009 and 2013, in the proportion of students who have learned properly the competence of reading, text interpretation and in the competence of problem solving.
Chart 06 summarizes the results of the seven municipalities studied in the state sphere:
Municipality State Level
5th year 9th year P (%) M (%) P (%) M (%) 2009 2011 2013 2009 2011 2013 2009 2011 2013 2009 2011 2013 Santo André 45 49 55 44 48 53 31 26 26 13 12 12 São Bernardo - - - 30 28 31 14 14 14 São Caetano - - - 39 39 40 20 18 20 Diadema 44 50 61 44 47 57 25 24 28 09 09 12 Mauá 41 47 56 42 46 57 25 26 26 09 10 11 Ribeirão Pires 44 53 59 47 54 59 30 28 31 15 13 15 Rio Grande 27 37 43 27 39 35 21 21 22 10 11 10
Chart 06: Proportion of students who have learned properly the competence of reading, text interpretation and the competence of problem solving, of the 5th and 9th years of state network.
Data in Chart 06 have showed that in the fifths years, in the competences of reading, text interpretation and problem solving, all municipalities showed improvement in their performance. For the majority of cities, their students have learned properly both competences. In the ninth years, however, the situation is poor for both competences, being much worse in the competence of problem solving.
In the competence of problem solving, in the ninth years of state school, the adequate learning did not exceeded 20%, being the majority of cities below 15%. The proportion of students of the 9th years that has learned properly is stagnant or
increasing very little.
In relation to Brazil, data from the latest evaluation, 2013, have showed that 45.1% of students finish the EFI with the appropriate learning in Portuguese (40% in 2011). In Mathematics, only 39.5% of students have learned properly (36.3% in 2011). In the EFII, the percentage of students with appropriate learning is much smaller: 28.7% in Portuguese (27% in 2011) and Mathematics: 16.4% (16.9% in 2011). In the case of Mathematics, this rate has dropped even more in 2013 (11.3%).
Analysis of data in the perspective of school directors
To understand some of the data in this study, for example those that have demonstrated the lack of continuity of positive results from the EFI to the EFII, it is necessary to consider, according to the directors interviewed, a number of things. Regarding the EFI, directors have stated that only a few teachers are involved in the training of students and that, in addition, have time for a more personalized treatment, with the concerns more focused on students, in addition to developing classes that are more practical. As for the EFII, the number of teachers involved with the same students is bigger (most of the time, eight), what fragments the pedagogical action, leaving the focus more on the contents, individual work and memorization. As states a director from the city of Santo André “in Elementary Education I everything, everything is incredible, but everything is easier; we have less teachers and they are closer, you know, near the students” (DIRECTOR 2). Furthermore, says other director, “in Elementary Education I, teachers spend more time with the students, classes do not have those 50 minutes, and this is very good for the students, and makes a difference in what they learn” (DIRECTOR 6). To another principal (DIRECTOR 13), “in Elementary Education II and in High School the teachers only want to know about their contents, each one gives their class and goes away”.
As stated by Krasilchik (2005), Science classes, for example, from the first to the fifth year, are very different from those that occur from the sixth year, when start to grow the concerns and demands related to the educational content. In the same sense, many studies have already signaled that this concern more related to content, academic culture, is justified by the initial education (academic) of these teachers. Initial training for this segment was, for a long time, reduced, simplified and mainly focused on the contents, generating consequences for teaching (BIZZO, 2005).
Another question, according with the directors, relates to the lack of concern of schools with the passage of the student from EFI to EFII. Usually, the student reaches the EFII, often at the same school, without receiving guidance on how the processes will occur. This passage entails in several difficulties for students who face the new reality with different ways of relating with teachers and with the school contents. The teachers of the EFII do not always use the most appropriate strategies to work with students in school routine.
In the words of a municipal network director of São Caetano do Sul:
The schools often do not consider this change of the student’s passage from a degree to another. Many teachers ignore this passage, and is the student who has to adapt to new tasks. Here we do a job of student orientation, but
many teachers resist, they want to start sooner with the contents and leave students free. But what happens?... The child is not accustomed to lessons of so many minutes, plus homework assignments and everything else. Many, in the beginning, suffer and sometimes, they go talk with the former teachers. (DIRECTOR 8)
It was frequent, in the testimonies of directors, the signage that students encounter difficulties in this passage, because they are accustomed to a working dynamics with the same teacher and studying disciplines without time divisions. It is, therefore, another type of organization of time, teachers and disciplines. This situation interferes in the pace of student learning. In the fifth year, changes still happen in the ways of assessing the students. The language is different, and due to the greater amount of exercises, time becomes more restrict (FACCI; KURODA; MENDES, 2008). All of this brings changes and consequences for students.
More than 80% of directors signaled that it should also be considered that in the EFII the curricula are more “stuffed” with contents, being many topics far from the student reality, leaving him with the option of memorization to learn. This situation prevents the teacher to act more openly, leveraging the world representations that students bring to the classroom for the construction of knowledge (PERRENOUD, 2000). As indicated by a director, “many teachers complain that they need more classes to give the entire content” (DIRECTOR 12).
In general, directors have pointed out that teachers’ expectations over the students of EFII are also different and interfere in the process, as these expectations come from teachers of distinct disciplines and reveal a different view on the educational phenomenon. It is common, but it is not a rule, that every teacher keeps the focus on his discipline without considering the whole.
In the EFII there is also situations in which, often, teachers give lessons in more than one institution, what does not make possible the creation of solid ties with the school. This has several consequences. Generally, the working hours are distributed in different schools, which means that teachers have to travel, sometimes long distances in order to handle their responsibilities. As has signaled one director, “when we talked about school’s pedagogy, the projects in meetings outside office hours or in the pedagogical meetings (HTPC) many teachers do not participate because they give lessons in another school” (DIRECTOR 8).
Gonçalves (2005) asserts that there is today intense rotation in the work places, since many teachers have to work on two or three schools. Garcia (2010, p.58) points out that the “turnover caused by the high working hours of those teachers hampers the creation of identity links with the schools, making it impossible, therefore, the construction and development of innovation projects”. The author also points out some implications of this process. The teacher “knows less about his students, participates less in the activities of school, engages less in the innovations of institution and, when he does, has less time to participate” (p.58).
Lastly, directors, almost all of them, signaled that the job of managers, including directors, coordinators and educational guidance counselors is different and more difficult in EFII. The most common explanations for this fact are related to the characteristics of EFII, the difficulty of changing the posture of teachers from this segment and, above all, the question of student monitoring. The directors have indicated that this process of monitoring young people is more intense and shared by teachers in the EFI; students are monitored more closely and more often.
Final considerations
This study showed the situation of IDEB in one of the most important regions of Brazil. It has also presented the particularities of IDEB in Elementary Education I and in Elementary Education II, in the municipalities of São Paulo’s ABC region, in the state and municipal sphere, allowing experts and school managers to better understand the teaching in the region, carry out analyzes and build more particularized actions to improve education.
One of the important findings of this study is related with to the comprehension of the best results of EFI in comparison with those of EFII. It was obtained analyzing the development of schools from seven municipalities, the data of IDEB, the goals established by INEP and the proportions of students who have learned properly the competences of reading and interpretation and the one of problem solving.
The quality indices in the EFI, of this region, have increased gradually and continuously, demonstrating significant progress at this educational level. This did not occur, however, in the EFII, segment where schools reached less the goals established by Inep, in the spheres individual, municipal and the Brazil goal 2021. The variations between the IDEB noted and established, were negative in most cases and the proportion of students who have learned properly is small, especially in the competence of problem solving.
In this sense, one of the biggest problems of Brazil - the fact that only 11.3% of students learn mathematics adequately in ninth years (Monitoring report of goals from the All for Education, 2013-14) - also from the ABC region, with the aggravating that this is one of the most advanced regions socioeconomically.
The results of this study revealed the harsh reality of the region in EFII. However, these data were found also in other regions and states in Brazil. As have signaled Roitman and Mozart (2001), there are visible advances in early years of Elementary Education, but the same has not occurred in final years, where is notorious the stagnation of results, including the issue of students percentage who have learned properly. The authors claim as well that such stagnation means backtracking (p.30). Another important contribution of this study is related to data contextualization, made based on perspectives and references of school directors from this region. For them, the lack of continuity of positive results from the EFI to the EFII is attributed to the characteristics of each segment, as the number of teachers, the type of treatment given to the students, the teaching methods used, the references shared and accepted (school culture). In the EFII, for example, are strong the content appreciation, the school organization, the effect of the student passage from fifth to sixth year, the system organization, which allows the phenomenon of rotation, and the influence of school management, whose process of student monitoring is more intense in the EFI than in the EFII.
From the results of this study, the research can advance through projects focused on strengthening strategies to improve the teaching quality in the schools of the ABC region and, consequently, the results of the IDEB in EFII. A task that remains open for future studies.
References
BARBOSA, M. E. F.; FERNANDES, C. A escola brasileira faz diferença? Uma investigação dos efeitos da escola na proficiência em matemática dos alunos da 4ª série. In: FRANCO, C. (Org.). Avaliação, ciclos e promoção na educação. Porto Alegre: Artmed, 2001. p. 121-153.
BIONDI, R. L.; FELÍCIO, F. Atributos escolares e o desempenho dos estudantes: uma análise em Painel dos Dados do SAEB. Brasília: INEP, 2007.
BIZZO, N. Formação de professores de ciências no Brasil: uma cronologia de improvisos. Ciência e Cidadania: SEMINÁRIO INTERNACIONAL CIÊNCIA DE QUALIDADE PARA TODOS. 2005, p.127-148.
BIZZO, N. Ciências: fácil ou difícil? São Paulo: Ed. Biruta, 2009.
BRASIL. Decreto nº 6.094, 24 de abril de 2007. Available at: http://www.planalto.gov.br/ccivil_03/_ato2007-2010/2007/decreto/d6094.htm. Accessed on: 7 February 2013.
BRASIL. Lei de Diretrizes e Bases da Educação Nacional (9.394), 20 de dezembro de 1996. Available at: http://www.presidencia.gov.br/ccivill_03/leis/l9394.htm. Accessed on 21 April 2012.
BRASIL. Constituição Federal do Brasil, 1988. Presidência da República. Available at: http://www.planalto. gov.br/ccivil_03/constituicao/constituicao.htm. Accessed on 21 April 2013.
BRASIL. Censo Escolar 2013. Available at: http://portal.inep.gov.br/basica-censo. Accessed on: 12 August 2013.
CORBIN, J.; STRAUSS, A. Basics of qualitative research: techniques and procedures for developing grounded theory. 2 ed. London: Sage Publications, 1998.
FACCI, M. G. D.; MENDES, A. S.; KERODA, M. S. A difícil transição da quarta a quinta série: alguns apontamentos a partir da Psicologia Histórico-Cultural. Mathesis, Jandaia do Sul, v. 9, p. 43-60, 2008.
GARCIA, P. S. Inovações e mudanças: por que elas não acontecem nas escolas? Uma macroanálise envolvendo professores de ciências. 1. ed. São Paulo: LCTE Editora, 2010. 160p.
GARCIA, P. S. Reflexos das políticas educacionais para professores da educação básica. Cuadernos de Educa-ción y Desarrollo, v. 1, p. 1-14, 2014.
GARCIA, P. S. Escolas eficazes: um estudo sobre os fatores que impactam o desempenho dos alunos na perspectiva das famílias, diretores, professores e alunos de escolas de Ensino Médio. Relatório de pós-doutorado. Facul-dade de Educação da UniversiFacul-dade de São Paulo, 2015.
GONÇALVES, M. H. O. As Reformas Educacionais e o choque de Gestão: a precarização do trabalho docente. 28º REUNIÃO ANUAL DA ANPED, Anais, 2005.
INSTITUTO BRASILEIRO DE GEOGRAFIA E ESTATÍSTICA (IBGE). Available at: http://www.cidades.ibge. gov.br/painel/populacao.php?lang=&codmun=354880&search=sao-paulo|sao-caetano-do-sul|infograficos:-evolucao-populacional-e-piramide-etaria. Accessed on: 23 April 2013.
KRASILCHIK. M. Palestra ministrada no programa de doutoramento da Faculdade de Educação da USP. Disciplina de Metodologia do Ensino Superior. 2005.
MENEZES FILHO, N. Os determinantes do desempenho escolar do Brasil. São Paulo: Instituto Futuro Brasil/IBMEC, 2007.
OBSERVATÓRIO DA EDUCAÇÃO DO GRANDE ABC. Relatório do primeiro trimestre. Universidade Muni-cipal de São Caetano do Sul. 2015. Pesquisa Nacional por Amostra de Domicílios (PNAD). Síntese dos indicadores. Available at: http://www.ibge.gov.br/home/estatistica/populacao/trabalhoerendimento/pnad2013/. Accessed on: 18 February 2014.
PERRENOUD, P. Dez novas competências para ensinar. Porto Alegre: Artmed Editora, 2000. ROITMAN, I., RAMOS, M. N. A urgência da educação. São Paulo: Editora Moderna, 2011.
RONCA, A. C. C. Avaliação da educação básica. Seus limites e possibilidades. Retratos da Escola, Brasília, v. 7, n. 12, p. 77-86, 2013.
RUTTER, M. Fifteen thousand hours: secondary schools and their effects on children. Cambridge: Harvard University Press, 1979.
SOARES, J. F.; XAVIER, F. P. Pressupostos educacionais e estatísticos do IDEB. Educ. Soc., Campinas, v. 34, n. 124, p. 903-923, 2013.
TODOS PELA EDUCAÇÃO. De olho nas metas: Relatório de Monitoramento das Metas do Todos Pela Educa-ção, 2010.
VIDAL, E. M.; VIEIRA, S. L. Gestão educacional e resultados no Ideb: um estudo de caso em dez municípios cearenses. Est. Aval. Educ. São Paulo, v. 22, n. 50, p. 419-434, 2011.