Kinetics of Vacancy Doping in SrTiO
3Studied by
in situ
Electrical Resistivity
Felipe Souza Oliveiraa* , Ana Carolina Faveroa, Sergio Tuan Renostoa, Mário Sérgio da Luza,b,
Carlos Alberto Moreira dos Santosa
Received: September 29, 2017; Revised: February 08, 2018; Accepted: March 20, 2018
The kinetics of annealing to transform stoichiometric SrTiO3 insulator into a vacancy-doped semiconductor-superconductor was revisited by in situ electrical resistivity measurements. SrTiO3 single crystals were grown by Floating Zone Method. Using a homemade apparatus several electrical
resistivity as a function of time were measured at different temperatures, which allows one to study the
creation of vacancies during annealing under vacuum. The activation energy for the oxygen vacancies formation/charge doping in SrTiO3 was estimated as 1.4±0.3 eV using solid-state kinetics approach.
Keywords: strontium titanate, crystal growth, solid-state kinetics.
*e-mail: [email protected]
1. Introduction
Strontium titanate (SrTiO3) is one of the most studied cubic perovskites due to the fascinating physical properties1-4.
This compound exhibits structural cubic to tetragonal transition at 105 K with a ferroelectric order simultaneous to antiferrodistorsive transition order5. The interplay between
these distortions has been focus of many studies6-8.
During last five decades, much attention has been given
to the electronic transport mechanisms in doped SrTiO3. This is special due to the anomalous superconductivity within a limited doping window9-11 in the vicinity of a ferroelectric
transition12.
Stoichiometric SrTiO3 is an insulator with 3.2 eV band gap, but one can introduce electron donor states by replacing Ti4+ by Nb+513 or Sr2+ by La3+ like a n-type silicon based
semiconductor14 either oxygen can be removed with heat
treatment in vacuum at high temperatures in order to reach SrTiO3-δ vacancy self-doped semiconductors15. It is known
that oxygen vacancies remain double ionized in quenched samples after annealing under vacuum, therefore, two free-electrons became available for each oxygen removed from the crystal lattice after the reduction process16.
Several authors have studied the vacancy doping of SrTiO3
in form of single crystals, thin films or ceramics17-20. Some of
these authors have shown chemical diffusion coefficients for
the SrTiO3 crystal lattice using the Neumann solution of the Fick's second law carried out by in situ transient electrical resistivity measurements18-20. Additionally, in this paper
we report that the solid-state kinetic models reviewed by Khawam and Flanagan21 can describe the in situ electrical
resistivity measurements as a function of time, which allows us to determine the energy involved in oxygen removal process from the SrTiO3.
Thus, this paper deals with the SrTiO3 single crystals grown by Floating Zone Method22. The reported data show
that the self-doping in SrTiO3-δ is well described by a first order mechanism with an activation energy of 1.4±0.3 eV to produce oxygen vacancies, which is comparable to the recent data available on literature23.
2. Experimental Procedures
2.1 Crystal growth and samples quality
Polycrystalline SrTiO3 phase was synthetized from mixed SrCO3 and TiO2 powders with 99.9% purity (Sigma-Aldrich
reagents). Precursor powders were mixed in liquid acetone under magnetic stirring. The resultant mixture was dried and then calcined in air at 1200ºC for 24 hours. X-ray powder
diffractometry technique with CuKα radiation and Ni filter
using PanAnalytical Empirian diffractometer was employed
to verify the phases present in the samples. Due to the heavier
mass, the impurities have lower diffusion compared to oxygen
atoms. Therefore, in this work we suppose that the sample impurities contents do not chance during the heat treatment and are not responsible for the electrical resistance change. aEscola de Engenharia de Lorena, Universidade de São Paulo, 12602-810, Lorena, SP, Brasil
bInstituto de Ciências Tecnológicas e Exatas, Universidade Federal do Triângulo Mineiro, 38025-180,
In order to grow single crystals of SrTiO3 using the Floating Zone Method22, polycrystalline powder was sealed
in cylindrical rubbers and hydrostatically compressed into rods with 5 to 6 mm in diameter and 70 to 130 mm in length. The polycrystalline feed rods were sintered in air at 1300ºC for 12 hours in which 80 to 90% of theoretical density was obtained.
Floating Zone Method consists in directional solidification
of a polycrystalline feed rod casted by concentrated radiation emitted from bulb lamps at the focus of concave ellipsoid mirrors. The desired single crystal grows by controlled solidifying of molten above the single crystal used as a seed while both are pulling downward from heating zone24.
Our single crystals were grown at normal atmosphere using 8 mm/h growth rate, 35 rpm in clockwise, and 5 rpm in counterclockwise rotations for feed rod and seed. The
Quantum Design Infrared Image Furnace used here has two bulb lamps with 650 W maximum power in each concave mirrors, one facing another. At least, 95% of the power lamp was required to achieve 2040ºC in order to melt the SrTiO3 rods25.
Obtained SrTiO3 single crystals are transparent with light yellow color or brown color. It is well known that oxygen
content and stoichiometry deviations can affect the color
of single crystals26. In in this sense, eventual evaporations
during crystal growth should explain the differences observed
in the coloration of samples produced here.
After the growing, circular wafers were cut from single crystal bars with an IsoMet cutting machine. Rectangular shapes with 1 mm in thickness were also cut for in situ
electrical resistivity measurements from the same single
crystal rod. The X-ray diffraction on single crystals surface
was measured in texture analysis Philips X'Pert with CuKα
radiation and Ni filter to determine the preferential orientation
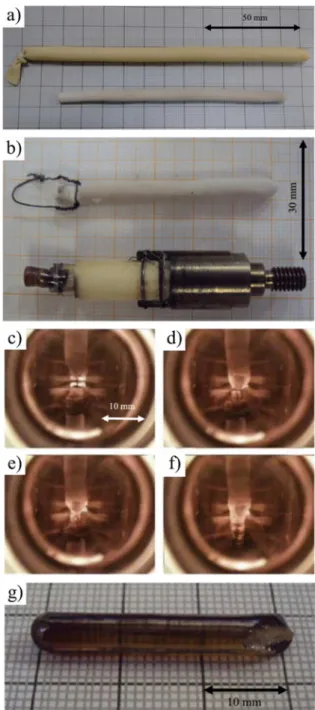
of the obtained samples. Figure 1 shows some pictures of sample preparation procedures.
2.2 In situ electrical resistivity measurements
Single crystals in rectangular blocks with the longest side parallel to the growth axis were used to study the kinetics of oxygen removal process by in situ electrical resistivity measurements.
For the electrical resistivity measurements, a sample holder was constructed with an alumina tube. Four platinum wires were connected to the sample with special epoxy, and the sample holder has a thermocouple with its tip installed near the specimen. The sample holder part is involved by a quartz tube and introduced inside of a heated stainless-steel enclosure continuously evacuated at 10-5 Torr by a
turbo-mechanic vacuum pump. Software developed in Matlab
programing language acquires the electrical resistance of the sample by standard four-probe method using Keithley
Figure 1. a) SrTiO3 powder inside rubber mold (up) and SrTiO3 feed rod after compressed and sintered (down). b) Single crystal as seed is connected to the Floating Zone furnace holder (up) and SrTiO3 feed rood prepared for crystal growth process (down). In the pictures (c) to (f) one can see: c) feed rod (up) and seed (down) before feed rod melting; d) feed rod tip melted at hot zone; e) tip melted joined on the single-crystalline seed; and f) both feed rod and seed are pulling down with crystal growing below the hot zone. In (g) in shown a typical SrTiO3 single crystal rod after the crystal growth.
3. Results and Discussion
Figure 2 shows the X-ray diffraction (XRD) pattern for the
SrTiO3 polycrystalline powder and the structural refinement by GSAS program27. One can observe good agreement between
experimental and refined patterns28, which confirms SrTiO 3
single phase with lattice parameter a = 3.905 Å and Pm-3m space group2,25. The goodness refinement indices are: R
exp =
4.39%; Rp = 6.42%; Rwp = 7.76% and χ2 = 3.12.
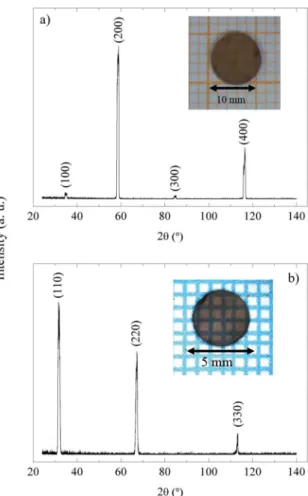
Figure 2. XRD pattern of SrTiO3 powder synthetized by standard ceramic route.
The results of preferential orientation in single crystals are shown in Figure 3. Figure 3a shows that the surface on
the disk shape samples has only diffraction patterns of the
{100} family planes. This is an indicative of preferential growth axis parallel with [100] crystallographic orientation. On the other hand, one of the single crystals samples grew with [110] direction (see Figure 3b).
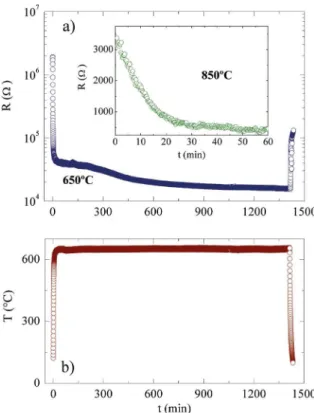
Figure 4 shows the evolution in electrical resistivity of a sample during thermal annealing at 650ºC under a vacuum of 10-5 Torr. One can observe four regimes in Figure 4: i)
a fast warming up to the temperature of the measurement, in which there is a decreasing of the electrical resistivity due to insulator behavior of the stoichiometric SrTiO3; ii) a plateau up to 200 to 300 min depending on the annealing temperature; iii) a regime of stable temperature longer than 1200 minutes in which the oxygen removal occurs; and iv) a fast cooling down to room temperature. The behavior in the cooling regime indicates that under these experimental conditions used here, the amount of oxygen atoms removed from the samples was not high enough to produce metallic samples, such as reported before by other authors29.
The equilibrium degree α during oxygen removal process at constant temperature regime can be written in terms of electrical conductivity by18,20,21:
Figure 3. XRD of the single crystal surface with: a) [100] preferential orientation and b) [110] preferential orientation. The insets show the analyzed samples.
(1)
where σ is electrical conductivity (1/ρ) at elapsed time
t, σ0 is the electrical conductivity at initial condition (α ≈ 0) and σ∞ is the electrical conductivity when a new equilibrium is achieved (α ≈ 1).
In solid-state kinetic formalism, the evolution in the equilibrium degree can be expressed by a linear form allowed by some g(α) model-function21:
(2)
where the reaction rate constant k, is temperature dependent and given by:
(3)
,
0 0
a
v
v
v
v
=
-
-3
g
Q V
a
=
kt
,
exp
k
A
k T
E
B
Figure 4. a) Evolution of the electrical resistivity of a SrTiO3 single crystal as a function of time during annealing under vacuum of 10-5 Torr. In (b) is shown the temperature during the annealing. The Inset displays the acquired data at 850°C setting the initial time just after the plateau mentioned in the text.
where A represents the frequency reaction factor, E is the activation energy of the process, kB is the Boltzmann constant, and T is the absolute temperature. The first-order reaction
model reviewed in reference21 fits better our experimental
data. It is implies:
(4)
providing:
(5)
The results for two equilibrium temperatures are shown
in Figure 5. The solid lines show the best fit for the obtained
data in this work.
From the fit of the function expressed by equation 5 or
from the slope of lines shown in insets of the Figure 5 (a) and (b), one can obtain the Arrhenius kinetic factor (k) at the analyzed temperature. The values are (3.7 ± 0.7) 10-3 min-1
and (8.6 ± 0.1) 10-2 min-1 for 650°C and 850°C, respectively.
In such way, the activation energy value for the charge doping through oxygen removal process in SrTiO3 can be estimated as 1.4±0.3 eV using equation 3.
Figure 5. Equilibrium degree evolution calculated by equation (1) at isothermal temperatures of 650ºC (a) and 850ºC (b) under vacuum of 10-5 Torr. The initial time was set up at the starting point where the annealing temperature becomes stable, such as observed
in Figure 4 (a). The insets show the linear model − ln (1 − α) = kt due to the first-order kinetics for the oxygen removal process. The lines are the fitted models.
This activation energy is based upon the evolution of the equilibrium degree observed in the electrical resistivity during the annealing in vacuum at constant temperature, which can be related to possible three mechanisms: i) the formation of vacancies; ii) the oxygen self-diffusion; and iii)
the oxygen desorption from the sample surface. A recently mechanism has been predicted theoretically in which easy
diffusion path such as oxygen dislocations in SrTiO3 has
impact on resistive switch applications30.
Within the standard deviation, our data is in good agreement with the recent value reported by Zhu et al. (1.0 eV), where
a first-order kinetic model also fits their experimental data
for in situ optical properties measurements23.
Other similar energy values can be found on literature,
however they are based upon oxygen diffusion models18.
Some of these results are based upon similar electrical measurements reported here, but the authors attribute
the influence on the electrical conductivity to the oxygen diffusion18,20 or possible easy diffusion path such as oxygen
dislocations31 instead charge doping reaction as stressed out
in this report.
,
ln
g
Q
a
V
=-
Q
1
-
a
V
.
e
1
kt-4. Conclusions
In situ electrical resistivity measurements during reduction annealing under vacuum in SrTiO3 single crystals grown by Floating Zone Method were well described by the general
solid-state kinetics approach as a first-order mechanism
providing information on the oxygen vacancies/charge doping formation. Additionally, this allowed us to determine the activation energy for the formation of oxygen vacancies as 1.4±0.3 eV. This result is in good agreement with the data reported on literature within the experimental deviation.
5. Acknowledgements
F. S. Oliveira thanks to C. I. Forinari and Dr. E. Abramof from INPE (São José dos Campos - SP) for the XRD texture measurements and thanks to B.S. de Lima for suggestions and comments. This material is based upon work supported by FAPESP (2009/54001-2, 2016/00335-0), CNPq (308162/2013-7), CAPES, FAPEMIG, and PRP-USP (NAP).
6. References
1. Rice WD, Ambwani P, Bombeck M, Thompson JD, Haugstad G, Leigton C, et al. Persistent optically induced magnetism
in oxygen-deficient strontium titanate. Nature Materials. 2014;13(5):481-487.
2. Zhang J, Xie K, Wei H, Qin Q, Qi W, Yang L, et al. In situ formation of oxygen vacancy in perovskite Sr0.95Ti0.8Nb0.1M0.1O3
(M = Mn, Cr) toward efficient carbon dioxide electrolysis. Scientific Reports. 2014;4:7082.
3. Shang PP, Zhang BP, Liu Y, Li JF, Zhu HM. Preparation and Thermoelectric Properties of La-Doped SrTiO3 Ceramics.
Journal of Electronic Materials. 2011;40(5):926-931.
4. Trabelsi H, Bejar M, Dhahri E, Sajieddine M, Valente MA,
Zaoui A. Effect of the oxygen deficiencies creation on the
suppression of the diamagnetic behavior of SrTiO3 compound.
Journal of Alloys and Compounds. 2016;680:560-564.
5. de Lima BS, da Luz MS, Oliveira FS, Alves LMS, dos Santos CAM, Jomard F, et al. Interplay between antiferrodistortive, ferroelectric, and superconducting instabilities in Sr1-xCaxTiO3-δ.
Physical Review B. 2015;91(4):045108.
6. Zhong W, Vanderbilt D. Effect of quantum fluctuations on
structural phase transitions in SrTiO3 and BaTiO3. Physical
Review B. 1996;53(9):5047-5050.
7. Loetzsch R, Lübcke A, Uschmann I, Förster E, Große V, Thuerk M, et al. The cubic to tetragonal phase transition in SrTiO3 single crystals near its surface under internal and external strains. Applied Physics Letters. 2010;96(7):071901.
8. Salje EKH, Gallardo MC, Jiménez J, Romero FJ, del Cerro J. The cubic-tetragonal phase transition in strontium titanate:
excess specific heat measurements and evidence for a near-tricritical, mean field type transition mechanism. Journal of Physics: Condensed Matter. 1998;10(25):5535-5543.
9. Lin X, Bridoux G, Gourgout A, Seyfarth G, Krämer S, Nardone M, et al. Critical Doping for the Onset of a Two-Band Superconducting Ground State in SrTiO3-δ. Physical Review
Letters. 2014;112(20):207002.
10. Koonce CS, Cohen ML, Schooley JF, Hosler WR, Pfeiffer ER.
Superconducting Transition Temperatures of Semiconducting SrTiO3. Physical Review. 1967;163(2):380-390.
11. Schooley JF, Hosler WR, Ambler E, Becker JH, Cohen ML, Koonce CS. Dependence of the Superconducting Transition Temperature on Carrier Concentration in Semiconducting SrTiO3. Physical Review Letters. 1965;14(9):305-307.
12. Edge JM, Kedem Y, Aschauer U, Spaldin NA, Balatsky AV. Quantum Critical Origin of the Superconducting Dome in SrTiO3. Physical Review Letters. 2015;115(24):247002.
13. Liu ZQ, Lü WM, Lim SL, Qiu XP, Bao NN, Motapothula M, et al. Reversible room-temperature ferromagnetism in Nb-doped SrTiO3 single crystals. Physical Review B. 2013;87(22):220405.
14. Ohta S, Nomura T, Ohta H, Koumoto K. High-temperature carrier transport and thermoelectric properties of heavily La- or Nb-doped SrTiO3 single crystals. Journal of Applied Physics. 2005;97(3):034106.
15. Yamada H, Miller GR. Point defects in reduced strontium titanate. Journal of Solid State Chemistry. 1973;6(1):169-177.
16. Balachandran U, Eror NG. Electrical conductivity in strontium titanate. Journal of Solid State Chemistry. 1981;39(15):351-359.
17. Szot K, Speier W, Carius R, Zastrow U, Beyer W. Localized Metallic Conductivity and Self-Healing during Thermal Reduction of SrTiO3. Physical Review Letters. 2002;88(7):75508.
18. Pasierb P, Komornicki S, Rekas M. Comparison of the chemical
diffusion of undoped and Nb-doped SrTiO3. Journal of Physics
and Chemistry of Solids. 1999;60(11):1835-1844.
19. Walters LC, Grace RE. Formation of point defects in strontium titanate. Journal of Physics and Chemistry of Solids. 1967;28(2):239-244.
20. Walters LC, Grace RE. Diffusion of point defects in strontium
titanate. Journal of Physics and Chemistry of Solids. 1967;28(2):245-248.
21. Khawam A, Flanagan DR. Solid-State Kinetic Models: Basics and Mathematical Fundamentals. Journal of Physics Chemistry B. 2006;110(35):17315-17328.
22. Nabokin PI, Souptel D, Balbashov AM. Floating zone growth of high-quality SrTiO3 single crystals. Journal of the Crystal Growth. 2003;250(3-4):397-404.
23. Zhu XD, Fei YY, Lu HB, Yang GZ. Role of step edges in oxygen vacancy transport into SrTiO3(001). Applied Physics Letters. 2005;87(5):051903.
24. Koohpayeh SM, Fort D, Abell JS. The optical floating zone technique: A review of experimental procedures with special reference to oxides. Progress in Crystal Growth and Characterization of Materials. 2008;54(3-4):121-137.
26. Guguschev G, Kok DJ, Galazka Z, Detlef KD, Uecker R, Bertram
R, et al. Influence of oxygen partial pressure on SrTiO3 bulk crystal growth from non-stoichiometric melts. CrystEngComm. 2015;17(17):3224-3234.
27. Toby BH. EXPGUI, a graphical user interface for GSAS.
Journal of Applied Crystallography. 2001;34(Pt 2):210-213.
28. Toby BH. R factors in Rietveld analysis: How good is good enough? Powder Diffraction. 2006;21(1):67-70.
29. Spinelli A, Torija MA, Liu C, Jan C, Leighton C. Electronic transport in doped SrTiO3: Conduction mechanisms and potential applications. Physical Review B. 2010;81(15):155110.
30. Szot K, Speier W, Bihlmayer G, Waser R. Switching the electrical resistance of individual dislocations in single-crystalline SrTiO3.
Nature Materials. 2006;5(4):312-320.