Microstructure and Properties of Cu-ZrO
2Nanocomposites Synthesized by in Situ
Processing
Marwa Elmahdya*, Gamal Abouelmagdb, Asaad Abd Elnaeem Mazenb
Received: April 19, 2017; Revised: August 20, 2017; Accepted: September 17, 2017
In situ chemical reaction method was used to synthesize Cu-ZrO2 nanocomposite powders. The process was carried out by addition of NH4(OH) to certain amount of dispersed Cu(NO3)2·3H2O and ZrOCl2·8H2O solution. Afterwards, a thermal treatment at 650 °C for 1 h was conducted to get the powders of CuO and ZrO2 and remove the remaining liquid. The CuO was then reduced in preferential hydrogen atmosphere into copper. The powders were cold pressed at a pressure of 600 MPa and sintered in a hydrogen atmosphere at 950 °C for 2 h. The structure and characteristics were examined by X-ray
diffraction (XRD), field emission scanning electron microscopy (FESEM) and transmission electron microscopy (TEM). The results showed that the nanosized ZrO2 particles (with a diameter of about
30-50 nm) was successfully formed and dispersed within the copper matrix. The density, electrical conductivity, mechanical strength measurements (compression strength and Vickers microhardness) and wear properties of Cu-ZrO2 nanocomposite were investigated. Increment in the weight % of ZrO2
nano-particles up to 10 wt.% in the samples, caused the reduction in the densification (7.2%) and
electrical conductivity (53.8%) of the nanocomposites. The highest microhardness (146.5 HV) and compressive strength (474.5 MPa) of the nanocomposites is related to the Cu-10 wt.% ZrO2. Owing to the good interfacial bonding between uniformly dispersed ZrO2 nanoparticles and the copper matrix. The abrasive wear rate of the Cu-ZrO2 nanocomposite increased with the increasing load or sliding velocity and is always lower than that of copper at any load or any velocity.
Keywords: Cu-ZrO2 nanocomposite, In Situ chemical synthesis, Microhardness, Compressive strength, Electrical conductivity, Abrasive wear
*e-mail: [email protected].
1. Introduction
Nano-sized ceramic particles in a nanocrystalline metal matrix prepared by the in situ chemical reaction can improve the mechanical, tribological, and anti-corrosion properties of the metal1-5. In recent years nanocomposite materials have
attracted much attention owing to their improved physical and mechanical properties. The properties of such materials strongly depend on the particle size and distribution of nanoparticles in the matrix6-9.
Copper based materials are widely used where high electrical and thermal conductivities are required. Rotating source neutron targets, combustion chamber liners, the electrode of resistance welding, integrated circuit sealing materials, high voltage switches and heat exchangers are examples of copper based materials' applications. These applications require a suitable performance, e.g. high conductivity and excellent mechanical properties, at elevated temperatures and in electronic industries10-14. Pure copper,
on the other hand, suffers from low tensile strength, low
hardness and poor wear resistance10,12,15. Therefore, one of the
potential solutions for these drawbacks is the incorporation
of a reinforcement element, which results in copper matrix composite as a by-product16-18.
Oxide dispersion strengthening (ODS) is a suitable
method to improve the mechanical properties of the copper matrix composites19. Due to high interfacial energy between
the molten metal and oxide particles melting and casting techniques are not used to fabricate such composites; therefore these composites should be produced by the powder metallurgy methods. The main steps of these methods are the production of composite powder, followed by consolidation to get a bulk material.
The oxide dispersoids can be added into the copper matrix by ex-situ method or in-situ method. The shortcoming of ex-situ method is that nano-sized oxide dispersoids can be homogeneously dispersed in the copper matrix20. Meanwhile,
the bonding between the particles and the copper matrix is poor. In contrast, dispersion strengthened copper alloys can be produced by various in-situ processing methods with a homogeneous structure, such as internal oxidation, reactive spray deposition and reaction synthesis, etc20-22.
Nowadays, it is well known that by proper reinforcement selection, better properties for MMCs could be produced.
aMechanical Department, Higher Technological Institute, 10th Of Ramadan City, P.O. Box 228, Sharqia, Egypt
Considering this comment, a variety of particulate ceramic materials like Al2O32,6,8,14-16,19-22, SiC12,13, and TiB
2
18 have been
utilized to reinforce the copper matrix. The usage of above reinforcements has led to the enhancement of mechanical properties, which have been reported by researchers cited
above. Among these, however, fine stabilized ZrO2 ceramic
particles could be a proper reinforcing material due to their
high strength and stiffness, high melting temperature, and
relatively good electrical property23.
Few studies have been published about strengthening copper
using zirconia particles by the method of the in-situ chemical reaction. A Cu-ZrO2 nanocomposite has been prepared by Ding Jian24 by the in-situ chemical method, and another by Gao
Jing25 using the powder metallurgy techniques, respectively.
They studied the effect of the process parameters including the
initial pressure, the sintering temperature and sintering time, content of ZrO2 particles on the properties of the composite.
Based on the above research work, the present study aims at producing homogeneous Cu-ZrO2 composites from chemically prepared CuO-ZrO2 mixtures and investigate
the effect of ZrO2 on the crystallite size, particle size and
morphology of the obtained powder. Furthermore, their effect
on microstructure, and relative density of sintered compacted
samples were studied. Electrical conductivity, mechanical
and abrasive wear properties of resulting nanocomposites were also studied.
2. Experimental Work
Soluble nitrates of copper (II) nitrate Cu(NO3)2·3H2O, zirconium oxychloride ZrOCl2·8H2O and ammonium hydroxide NH4(OH), could be used as transient components for the in situ chemical synthesis of nanocomposite Cu-ZrO2 powders. The accomplished in situ chemical processes were adopted to prepare Cu-ZrO2 nanocomposite, as summarized in Figure 1. This process consists of four main stages:
• Making an aqueous solution of Cu(NO3)2·3H2O and ZrOCl2·8H2O; the quantities of salts were taken such that the resulting composition of the Cu-ZrO2 nanocomposite system with 2.5, 5 &10 wt. % of zirconia would be attained;
• NH4(OH), dissolved in water (28%), was added
dropwise while stirring the mixture with a magnetic stirrer for 20 min and then washed with water
repeatedly and filtered Eqn. (1);
(1)
• The filtered mixture was dried at 120 °C overnight,
and then annealed in an air atmosphere at 650 ◦C
for 1 h to obtain the composite powder of the Cu
and Zr oxides Eqn. (2);
(2)
• Reduction of thermally treated powders in a hydrogen atmosphere at a temperature of 500 °C for one hour, whereby the copper oxide was transformed into elementary copper and the ZrO2 remained
unchanged Eqn. (3).
(3)
After reduction, the powders were characterized by X-ray
diffraction (XRD) with CuKα radiation, λ= 1.5418 Å and at
36 kV and 26 mA. The X-ray data were collected in steps of 0.02◦ (2θ) with the scanning scope of 20-80◦. Evaluation
of effective sizes of coherent scattering area was carried out
in compliance with the Scherrer formula with the strongest peaks of phases analyzed. And the zirconia extracted from the Cu-ZrO2 composite powder was characterized using
transmission electron microscopy (TEM; Model JEOL JEM-2010).
Prior to sintering, the produced Cu-ZrO2 nanocomposite powders were compacted in a hydraulic press at a pressure of 600 MPa. in a steel mold to obtain cylindrical shaped specimens having 12 mm diameter and 12 mm height. The
powders were mixed with 0.5% paraffin wax as a lubricant
to reduce friction during compaction. Sintering of all the green compacts were carried out using a ceramic tubular furnace in a hydrogen atmosphere at 950 °C for 2 h and a heating rate of 10 °C /min21.
The microstructure of the prepared nanocomposites was
examined by optical microscope model Olympus PMG 3−F3, while microstructural analyses were performed using field emission scanning electron microscopy (FESEM Hitachi Figure 1. Flowchart of preparation of Cu-ZrO2 nanocomposite
powder using in situ chemical process.
Cu NO ZrOCl NH OH
H O Cu OH Zr OH
NH NO NH Cl
3
2
3 2 2 4
2 2 3
4 3 4 2
" + + + + + +
Q
Q Q QV
V V VCu OH Zr OH CuO
ZrO 2H O O
2 1 , C h 2 3 650 1
2 2 2
+ +
+ +
c
Q V Q V
S4160) and SEM fitted with EDS. True densities of the
nanocomposites were measured by using the Archimedes' method (ASTM-C20) and compared with the theoretical
densities to obtain varying degree of densification. The
theoretical densities of compacts were calculated from the simple rule of mixtures, taking the fully dense values for copper (8.96 g/cm3) and zirconia (5.68 g/cm3). The electrical
resistivity of the composite samples was measured using the two-probe using Omega micro-ohmmeter, and electrical conductivity of composite was calculated from these measurements. Vickers microhardness was performed on the polished samples under a test load of 50 gf and a dwell
time of 10 s in accordance with the ASTM standard E 92.
In order to obtain optimum results, microhardness values
were determined by taking the average of six different
measurements randomly on each sample. The Compression tests were performed over an initial strain rate of 10-4 s-1 at
room temperature using a universal testing machine model
HU−F500KN. Cylindrical specimens with a height of 12
mm and a diameter of 12 mm were used in compliance
with ASTM E9-89a standard for measuring the compressive
response of the matrix and composite materials26. Special
graphite based grease is placed between the tested specimen and the platen of the compression machine to minimize friction. The percentage reduction was maintained at 60 %. The end surfaces of the specimen were maintained as normal to the axis of specimen.
Abrasive wear tests were carried out with a pin-on-disc tester. Rectangular specimens having contact area of 44 mm2 are loaded against a rotating disc, which carried a
bonded abrasive SiC paper of 600 grit. The applied normal loads used were 3, 5, 7 and 9 N. The sliding velocities employed were 0.5, 0.75 and 1 m/s. The sliding distance was kept constant at 120 m for each sample. In these tests, each specimen was ground up to grade 2000 abrasive paper to ensure that the wear surface is in complete contact with the abrasive counterface. The weight loss of the pin was measured at various intervals in an analytical balance of 0.0001g precision. The pins were cleaned in acetone and dried prior to each weight measurement. The abrasive wear
rate of the pins was defined as the weight loss suffered per
unit sliding distance.
3. Results and Discussions
3.1 Characterization of the prepared powders
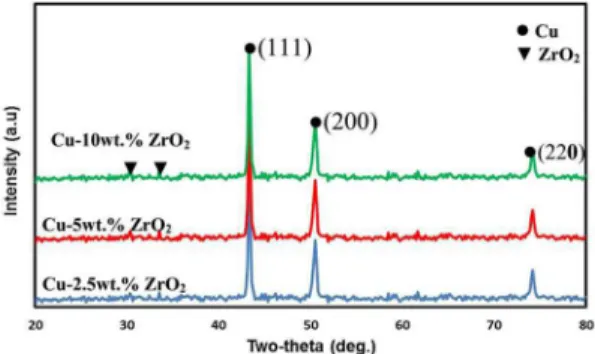
Figure 2 shows X-ray diffraction (XRD) pattern of
nanocomposite (Cu-2.5, 5 and 10 wt.% ZrO2) powders after
reduction by hydrogen. The sharp XRD peaks on the pattern
correspond to Cu phase and the low intensity ones could be attributed to tetragonal ZrO2 phase. The ZrO2 peaks showed lower intensity values than that of copper. It was noticed that the intensity of the ZrO2 peaks are not clear up to 10%
Figure 2. XRD pattern of the Cu-ZrO2 nanocomposite after reduction.
ZrO2. This may be attributed to the fact that ZrO2 particles are extremely small that they were embedded in the copper
matrix. However, XRD peak intensities of the ZrO2 phase
are noticeably increased with increasing weight percentage of ZrO2. The particle size of zirconia was calculated from
X-ray line broadening using Scherer's formula (D = 0.9λ/β cosθ), where, D is the crystallite size, λ is the wavelength of the radiation, θ is the Bragg's angle and β is the full width at
half maximum27. The crystallite size of zirconia nanoparticles
showed a value of 50 nm whilst size of copper crystallites were 270 nm.
The obtained Cu-ZrO2 nanocomposite powders were
characterized by FESEM as presented in Figure 3. Particles
with a size of 20-60 nm are clearly visible, as well as the presence of few agglomerates >100 nm. The particles are irregularly shaped, with the presence of individual nodular particles with a rough surface morphology.
The structure of ZrO2 is formed during the heat treatment of nanocomposite powder in air (650 °C, 1 h). In order to identify the ZrO2 dispersoids embedded in Cu-ZrO2 powders,
mixed powder was flushed with 10% nitric acid to selectively
pickle Cu matrix, the remaining ZrO2 dispersions were
collected by filtering. Figure 4 shows the particle sizes and
shapes of ZrO2 powder. This was observed clearly in the
high resolution of TEM. TEM observations confirmed that
the ZrO2 particle size ranged from 40 to 60 nm. All extracted particles showed regular shape appearance.
3.2 Characterization of the sintered
nanocomposites
Microstructural studies conducted on the composites revealed homogeneous distribution of the ZrO2 particles in the Cu matrix. To achieve optimized mechanical and electrical
properties of the composite materials, it is significant to
obtain uniform distribution of reinforcement in the matrix. If reinforcement particles in the composites do not disperse
uniformly, this affects mechanical and electrical properties
of composites negatively23. Microstructural morphology and
Figure 3. FE-SEM micrograph of the nanocomposite powder; (a)
Cu-2.5 wt% ZrO2, (b) Cu-5 wt% ZrO2 and (c) Cu-10 wt% ZrO2.
Figure 4. TEM images of ZrO2 extracted from the Cu-ZrO2 nanocomposite powder.
are shown in Figure 5. Brighter regions imply Cu matrix
and darker and cornered particles imply the reinforcement component of ZrO2. It can be seen that ZrO2 particles are homogeneously dispersed in the Cu matrix.
Figure 6 shows the FE-SEM images of Cu-2.5, 5 and
10 wt.% ZrO2 composites sintered at 950 o C for 2 h. The
FE-SEM micrographs give abundant information about the
ZrO2 distribution, status of physical intimacy between Cu and ZrO2 and mechanical phenomena. With the increase in weight percentage of ZrO2 in Cu matrix the efficiency of distribution
becomes remarkably better. The density difference between
the matrix and reinforcement also leads to the formation of clusters sometimes at high wt.% of the reinforcement28.
The physical contact of the ZrO2 nanoparticles with the Cu
matrix can be attributed to the high atomic diffusivity of
the nanoparticles. The stabilization of the surface energy of nanoparticles is a thermodynamic driven phenomenon; hence it is quite obvious that the physical adherence of Cu with ZrO2 is proper in the nanocomposites.
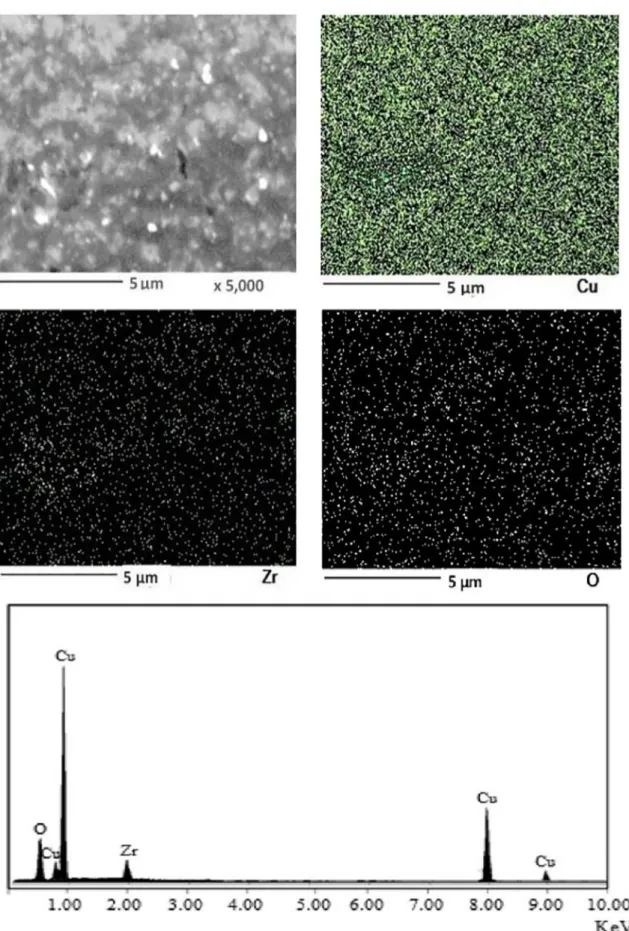
In order to determine the distribution of elements in the structure, surface analysis of the sample was performed
by FE-SEM and the composition scanning (EDS) images shown in Figure 7. From the microstructure analysis, it can be concluded that the samples are well densified and
sintered. Peaks of elementary Cu, O and Zr were detected, which are related to the composition of ZrO2 particles and Cu matrix, respectively. The ZrO2 particles with the high melting point, high hardness and excellent thermal stability and chemical inertness do not melt or coarsen when the annealing temperature approaches the melting point of
copper, which effectively pins down the grain and sub-grain
boundaries of the copper matrix and impedes the movement of dislocation and improves strength of the composite at elevated temperature.
The powder compaction is an important step in the preparation of bulk materials by powder technology. This
step controls the porosity and the shape of the final product that can be sintered. Bar graph illustrating the densification
measured after compaction and sintering of the Cu-ZrO2 composites as a function of ZrO2 content is shown in Figure 8. Relative density is the ratio of experimental and theoretical
densities of sample. Experimental density was determined
by the Archimedes method and the theoretical density was calculated from the simple rule of mixtures. It was clear
that, the densification of Cu-ZrO2 composites was decreased
from 95.6 % to 88.7 % by increasing ZrO2 weight fraction from 0 % up to 10% under the same processing conditions. This is due to the density of ZrO2 nanoparticles being much smaller than that of copper and high porosity content which accompanies the high fraction of reinforcement ZrO224.
Figure 5. Optical images of the nanocomposite metallographic structure; (a) Cu-2.5 wt% ZrO2, (b) Cu-5 wt% ZrO2 and (c) Cu-10
wt% ZrO2.
Figure 6. FE-SEM micrographs of nanocomposites; (a) Cu-2.5
wt% ZrO2, (b) Cu-5 wt% ZrO2 and (c) Cu-10 wt% ZrO2.
to the presence of zirconia nanoparticles on the surface of copper micrometric particles produces a remarkable increase of porosity in the microstructure of the samples. The
creation of voids in the Cu matrix hinders the densification
and impedes the continuity in intimacy contact of Cu and
zirconia. In addition, the decline in the pressing capacity of samples with increasing in the amount of ZrO2 is due to the high hardness of ZrO2. Therefore, these composites have
lower compressibility that results in lower densification29,30.
Electrical conductivity of each sample was measured and
compared to the value of standard electrical conductivity, which is given by copper compact of industrial grade and reported as percentage of standard conductivity as shown
in Eq. (4);
(4)
(%
)
1
Electrical conductivity
std
x 00
std s
Figure 8. Bar graph of densification of Cu−ZrO2 composites as
function of ZrO2 content.
where σs is the electrical conductivity of the tested sample and σstd is the electrical conductivity of the standard
copper. Bar graph illustrating the electrical conductivity after compaction and sintering of the Cu-ZrO2 composites as a function of ZrO2 content is shown in Figure 9. Electrical conductivity of composites decreased with increasing content of ZrO2. This can be attributed to the lower electrical conductivity of ZrO2 compared to that of Cu. The second reason is the agglomeration of some ZrO2 particles at the grain boundaries which can form a kind of grain boundary phase that increases the scattering of the charge carrier, hence
reducing the electrical conductivity. Electrical conductivity
of the metal is mainly dependent on the movement of the internal electron. ZrO2 particles can increase the scattering surfaces for the conduction electrons in the matrix and reduce the electrical conductivity of the Cu matrix composites31.
Overall, increment in the weight % of ZrO2 nano-particles up to 10 wt.% in the samples, caused the reduction in the electrical conductivity (53.8%) of the nanocomposites, while using Al2O3 decreased the electrical conductivity to18.5%22.
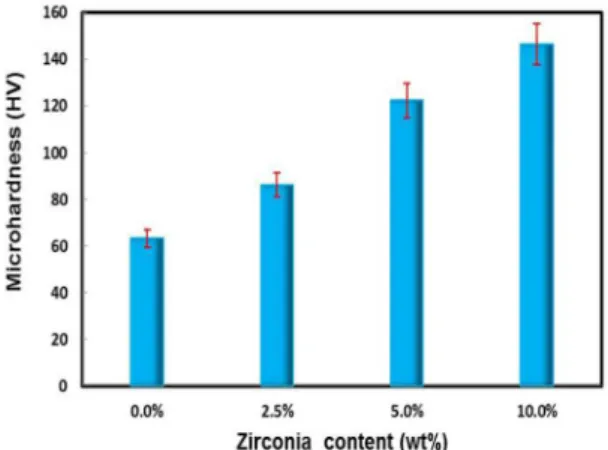
Bar graph illustrating the microhardness after compaction and sintering of the Cu ZrO2 composites as a function of ZrO2 content is shown in Figure 10. It was observed from
Figure 9. Bar graph of electrical conductivity of Cu−ZrO2 composites as function of ZrO2 content.
Figure 10. Bar graph of microhardness of Cu−ZrO2 composites as
function of ZrO2 content.
the present study that by increasing the amount of ZrO2 from 0% to 10%, microhardness increased from 63.2 to 146.5 HV. The microhardness of Cu is improved considerably with the addition of ZrO2 nanoparticles at the expense of its ductility, this can be attributed to the high hardness of ZrO2. The increase in hardness of the composite can also be attributed to the gradual decrease in grain size of the Cu matrix as a result of the presence of nano-ZrO2 particles. Also, the nano-ZrO2 particles embedded in the Cu matrix would prevent the slip of the grain boundary of Cu matrix, thereby, improving the hardness of the composite32. The hardness of material is a
physical parameter indicating the ability of resisting local plastic deformation. Reinforcing nano-ZrO2 particles with high hardness, are dispersed in the copper matrix and act as obstacles to the movement of dislocation when plastic deformation occurs. Also the hardness enhancement is an indication of high interfacial strength at Cu-ZrO2 interface and homogeneous distribution of ZrO2 within Cu matrix25.
Bar graph illustrating the compressive strength after compaction and sintering of the Cu-ZrO2 composites as a function of ZrO2 content is shown in Figure 11. Obviously, the compressive strength value of Cu-ZrO2 composite is
significantly higher than that of the Cu matrix, suggesting
that the ZrO2 nanoparticles can strongly enhance the mechanical strength of the Cu matrix. The highest value of the compressive strength of the sintered samples, 474.5 MPa, were obtained after addition of up to 10 wt.% ZrO2. Although tensile testing can determine if a proper bonding has been produced yet, compression test can also be helpful to studying the barreling and upsetting behavior of the compacts. Stronger bonds among particles delay the crack initiation during deformation especially at the time of barreling33,34.
Figure 11. Bar graph of compressive strength of Cu−ZrO2 composites
as function of ZrO2 content.
Figure 12. Fractography of different deformed composites: (a) Cu, (b) Cu-2.5 wt.% ZrO2, (c) Cu-5 wt.% ZrO2, (d) Cu-10 wt.% ZrO2.
Figure 13. Abrasive wear rate of Cu−ZrO2 nanocomposites with various ZrO2 content at the sliding distance of 120 m; (a) V = 0.5 m/s,
(b) V = 0.75m/s, (c) V = 1 m/s, (d) load = 9 N.
strength enhancement is an indication of stronger bonding at Cu-ZrO2 interface and homogeneous distribution of ZrO2 within Cu matrix35. Additionally, increasing the amount of
ZrO2 lead to a decrease in the distance between the ZrO2
particles. Decreasing the distance between the ZrO2 particles
will increase the required tension for dislocation motion between the ZrO2 particles leading to an increase in the material strength31.
The fractographs of different deformed composites at room temperature are shown in Figure 12. It was observed
were cracked before reaching 60% reduction in height whilst monolithic copper specimen showed no cracks up to 60% reduction. It was observed that increasing ZrO2 content composites are more prone to circumferential cracks.
Figures 13(a-c) show the effect of the applied load on
abrasive wear rate of Cu ZrO2 nanocomposite at sliding distance of 120 m and various velocities from 0.5 to 1 m/s.
It can be observed from Figs. 13(a-c), that with increasing
the applied normal load during wear tests, the abrasive
wear rate of pure copper and Cu-ZrO2 nanocomposite
increases20,21. Applied load affects the wear rate of compacts
significantly and is the most dominating factor controlling
the wear behavior. By increasing the applied load, plastic deformation on the subsurface due to increased penetration depth of counterface can occur.
It can also be seen that the increase in amount of incorporated ZrO2 particles in the pure copper matrix decreased the abrasive wear rate and increased the wear
resistance. The significant reduction in the abrasive wear rate
of Cu-ZrO2 nanocomposite is due to the incorporation of inert ZrO2 nanoparticles in the pure copper matrix which led to reduction in the size of copper crystals and an improvement
in microhardness of the nanocomposites. This latter is due to
the combined effect of both grain-refinement and
dispersion-strengthening, which results in considerable improvement in abrasion wear resistance of the Cu-ZrO2 nanocomposites36,37.
It can also be clearly seen in Figure 13d that the abrasive
wear rate increases with the increase of sliding velocity. This is associated with the increase of surface temperature under high sliding velocity, which promotes softening of the surface, leading to more surface and subsurface damage, eventually resulting in higher abrasive wear rate.
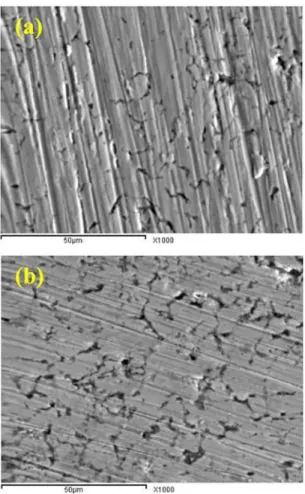
The worn surfaces of unreinforced Cu and Cu−10%
ZrO2 nanocomposite specimens under 9 N load and sliding
velocity of 1 m/s were revealed in Figure 14. As shown in Figure 10a, the continuous furrow and deeper furrow can
be found on the surface, which was paralleled to sliding
direction. Some finer copper grains had peeled off during
the wear process. The worn surface of the Cu-10% ZrO2
nanocomposites was shown in Figure 10b. Compared with
Cu matrix materials, the shallower and narrower furrow was found on the wear surface, and grain stripping was slight.
The figure shows distinct grooves and ridges running parallel
to each other's in the sliding direction. It can be seen from the micrographs that the grooves are wider and debris in Cu matrix as compared within the Cu-ZrO2 one under the sample conditions indicating the higher wear resistance of Cu-ZrO2 sample. This can be explained by the formation of a thick transfer lager which protects the underlying Cu matrix from any contact with the sliding SiC abrasive counterpart so reduction of wear rate takes place.
4. Conclusions
The following conclusions can be drawn based on the present study:
1. Cu matrix reinforced with different weight fraction of the zirconia (2.5, 5 and 10 wt.%), were successfully prepared by in situ chemical route followed by pressing and sintering.
2. In situ chemical route gave nanoparticles of zirconia of 50 nm size that are uniformly dispersed within Cu-matrix.
3. Increasing the weight fraction of ZrO2 nano-particles up to 10 wt.% in the samples, caused reduction in
the densification (7.2%) and electrical conductivity
(53.8%) of the nano-composites.
4. The Cu-10 wt.% ZrO2, achieved the highest micro-hardness (146.5 HV) and compressive strength (474.5 MPa) of the nanocomposites.
5. The abrasive wear rate of the Cu-ZrO2 nanocomposite increased with the increasing load or sliding velocity and is always lower than that of unreinforced copper at any load or any velocity. The wear resistance of the Cu-ZrO2 nanocomposite reinforced with 10% ZrO2 is obviously improved.
5. References
1. Zhang Z, Wu X, Jiang C, Ma N. Electrodeposition of Ni
matrix composite coatings containing ZrC particles. Surface Engineering. 2014;30(1):21-25.
2. Wagih A, Fathy A. Experimental investigation and FE simulation
of spherical indentation on nano-alumina reinforced
copper-matrix composite produced by three different techniques. Advanced Powder Technology. 2017;28(8):1954-1965.
3. Jiang JB, Zhang L, Zhong QD, Zhou QY, Wang Y, Luo J.
Preparation and characterization of nickel-nano-B4C composite coatings. Surface Engineering. 2012;28(8):612-619.
4. El Mahallawy N, Fathy A, Hassan M. Evaluation of mechanical
properties and microstructure of Al/Al-12%Si multilayer via warm accumulative roll bonding process. Journal of Composite Materials. 2017.
5. Selvakumar N, Vettivel SC. Thermal, electrical and wear behavior of sintered Cu-W nanocomposite. Materials & Design.
2013;46:16-25.
6. Fathy A, Megahed AA. Prediction of abrasive wear rate of in
situ Cu-Al2O3 nanocomposite using artificial neural networks.
International Journal Advanced Manufacturing Technology.
2012;62:953-963.
7. Fathy A, Wagih A, El-Hamid MA, Hassan A.A. The effect
of Mg add on morphology and mechanical properties of Al-xMg/10Al2O3 nanocomposite produced by mechanical alloying.
Advanced Powder Technology. 2014;25(4):1345-1350.
8. Shehata F, Abdelhameed M, Fathy A, Elmahdy M. Preparation
and Characteristics of Cu-Al2O3 Nanocomposite. Open Journal of Metal. 2011;1(2):25-33.
9. Balasubramanian A, Srikumar DS, Raja G, Saravanan G, Mohan S. Effect of pulse parameter on pulsed electrodeposition of copper
on stainless steel. Surface Engineering. 2009;25(5):389-392.
10. Akhtar F, Askari SJ, Shah KA, Du X, Guo S. Microstructure,
mechanical properties, electrical conductivity and wear behavior of high volume TiC reinforced Cu-matrix composites. Materials Characterization. 2009;60(4):327-336.
11. Girish BM, Basawaraj BR, Satish BM, Somashekar DR. Electrical resistivity and mechanical properties of tungsten
carbide reinforced copper alloy composites. International Journal of Composite Materials. 2012;2(3):37-42.
12. Fathy A, Sadoun A, Abdelhameed M. Effect of matrix/reinforcement
particle size ratio (PSR) on the mechanical properties of extruded Al-SiC composites. The International Journal of Advanced Manufacturing Technology. 2014;73(5-8):1049-1056.
13. Efe GC, Ipek M, Zeytin S, Bindal C. An investigation of the effect of SiC particle size on Cu-SiC composites. Composites Part B: Engineering. 2012;43(4):1813-1822.
14. Shehata F, Fathy A, Abdelhameed M, Moustafa SF. Fabrication
of copper-alumina nanocomposites by mechanochemical routes.
Journal of Alloys and Compounds. 2009;476(1-2):300-305.
15. Ritasalo R, Liua XW, Söderberg O, Keski-Honkola A, Pitkänen V, Hannula SP. The Microstructural Effects on the Mechanical and Thermal Properties of Pulsed Electric Current Sintered
Cu-Al2O3 Composites. Procedia Engineering. 2011;10:124-129.
16. Fathy A, Wagih A, El-Hamid MA, Hassa A. Effect of Mechanical Milling on the Morphology and Structural Evaluation of
Al-Al2O3 Nanocomposite Powders. International Journal of Engineering-Transactions A: Basics. 2013;27(4):625-632.
17. Tsui HP, Hung JC, Wu KL, You JC, Yan BH. Fabrication of a Microtool in Electrophoretic Deposition for Electrochemical
Microdrilling and in Situ Micropolishing. Materials and Manufacturing Processes. 2011;26(5):740-745.
18. Tu JP, Wang NY, Yang YZ, Qi WX, Liu F, Zhang XB, et al.
Preparation and properties of TiB2 nanoparticle reinforced copper matrix composites by in situ processing. Materials Letters. 2002;52(6):448-452.
19. El Mahallawy N, Fathy A, Abdelaziem W, Hassan M.
Microstructure evolution and mechanical properties of Al/ Al-12%Si multilayer processed by accumulative roll bonding (ARB). Materials Science and Engineering: A. 2015;647:127-135.
20. Vieira Junior LE, Bendo T, Nieto MI, Klein AN, Hotza D, Moreno R, et al. Processing of Copper Based Foil Hardened with Zirconia by Non-Deformation Method. Materials Research.
2017;20(3):835-842.
21. Shehata F, Fathy A, Abdelhameed M, Moustafa SF. Preparation
and properties of Al2O3 nanoparticle reinforced copper matrix composites by in situ processing. Materials & Design.
2009;30(7):2756-2762.
22. Fathy A, Shehata F, Abdelhameed M, Elmahdy M. Compressive
and wear resistance of nanometric alumina reinforced copper matrix composites. Materials & Design. 2012;36:100-107.
23. Fathy A, Elkady O, Abu-Oqail A. Production and properties of
Cu-ZrO2 nanocomposites. Journal of Composite Materials. 2017.
24. Ding J, Zhao N, Shi C, Du X, Li J. In situ formation of
Cu-ZrO2 composites by chemical routes. Journal of Alloys and Compounds. 2006;425(1-2):390-394.
25. Gao J, Zheng J, Hou C. Nano zirconia reinforced Cu-matrix composites. Heat Treatment of Metals. 2006;31(1):40-42.
26. Towle DJ, Friend CM. Comparison of compressive and tensile
properties of magnesium based metal matrix composites.
Materials Science and Technology. 1993;9(1):35-41.
27. Cullity BD. Elements of X-ray Diffraction. 2nd ed. Boston:
Addison-Wesley; 1978.
28. Slipenyuk A, Kuprin V, Milman Y, Goncharuk V, Eckert J.
Properties of P/M processed particle reinforced metal matrix
composites specified by reinforcement concentration and
matrix-to-reinforcement particle size ratio. Acta Materialia.
2006;54(1):157-166.
29. Wagih A, Fathy A. Experimental investigation and FE simulation
of nano-indentation on Al-Al2O3 nanocomposites. Advanced Powder Technology. 2016;27(2):403-410.
30. Wagih A, Fathy A, Sebaey TA. Experimental investigation on the
compressibility of Al/Al2O3 nanocomposites. International Journal of Materials and Product Technology. 2016; 52(3-4):312-332.
31. Fathy A, El-Kady O. Thermal expansion and thermal conductivity
32. Lei W, Zhu D, Qu N. Research on mechanical properties
of nanocrystalline electroforming layer. Chinese Journal of Mechanical Engineering. 2004;40(12):124-127.
33. El-Kady O, Fathy A. Effect of SiC particle size on the physical
and mechanical properties of extruded Al matrix nanocomposites.
Materials & Design (1980-2015). 2014;54:348-353.
34. Fathy A, El Kady O, Mohammed MMM. Effect of iron addition on
microstructure, mechanical and magnetic properties of Al-matrix composite produced by powder metallurgy route. Transactions of Nonferrous Metals Society of China. 2015;25(1):46-53.
35. Narayanasamy R, Ramesh T, Pandey KS. Workability studies
on cold upsetting of Al-Al2O3 composite material. Materials & Design. 2006;27(7):566-575.
36. Fathy A, Elkady O, Abu-Oqail A. Production and properties of
Cu-ZrO2 nanocomposite produced by thermochemical process.
Journal of Alloys and Compounds. 2017;719:411-419.
37. Fathy A, Elkady O, Abu-Oqail A. Microstructure, mechanical