www.ccarevista.ufc.br ISSN 1806-6690
Amino acid composition, and determination and prediction of the
protein digestibility of different sugarcane yeasts in broilers
1Composição aminoacídica, determinação e predição da digestibilidade protéica de
diferentes leveduras de cana para frangos
Emanuela Nataly Ribeiro Barbosa2, Carlos Bôa-Viagem Rabello2, Claudia Costa Lopes3*, Edney Pereira Silva4
and Ednardo Rodrigues Freitas5
ABSTRACT -The aim of this study was to determine the amino acid composition and digestible protein values of different sugarcane yeasts, as well as to generate prediction equations for the apparent digestibility coefficient of dry matter (ADCDM) and crude protein (ADCCP), based on the chemical composition of the yeast and the age of the broilers. Four ileal digestion trials were carried out with 690 broilers, divided into the pre-starter, starter, growth and final phases. The birds were housed in metabolic cages and distributed in a completely randomised design, consisting of five treatments and six replications of eight, six, five and four birds respectively in each experimental phase. The treatments consisted of one reference feed and four test feeds, substituting 30% of the reference feed with four different yeasts. Yeasts two and four showed a higher percentage of amino acids. However, yeast two had the highest percentages of ADCDM, ADCCP and digestible protein: 83.64, 81.22 and 14.66% in the pre-starter phase; 78.09, 78.28 and 14.13% in the starter phase; 76.74, 74.75 and 13.49% in the growth phase; and 72.98, 71.21 and 12.85% in the final phase respectively. There was an average reduction of 0.424% in ADCDM and 0.428% in ADCCP for each day the birds aged. The following prediction equations were generated from the composition of the yeasts and age of the chickens: ADCDM = 77.4 0.424*(age) 7.51*(DM) 45.01*(EE) and -0.424*(age) + 3.02*(CP) + 126.93*(EE) - 0.03*(GMD) and ADCCP = 606.9-0.428*(age) -5.8*(DM) - 0.01*(GMD) and -0.426*(age) + 2.68(CP) + 139.7*(EE) - 0.03*(GMD).
Key words:Amino acids. Ileal digestibility. Digestibile protein.Saccharomyces cerevisiae.
RESUMO - Objetivou-se determinar a composição aminoacídica e os valores de proteína digestível de diferentes leveduras de cana-de-açúcar, bem como gerar equações de predição dos coeficientes de digestibilidade aparente da matéria seca (CDAMS) e proteína bruta (CDAPB), com base na composição química da levedura e idade dos frangos de corte. Quatro ensaios de digestilidade ileal foram realizados com 690 frangos de corte, divididos nas fases pré-inicial, inicial, crescimento e final. As aves foram alojadas em gaiolas de metabolismo e distribuídas num delineamento inteiramente casualizado constituído de cinco tratamentos e seis repetições de: oito, seis, cinco e quatro, respectivamente, para cada fase experimental. Os tratamentos foram: uma ração referência e quatro rações testes com a substituição de 30% da ração referência por quatro diferentes leveduras. As leveduras dois e quatro apresentaram maiores percentagem de aminoácidos. Entretanto, a levedura dois apresentou os maiores percentuais de CDAMS, CDAPB e de proteína digestível, estes sendo: 83,64; 81,22 e 14,66% na fase pré-inicial, 78,09; 78,28; 14,13% na inicial, 76,74; 74,75 e 13,49% na fase de crescimento e 72,98; 71,21 e 12,85% na fase final, respectivamente. Houve redução média de 0,424% no CDAMS e 0,428% no CDAPB, para cada dia de envelhecimento das aves. A partir da composição das leveduras e idade dos frangos, foram geradas as seguintes equações de predição: CDAMS = 77,4 - 0,424*(idade) - 7,51*(MS) 45,01*(EE) e 0,424* (idade) + 3,02*(PB) + 126,93*(EE) 0,03*(DGM) e CDAPB = 606,9 0,428*(idade) 5,8*(MS) -0,01*(DGM) e - 0,426*(idade) + 2,68(PB) + 139,7*(EE) - 0,03*(DGM).
Palavras-chave: Aminoácidos. Digestibilidade ileal. Proteína digestível.Saccharomyces cerevisae.
DOI: 10.5935/1806-6690.20180038 *Author for correspondence
Received for publication on 04/01/2016; approved 03/07/2017
1Parte da Dissertação do primeiro autor apresentada na Universidade Federal Rural de Pernambuco/UFRPE
2Departamento de Zootecnia, Universidade Federal Rural de Pernambuco/UFRPE, Recife-PE, Brasil, [email protected], carlos.
3Departamento de Zootecnia, Instituto de Ciências Sociais, Educação e Zootecnia - ICSEZ, Universidade Federal do Amazonas, Parintins-AM,
Brasil, [email protected]
INTRODUCTION
With an estimated production of 512 thousand tons in the 2013/2014 harvest (ÚNICA, 2015), products of microbial origin, such as yeasts, stand out as promising alternative ingredients in animal feed. According to Freitas et al. (2013), these agro-industrial by-products are now being studied, as they are generally ingredients of high biological value (RUTZet al., 2006), acquired at low cost, and readily found in certain areas of sugar cane production.
Yeast is obtained from the anaerobic fermentation of sugarcane or molasses during the process of alcohol production, collected by the centrifugation of wine or from the bottom of the fermentation vats, and then dried. According to Silvaet al. (2008), yeast is a viable alternative in the partial replacement of protein components that make up animal feeds, such as soybean meal, due to frequent increases in the price of cereal grain and vegetable sources of protein.
According to the literature, yeast has levels of crude protein that vary from 16.85 to 40.18% (LOPES et al., 2011; LOPESet al., 2015, ROSTAGNOet al., 2011). On the other hand to amino acid composition, Lopes et al. (2011) found that yeast is poor in sulphurated amino acids, such as methionine (0.26%) and cystine (0.14%); however, according to the NRC (1994), sugarcane yeast has good levels of lysine (3.23%), leucine (3.19%) and threonine (2.06%). It is a great source of complex B vitamins, carbohydrates and minerals (FLEMMING, 2005).
The availability of prediction equations, or an indirect method to determine digestibility by means of the chemical and physical parameters of feed, is important for increasing the precision of the feed-formulation process, so that it becomes possible to correct the variations inherent in obtaining ingredients (ROSTAGNO et al., 2007), and allow estimates of digestible values based on the variability of feed composition.
Considering the above, the aim of this study was to determine the apparent ileal digestibility coefficients of dry matter and crude protein in different sugarcane yeasts for broilers at four different ages, as well as to generate prediction equations to estimate the values of these coefficients from the chemical and physical composition of the yeasts.
MATERIAL AND METHODS
Four yeast samples were acquired from different companies (Distilleries) in the northeast of the Brazil, and sent to the laboratory of Evonik Industries for amino
acid analysis by high performance liquid chromatography (HPLC). Samples were also sent to the Plant Chemistry and Animal Nutrition laboratories of the Universidade Federal Rural de Pernambuco - UFRPE to determine the chemical composition (Table 1) as per methodologies proposed by AOAC (1990). The geometric mean diameter (GMD) was determined following the methodology described by Zanotto and Bellaver (1996); this parameter of physical composition was analysed, as it makes it possible to correlate the granulometry of the ingredient with nutrient digestibility and animal response.
Four experimental trials were carried out in the Laboratory of Non-Ruminant Digestibility at the Department of Animal Science (UFRPE). For this purpose, 690 male Cobb 500 broilers of uniform weight were used, housed in metabolic cages (1.00 x 0.50 x 0.50 m); for each trial, the birds were distributed in a completely randomised experimental design, consisting of five treatments and six replications.
The experiment was divided into four experimental phases, each lasting eight days. In the pre-starter phase (one to eight days of age), pre-starter phase (ten to 18 days of age), growth phase (20 to 28 days of age) and final phase (30 to 38 days of age), eight, six, five and four birds were used per experimental unit respectively.
During the experiments, the birds received water and feed ad libitum. The mean temperature and humidity recorded during the experimental phases were respectively: pre-starter phase 33.2 °C and 70.4%, starter phase 30.28 ºC and 70.9%, growth phase 30.8 °C and 71.7%, and in the final phase 31.06 °C and 74.75%.
The treatments consisted of one reference diet (RD), based on maize and soybean meal, and another four test diets, each composed of a mixture of 70% of the RD and 30% of one of the yeasts under study, to give the following diets: Diets A - reference diet; Diets B - 70% reference feed + the addition of 30% Yeast 2; Diets C - 70% reference ration + the addition of 30% Yeast 1; Diets D - 70% reference feed + the addition of 30% Yeast 3; Diets E - 70% reference feed + the addition of 30% Yeast 4.
The reference diets (Table 2) were formulated using the feed-composition tables proposed by Rostagno et al. (2011). The birds were raised in a shed and received reference feed, following the recommendations of the COBB 500 management guide (2012); for each experimental period the birds were selected by weight, with a view to achieving maximum uniformity for the start of the experimental phase.
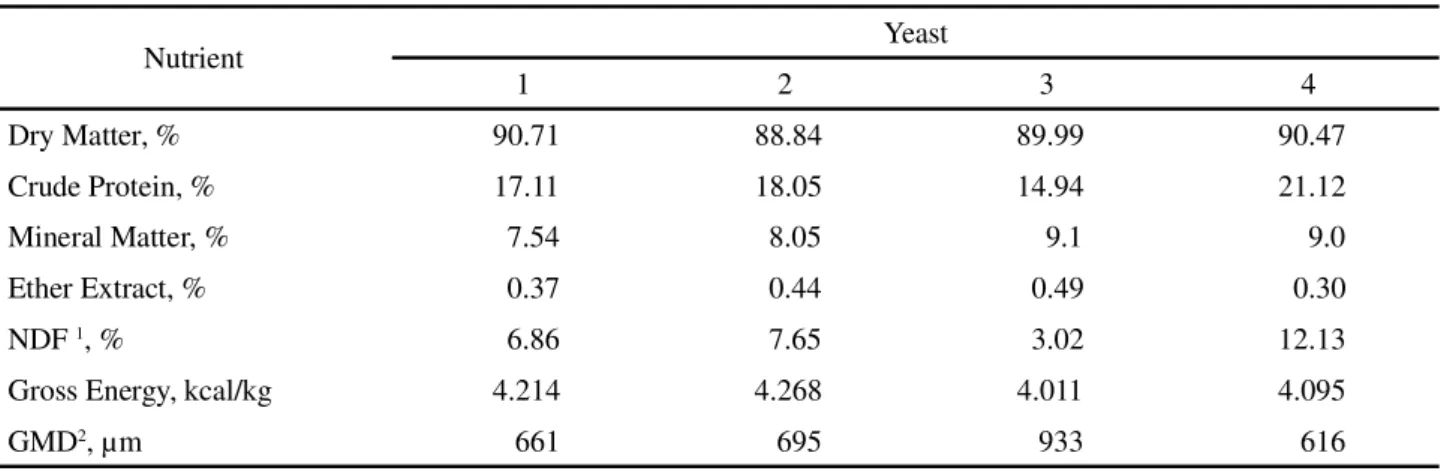
Table 1 - Physicochemical and energetic composition of the sugarcane yeasts used in the experimental trial, expressed as dry matter
1NDF-Neutral Detergent Fibre;2 GMD - Geometric Mean Diameter *Expressed as dry matter
Nutrient Yeast
1 2 3 4
Dry Matter, % 90.71 88.84 89.99 90.47
Crude Protein, % 17.11 18.05 14.94 21.12
Mineral Matter, % 7.54 8.05 9.1 9.0
Ether Extract, % 0.37 0.44 0.49 0.30
NDF1, % 6.86 7.65 3.02 12.13
Gross Energy, kcal/kg 4.214 4.268 4.011 4.095
GMD2, µm 661 695 933 616
as an indicator. At the end of each period, the birds were sacrificed by cervical dislocation to collect the contents of the ileal segment. Two hours before sacrificing the animals, feed intake was stimulated so that more material could be present in the ileum. The ileum was exposed after abdominal incision and a segment, approximately 18 cm long, ending 1.5 cm from the ileo-cecal-colic junction, was clamped and its contents delicately removed with the help of tweezers, placed in plastic tubes and stored in a freezer at -20 °C.
At the end of all the experimental periods, the collected materials were unfrozen, homogenised, placed in properly identified Petri dishes, weighed, refrozen and then vacuum-dried at -54 °C for 48 hours in a lyophiliser.
The pre-dried samples were then ground in a ball mill and sent to the laboratory to determine dry matter, crude protein and chromium, as per the methodology described by AOAC (1990). From results of the analyses, calculations were made to determine the apparent digestibility coefficient of the dry matter (ADCDM), crude protein (ADCCP) and digestible protein (PD), using the following formulae:
(1) Indigestibility Factor:
(IF) = Diet indicator / Digesta indicator (1)
(2) Apparent digestibility coefficient of dry matter:
ADCDM (%) = 100 - (IF*100) (2)
(3) Apparent digestibility coefficient of crude protein:
ADCCP (%) = CPdiet- (CPdigesta*IF) / CPdiet*100 (3)
(4) Digestible protein:
DP = CP
(diet / feed) *ADCCP(diet / feed) / 100 (4)
The values determined for the apparent ileal digestibility coefficients of the dry matter (ADCDM), crude protein (ADCCP) and digestible protein (DP) of the feed and the sugarcane yeast in the experimental trials were submitted to analysis of variance, and the mean values compared by Tukey’s test at 5% probability.
The chemical and physical composition of the yeasts, i.e. dry matter, crude protein, ether extract, mineral matter, neutral detergent fibre, crude energy and geometric mean diameter, as well as the variable, age of the birds, were also submitted to multiple regression analysis, these values being the independent variables, and the values for ADCDM and ADCCP, the dependent variables, to verify those variables that best correlated with the values for ADCDM and ADCCP, thereby generating prediction equations for the apparent and corrected apparent metabolisable energy for the yeasts by means of the Indirect Elimination Stepwise (Backward) method during the experimental phases.
The coefficients of determination (R2) and the
Akaike information criterion (AIC) (Akaike, 1974) were used to verify the good fit of the prediction equations to the data. The statistical analyses were carried out using the Statistical Analysis Systems 9.1.3 statistical software package (SAS INSTITUTE, 2008).
RESULTS AND DISCUSSION
1Vitamin-mineral supplement. (Guaranteed levels per kg of product). Vit. A: 1500,000 UI, Vit. D3: 500,000 UI. Vit. E: 3,333 mg. Vit K3: 250 mg,
Riboflavin: 1,000 mg. Thiamine: 300 mg, Vit B6 (Pyrixine): 500 mg, Vit B12: 3,333 mg, Niacin: 6.667 mg, Calcium Pantothenate: 2,000 mg, Folic Acid: 285 mg, Biotin: 8.33 mg, Choline chloride: 70 mg, Methionine: 295 mg, Ferro: Iron mg, Copper: 1,550 mg, Manganese: 14,000 mg, Zinc: 12,130 mg, Iodine: 280 mg, Selenium: 70 mg, Robenidine: 6,000 mg, Licomicin: 734 mg, Antioxidant Additive: 16,667 mg;2Vitamin supplement.
(Guaranteed levels per kg of product). Vit A 1000000 IU, Vit B3 2000000 IU, Vit E 20000 mg, Vit K3 4000 mg, Vit B1 1880 mg, Vit B2 5000 mg, Vit B6 2000 mg, Vit B12 1000 mg, niacin 30000 mg, Pantothenic 13500 mg, Ac. Folic acid 500 mg, Selenium 250 mg, Antioxidant 100000 mg;
3Mineral supplement. (Guaranteed levels per kg of product). Manganese 75000 mg, Zinc 70000 mg, Iron 60000 mg, Copper 85000 mg, Iodine
1500 mg, Cobalt 200 mg
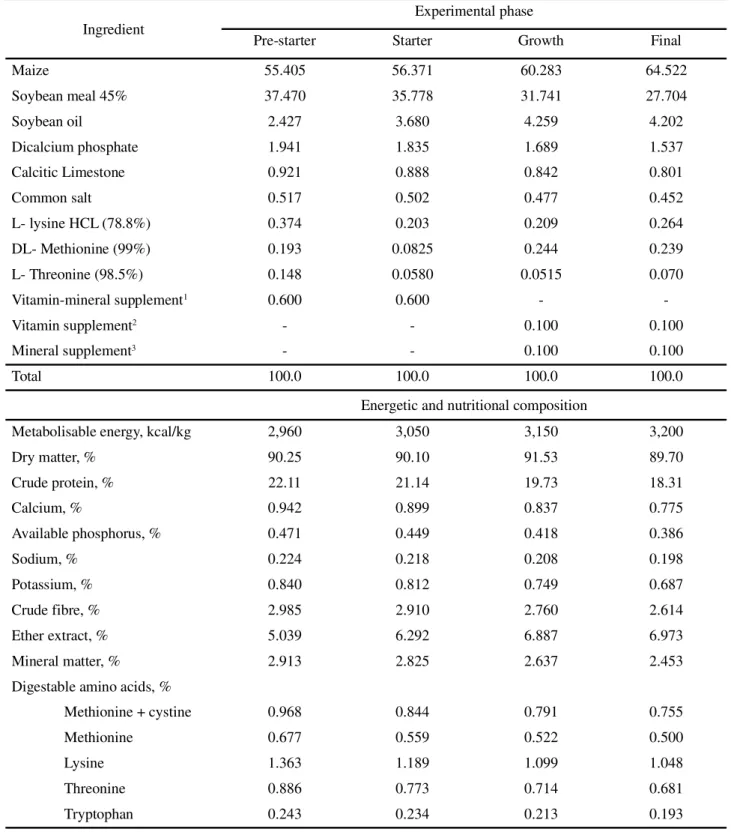
Table 2 - Percentage composition and nutritional values of the experimental diets
Ingredient
Experimental phase
Pre-starter Starter Growth Final
Maize 55.405 56.371 60.283 64.522
Soybean meal 45% 37.470 35.778 31.741 27.704
Soybean oil 2.427 3.680 4.259 4.202
Dicalcium phosphate 1.941 1.835 1.689 1.537
Calcitic Limestone 0.921 0.888 0.842 0.801
Common salt 0.517 0.502 0.477 0.452
L- lysine HCL (78.8%) 0.374 0.203 0.209 0.264
DL- Methionine (99%) 0.193 0.0825 0.244 0.239
L- Threonine (98.5%) 0.148 0.0580 0.0515 0.070
Vitamin-mineral supplement1 0.600 0.600 -
-Vitamin supplement2 - - 0.100 0.100
Mineral supplement3 - - 0.100 0.100
Total 100.0 100.0 100.0 100.0
Energetic and nutritional composition
Metabolisable energy, kcal/kg 2,960 3,050 3,150 3,200
Dry matter, % 90.25 90.10 91.53 89.70
Crude protein, % 22.11 21.14 19.73 18.31
Calcium, % 0.942 0.899 0.837 0.775
Available phosphorus, % 0.471 0.449 0.418 0.386
Sodium, % 0.224 0.218 0.208 0.198
Potassium, % 0.840 0.812 0.749 0.687
Crude fibre, % 2.985 2.910 2.760 2.614
Ether extract, % 5.039 6.292 6.887 6.973
Mineral matter, % 2.913 2.825 2.637 2.453
Digestable amino acids, %
Methionine + cystine 0.968 0.844 0.791 0.755
Methionine 0.677 0.559 0.522 0.500
Lysine 1.363 1.189 1.099 1.048
Threonine 0.886 0.773 0.714 0.681
Based on the results seen for the total amino acid composition of the yeasts, easts 2 and 4 presented higher values when compared to the others; these results were lower than those found in NRC (1994) for lysine (3.23% ), leucine (3.19%) and threonine (2.06%). All the yeasts under study proved to be inferior in amino acid composition when compared to the whole yeast studied by Martins (2009), and the yeast extract evaluated by Silva et al. (2009). However, only yeast 3 had a lower amino acid composition than the yeast described by Lopeset al. (2011).
The values obtained for the apparent ileal digestibility coefficients of the dry matter (ADCDM,%), crude protein (ADCCP,%) and digestible protein (DP,%) of the sugarcane yeasts under study can be seen in Table 4.
Among the foods tested in the pre-starter phase, yeasts 2, 3 and 4 had a higher percentage of ADCDM (83.64, 80.95 and 82.87 respectively). Yeast 2 had the highest value for ADCCP (81.22%) and yeast 4 had the highest percentage of DP (16.57%).
In the starter period, the highest percentage of ADCDM and ADCCP were for Yeast 2 (78.09 and 78.28% respectively); for DP value, Yeasts 2 and 4 had the highest percentages (14.13 and 14.07%). The same behaviour was seen during the growth and final periods, where Yeast
2 obtained the greatest values for ADCDM (76.74 and 72.98%) and for ADCCP (74.75 and 71.21%). For DP, Yeasts 2 and 4 had better results (13.49 and 13.22%) and (12.85 and 13.07%) respectively in both experimental phases.
According to Lopeset al. (2015), the use of whole yeast in chicken diets may reduce nutrient digestibility due to the cell wall, which is thick and resistant to enzymatic digestion, making the intracellular content unavailable.
The highest values seen for DP in Yeasts 2 and 4 in all the experiments can be explained by the these yeasts having the highest levels of crude protein (18.05 and 21.12% respectively), and high protein digestibility coefficients, which increases the percentage of DP.
The digestibility coefficients of the dry matter and crude protein, as well as the digestible protein of the sugarcane yeasts under study, decreased with advancing age; this is considered normal, since according to Nery et al. (2007), in the early phases of a bird’s life, pre-starter and pre-starter, greater nitrogen retention occurs for the deposition of protein tissue.
The multiple regression equations generated to estimate the apparent digestibility coefficients of the dry matter (ADCDM) and the apparent digestibility coefficients of the crude protein (ADCCP) of the yeasts Table 3 - Amino acid composition of the sugarcane yeasts based on the dry matter
Amino acid, % Yeast
1 2 3 4
Methionine 0.26 0.28 0.19 0.28
Cystine 0.11 0.11 0.08 0.14
Methionine + Cystine 0.38 0.39 0.27 0.43
Lysine 1.25 1.27 0.97 1.40
Threonine 0.97 1.01 0.76 1.07
Arginine 0.76 0.79 0.58 0.97
Isoleucine 0.85 0.88 0.66 0.94
Leucine 1.23 1.28 1.00 1.38
Valine 0.99 1.03 0.82 1.12
Histidine 0.35 0.37 0.28 0.40
Phenylalanine 0.74 0.76 0.58 0.82
Glycine 0.82 0.85 0.65 0.91
Serine 0.89 0.90 0.74 0.99
Proline 0.63 0.68 0.52 0.73
Alanine 1.06 1.12 0.95 1.23
Aspartic acid 1.73 1.78 1.58 1.99
are shown in Tables 5 and 6 respectively. To predict the values for ADCDM and CP, a total of 20 significant models were generated.
To verify the fit of the data, the coefficient of determination (R2) and the Akaike information criterion
(AIC) were used. Some significant models that were generated use the intercept as part of the equation, however, most of the equations did not use the intercept in the model. Janssen (1989), when elaborating the European Table of Energy Values for Poultry, did not take the intercept into consideration, the same as Rostagnoet al. (2011), when elaborating the Brazilian Tables for Poultry and Swine.
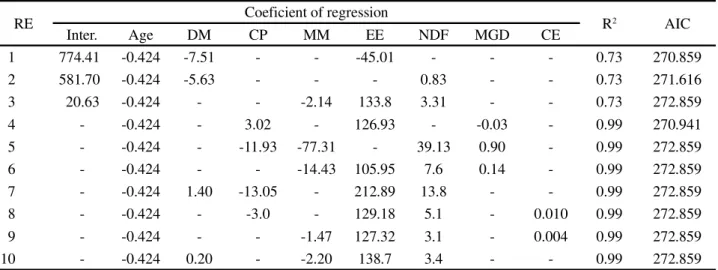
The coefficients of determination of the regression equations (R2) ranged from 0.73 to 0.99 for the ADCDM,
with an AIC of from 270.85 to 272.85; for the ADCCP, the R2 ranged from 0.789 to 0.998, with an AIC of 234.84
to 236.79, using equations with three to five variables. For the predicted values of the ADCDM, among the equations generated using the intercept, Model 1 (ADCDM = 774.4 -0.424*age -7.51*DM -45.01*EE) gave a better fit to the data, considering the value of the coefficient of determination (R2 = 0.73) and the lowest
value for the AIC (270.85). For the equations that did not use the intercept, Model 4 had the best fit (ADCDM =
-0.424*age + 3.02*CP + 126.93* E -0.03*GMD) with R2
= 0.99 and an AIC of 270.94.
For the values predicted for the ADCCP comparing the equations that made use of the intercept, Model 1 (ADCCP = 606.9 -0.428*age -5.8*DM -0.01*GMD) with an R2 of 0.789 and an AIC of 234.84 gave the best fit to
the data. For the equations that did not use the intercept as part of the model, Equation 6 (ADCCP = -0.426*age + 2.6*CP + 139.7*EE -0.03*GMD) best fit the data, with a value for R2 of 0.998 and the smallest value for AIC
(235.47).
High values for the coefficient of determination (R2) were obtained with the remaining equations that used
or did not use the intercept in the models, however, as the AIC was also used, whose criterion of choice is the lowest value, the models that presented both combinations were those that best fit the data, these being chosen to predict a more accurate value.
In the models generated for the ADCDM and ADCCP, with or without the use of the intercept, the age parameter was included in all equations. It can be seen that for each day that the birds age, the values go down on average by 0.424% for the ADCDM and 0.428% for the ADCCP.
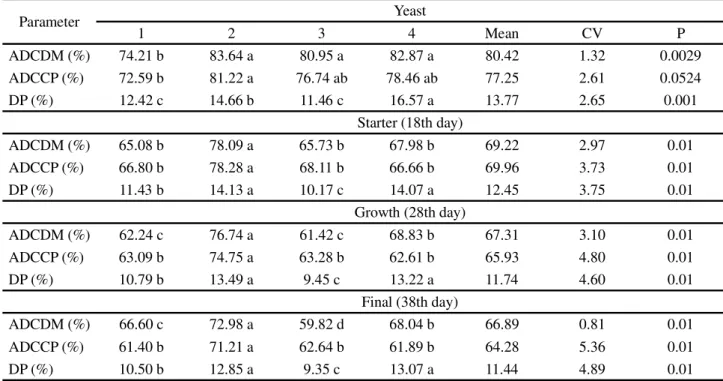
Table 4 - Mean value for the apparent ileal digestibility coefficients of the dry matter and crude protein, and values for digestible protein of the sugarcane yeasts based on the dry matter
* ADCDM - apparent digestibility coefficient of dry matter; * ADCCP - apparent digestibility coefficient of crude protein; * DP - digestible protein; *CV - coefficient of variation; * P - probability; Mean values followed by the same letter in a row do not differ statistically by Tukey’s test at 5% probability
Parameter Yeast
1 2 3 4 Mean CV P
ADCDM (%) 74.21 b 83.64 a 80.95 a 82.87 a 80.42 1.32 0.0029
ADCCP (%) 72.59 b 81.22 a 76.74 ab 78.46 ab 77.25 2.61 0.0524
DP (%) 12.42 c 14.66 b 11.46 c 16.57 a 13.77 2.65 0.001
Starter (18th day)
ADCDM (%) 65.08 b 78.09 a 65.73 b 67.98 b 69.22 2.97 0.01
ADCCP (%) 66.80 b 78.28 a 68.11 b 66.66 b 69.96 3.73 0.01
DP (%) 11.43 b 14.13 a 10.17 c 14.07 a 12.45 3.75 0.01
Growth (28th day)
ADCDM (%) 62.24 c 76.74 a 61.42 c 68.83 b 67.31 3.10 0.01
ADCCP (%) 63.09 b 74.75 a 63.28 b 62.61 b 65.93 4.80 0.01
DP (%) 10.79 b 13.49 a 9.45 c 13.22 a 11.74 4.60 0.01
Final (38th day)
ADCDM (%) 66.60 c 72.98 a 59.82 d 68.04 b 66.89 0.81 0.01
ADCCP (%) 61.40 b 71.21 a 62.64 b 61.89 b 64.28 5.36 0.01
Table 5 - Prediction equations for the apparent digestibility coefficient of dry matter in broiler chickens as a function of the physicochemical composition of the yeasts1
1 - values based on dry matter; Inter. - intercept; RE- regression equation; CP - crude protein; EE - ether extract; MM - Mineral matter; NDF - neutral detergent fibre; MGD - mean geometric diameter; CE - crude energy; R2- coefficient of determination; AIC- Akaike information criterion
RE Coeficient of regression R2 AIC
Inter. Age DM CP MM EE NDF MGD CE
1 774.41 -0.424 -7.51 - - -45.01 - - - 0.73 270.859
2 581.70 -0.424 -5.63 - - - 0.83 - - 0.73 271.616
3 20.63 -0.424 - - -2.14 133.8 3.31 - - 0.73 272.859
4 - -0.424 - 3.02 - 126.93 - -0.03 - 0.99 270.941
5 - -0.424 - -11.93 -77.31 - 39.13 0.90 - 0.99 272.859
6 - -0.424 - - -14.43 105.95 7.6 0.14 - 0.99 272.859
7 - -0.424 1.40 -13.05 - 212.89 13.8 - - 0.99 272.859
8 - -0.424 - -3.0 - 129.18 5.1 - 0.010 0.99 272.859
9 - -0.424 - - -1.47 127.32 3.1 - 0.004 0.99 272.859
10 - -0.424 0.20 - -2.20 138.7 3.4 - - 0.99 272.859
RE Coeficient of regression R2 AIC
Inter. Age DM CP MM EE NDF MGD CE
1 606.9 -0.428 -5.8 - - - - -0.01 - 0.789 234.85
2 -410.6 -0.428 - -1.2 12.3 - - - 0.1 0.789 236.76
3 -408.2 -0.428 - - 11.6 - -0.78 - 0.1 0.789 236.76
4 -312.9 -0.428 - - 8.52 29.9 - - 0.1 0.789 236.76
5 -397.5 -0.428 - - 9.2 - - 0.02 0.1 0.789 236.79
6 - -0.426 - 2.6 - 139.7 - -0.03 - 0.998 235.48
7 - -0.429 - 3.4 -3.3 115 - - - 0.968 235.67
8 - -0.428 - -11.5 -78.1 - 38.4 0.90 - 0.998 236.76
9 - -0.428 1.6 -15.2 - 228.3 14.9 - - 0.998 236.76
10 - -0.428 - - -17.4 102.3 7.94 0.2 - 0.998 236.76
Table 6 - Prediction equations for the apparent digestibility coefficient of crude protein in broiler chicken as a function of the physicochemical composition of yeasts1
1 - values based on dry matter; RE - regression equation; CP - crude protein; EE - ether extract; MM - Mineral matter; NDF - neutral detergent fibre; MGD - mean geometric diameter; CE - crude energy; R2- coefficient of determination; AIC- Akaike information criterion
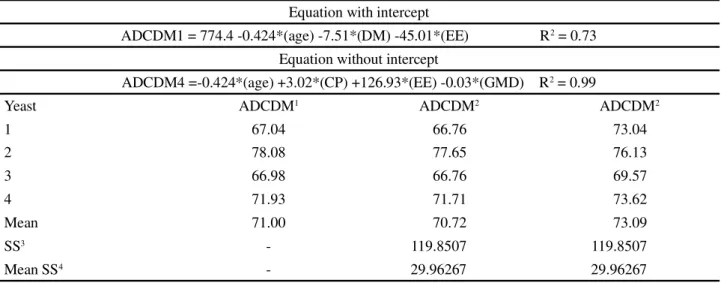
The estimated values for the ADCDM and ADCCP are shown in Tables 7 and 8 respectively, generated using the models that best fit the data for chemical composition. According to Siqueira et al. (2011), prediction models can be evaluated by means of bioessays, by simulation, or by the comparison of predicted values with those seen in real situations, constituting a determining step for verifying model applicability.
Comparing the estimated values for the generated equations with the values determined in the biological
trials for the ADCDM and the ADCCP of the sugarcane yeasts under study, it can be seen that the models, with or without use of the intercept, predict values close to those determined. The mean sum of squares is similar between the models.
Equation with intercept
ADCCP1 =606.9 -0.428*(age) -5.8*(DM) -0.01*(GMD) R2 = 0.789
Equation without intercept
ADCCP6 =-0.426*(age) +2.6*(CP) +139.7*(EE) -0.03*(GMD) R2 = 0.998
Yeast ADCCP1 ADCCP
12 ADCCP62
1 65.97 64.32 69.97
2 76.46 74.83 74.63
3 67.69 65.78 69.50
4 67.40 66.17 68.54
Mean 69.38 67.77 70.66
SS3 - 122.1227 120.984
Mean SS4 - 30.53067 30.246
Table 8 - Estimation of the apparent digestibility coefficient of crude protein by means of the prediction equations, based on the dry matter
1-ADCCP - apparent digestibility coefficient of crude protein, seenin vivo in broiler trials;2- estimates of ADCCP by the prediction equations;3- sum
of squares;4- mean sum of squares
Under such conditions, it is up to the nutritionist to choose the equation to be used in formulating a feed, since the choice will depend on the laboratory analyses available, considering that some of these analyses require more sophisticated equipment that can make the procedure more costly.
This study pioneers prediction of the apparent digestibility coefficients of dry matter and crude protein
by means of regression equations generated from the chemical composition of sugarcane yeast. The literature is scarce concerning the ileal digestibility of the dry matter and crude protein of sugarcane yeast determined with broilers. This work alone will not be sufficient to determine whether the generated equations can accurately predict the values of the digestibility coefficients of all the yeasts on the market, it is therefore necessary that further studies be carried out to clarify their peculiarities.
1-ADCDM - apparent digestibility coefficient of dry matter, seenin vivo in broiler trials;2- estimates of ADCDM by the prediction equations;3- sum
of squares;4- mean sum of squares
Table 7 - Estimation of the apparent digestibility coefficient of dry matter by means of the prediction equations, based on the dry matter
Equation with intercept
ADCDM1 = 774.4 -0.424*(age) -7.51*(DM) -45.01*(EE) R2 = 0.73
Equation without intercept
ADCDM4 =-0.424*(age) +3.02*(CP) +126.93*(EE) -0.03*(GMD) R2 = 0.99
Yeast ADCDM1 ADCDM2 ADCDM2
1 67.04 66.76 73.04
2 78.08 77.65 76.13
3 66.98 66.76 69.57
4 71.93 71.71 73.62
Mean 71.00 70.72 73.09
SS3 - 119.8507 119.8507
CONCLUSIONS
1. The yeasts under study showed variability in their amino acid composition; however, Yeasts 2 and 4 presented a higher percentage of amino acids;
2. The apparent digestibility coefficients of dry matter and crude protein differed between yeasts. For all experimental phases, Yeast 2 presented the highest values for the digestibility coefficient, as well as for the values of digestible protein;
3. It was seen that the ADCDM and ADCCP of the yeasts reduced on average 0.424 and 0.428% respectively for each day the birds aged;
4. Four models, with or without use of the intercept, showed a better fit to the data for physicochemical composition in the equations generated to predict the values of the digestibility coefficients of dry matter and crude protein.
REFERENCES
AKAIKE, H. A new look at the statistical model identification. IEEE Transactions on Automatic Control, v. 19, n. 6, p. 716-723, 1974.
ASSOCIATION OF OFFICIAL ANALYTICAL CHEMISTS. Official methods of analysis. 15th ed. Arlington, VA, 1990.
COBB 500. Suplemento de crescimento e nutrição para frangos de corte. 2012.
FLEMMING, J. S. Utilização de leveduras, probióticos e mananoligossacarídeos (MOS) na alimentação de frangos de corte. 2005. 109 f. Tese (Doutorado em Tecnologia de Alimentos) - Universidade Federal do Paraná, Curitiba, 2005.
FREITAS, E. R.et al. Substituição do farelo de soja por levedura
de cana-de-açúcar em rações para frangos de corte. Revista Ciência Agronômica, v. 44, n. 1, p. 174-183, 2013.
JANSSEN, W. M. A.European table of energy values foe poultry feedstuffs. 3. ed. Beekbergen: World Poultry Science Association, 1989. 84 p.
LOPES, C. C.et al. Desempenho, digestibilidade, composição
corporal e morfologia intestinal de pintos de corte recebendo dietas contendo levedura de cana-de-açúcar.Acta Scientiarum. Animal Sciences, v. 33, n. 1, p. 33-40, 2011.
LOPES, C. C.et al. Energia metabolizável da levedura de cana-de-açúcar submetida a diferentes temperaturas e tempos de secagem para frangos de corte e poedeiras.Arquivo Brasileiro de Medicina Veterinária e Zootecnia, v. 67, n. 6, p. 1711-1720, 2015.
MARTINS, M. S. Leveduras de cerveja e cana-de açúcar (saccharomyces cerevisiae), autolisada e íntegra, na dieta de cães. 2009. 93 f. Dissertação (Mestrado em Zootecnia) - Universidade Estadual Paulista “Júlio de Mesquita Filho”, Faculdade de Ciências Agrárias e Veterinárias, Jaboticabal, 2009.
NASCIMENTO, E. R.et al.Equações de predição para estimar
os valores energéticos de alimentos concentrados de origem vegetal para aves utilizando a metanálise.Revista Brasileira de Zootecnia, v. 38, n. 7, p. 1265-1271, 2009.
NATIONAL RESEARCH COUNCIL.Nutrient requirements of poultry. 9. ed. Washington: National Academy Press, 1994. 155 p.
NERY, L. R.et al.Valores de energia metabolizável de alimentos
determinados com frangos de corte. Revista Brasileira de Zootecnia, v. 36, n. 5, p. 1354-1358, 2007.
ROSTAGNO, H. S.e al. Avanços metodológicos na avaliação
de alimentos e de exigências nutricionais para aves e suínos. Revista Brasileira de Zootecnia, v. 36, p. 295-304, 2007. Suplemento especial.
ROSTAGNO, H. S. et al. Tabelas brasileiras para aves e
suínos: composição de alimentos e exigências nutricionais. 3. ed. Viçosa, MG: UFV, 2011. 252 p.
RUTZ, F. et al. Desempenho e características de carcaças de
frangos de corte recebendo extrato de leveduras na dieta.Ciência Animal Brasileira, v. 7, n. 4, p. 349-355, 2006.
SAS INSTITUTE.Statistical Analysis System. Version 9.1.3. Cary, NC, USA: SAS Inc., 2008.
SILVA, R. B.et al. Composição química e valores de energia metabolizável subprodutos agroindustriais determinados com diferentes aves.Acta Scientiarum. Animal Science, v. 30, n. 3, p. 269-275, 2008.
SILVA, V. K. et al.Digestibilidade do extrato de leveduras
em frangos de corte.Revista Brasileira de Zootecnia, v. 38, n. 10, p. 1969-1973, 2009.
SIQUEIRA, J. C. et al. Equações de predição da energia
metabolizável da torta de babaçu para frangos de corte. Revista Brasileira de Saúde e Produção Animal, v. 12, n. 4, p. 1015-1025, 2011.
UNIÃO DAS INDÚSTRIAS DE CANA-DE-AÇÚCAR.
2015. Disponível em: <http://www.unicadata.com.br/listagem. php?idMn=88>. Acesso em: 22 dez. 2105.
ZANOTTO, D. L.; BELLAVER, C.Método de determinação da granulometria de ingredientes para uso em rações de suínos e Aves. Concórdia: Embrapa: CNPSA, 1996. (EMBRAPA-CNPSA. Comunicado Técnico, 215). Disponível em: <http:// www.cnpsa.embrapa.br/sgc/sgc_publicacoes/cot215.pdf>. Acesso em: 22 dez. 2015.