Nucleotide diversity and molecular evolution of the
WAG-2
gene in common
wheat (
Triticum aestivum
L) and its relatives
Shuhong Wei
1,2, Zhengsong Peng
1,2, Yonghong Zhou
1, Zaijun Yang
2, Kai Wu
2and Zhongming Ouyang
2 1Triticeae Research Institute, Sichuan Agricultural University, Wenjiang, Chengdu City, Sichuan,
People’s Republic of China.
2
Key Laboratory of Southwest China Wildlife Resources Conservation, China West Normal University,
Nanchong City, Sichuan, People’s Republic of China.
Abstract
In this work, we examined the genetic diversity and evolution of theWAG-2 gene based on new WAG-2 alleles iso-lated from wheat and its relatives. Only single nucleotide polymorphisms (SNP) and no insertions and deletions (indels) were found in exon sequences ofWAG-2 from different species. More SNPs and indels occurred in introns than in exons. For exons, exons+introns and introns, the nucleotide polymorphismpdecreased from diploid and tetraploid genotypes to hexaploid genotypes. This finding indicated that the diversity ofWAG-2 in diploids was greater than in hexaploids because of the strong selection pressure on the latter. All dn/ds ratios were < 1.0, indicat-ing thatWAG-2 belongs to a conserved gene affected by negative selection. Thirty-nine of the 57 particular SNPs and eight of the 10 indels were detected in diploid species. The degree of divergence in intron length amongWAG-2 clones and phylogenetic tree topology suggested the existence of three homoeologs in the A, B or D genome of com-mon wheat. WheatAG-like genes were divided into WAG-1 and WAG-2 clades. The latter clade contained WAG-2, OsMADS3 and ZMM2 genes, indicating functional homoeology among them.
Key words:copy number variation, genetic diversity, molecular evolution,Triticum,WAG-2.
Received: March 27, 2011; Accepted: July 12, 2011.
Introduction
Common wheat (Triticum aestivum, 2n = 6x = 42, AABBDD) is an allohexaploid formed by two processes of hybridization and successive chromosome doubling (Feuilletet al., 2001; Huanget al., 2002; Guet al., 2004; Petersen et al., 2006). The initial hybridization was be-tweenTriticum urartu (the diploid ancestor of the A ge-nome, 2n = 2x = 14, AA) and Aegilops speltoides (the diploid ancestor of the B genome, 2n = 2x = 14, SS). This process resulted in tetraploid wheat (2n = 4x = 28, AABB) that subsequently hybridized withAegilops tauschii (the diploid ancestor of the D genome, 2n = 2x = DD) to produce hexaploid common wheat.
The success of polyploid plants is often attributed to their genomic characteristics, including genomic stability, chromosomal rearrangement, genome size and differential gene expression (Solticset al., 2003). In addition, nucleo-tide diversity is always generated in the course of poly-ploidy. Nucleotide diversity in wheat reflects the rich history of human selection and migration combined with a
high level of recombination and out-breeding characteristic of this species. In the past decades, DNA markers such as RAPD, AFLP, and SSR have been extensively used for fin-gerprinting and exploring the genetic diversity and evolu-tionary relationships of wheat genetic resources. Although these molecular techniques are constantly being improved, in recent years several highly efficient and economic proto-cols have been introduced to differentiate closely related wheat species and their relatives.
Single nucleotide polymorphisms (SNP) are the most abundant type of variation in DNA sequences in all ge-nomes studied to date (Brookes, 1999) and are considered last-generation molecular markers. SNPs are the most valu-able molecular markers for research and application, in-cluding the detection of risk-associated alleles linked to human diseases, the study of evolutionary conservation among species, gene mapping and cloning, and crop breed-ing. The discovery of SNPs usually relies on re-sequencing alleles from different individuals or comparing the se-quences to a reference sequence.
Wheat is the most important food crop in the world. The increase in the global human population and the very limited availability of suitable farmland make it essential to improve wheat yields. Wheat floral organs provide the
ba-Send correspondence to Zhengsong Peng. Triticeae Research In-stitute, Sichuan Agricultural University, Wenjiang, Chengdu City 611130 Sichuan, People’s Republic of China. E-mail: pzs8833@163.com.
sis for grain formation such that wheat yield and quality are directly influenced by floral organ development. Hence, understanding wheat floral development is important for improving wheat yield. Past research has been limited to the morphological description and physiology of flower-ing, whereas recent developments in molecular genetics have led to studies of flower development at a molecular level. Some MADS-box cDNA sequences, such asWAP-1,
WAP-2, WAP-3, WPI1, WPI2, WAG-1, WAG-2 and
TaMADS1,have been identified (Muraiet al., 1998, 2002, 2003; Hamaet al., 2004; Zhaoet al., 2006; Mizumotoet al., 2009; Shimadaet al., 2009). Ciaffiet al.(2005) described the cloning and expression analysis of eight MADS-box cDNA sequences, and Zhao et al. (2006b) reported the characterization and expression of 42 wheat MADS-box gene sequences. Shitsukawaet al.(2007) undertook a de-tailed structural, expression and functional analysis of the homoeologous sequences of two wheat SEP-like genes. Paolacci et al. (2007) cloned 45 full-length MIKC-type MADS-box cDNA sequences of common wheat and stud-ied their expression and function.
WAG -2, a class C MADS-box gene, has been isolated from the wheat expressed sequence tag (EST) database (Ogihara et al., 2003). Compared to other MADS-box genes, few studies have compared the sequences and inves-tigated the evolutionary dynamics ofWAG-2.In this study, we partially cloned theWAG-2gene from wheat and its rel-atives and used the data (1) to analyze the sequence charac-teristics and investigate the inter-specific variability of the WAG-2gene, and (2) to examine the relationship between theWAG-2gene in common wheat and related species and other AG-like genes from different species.
Materials and Methods
Plant materials and DNA isolation
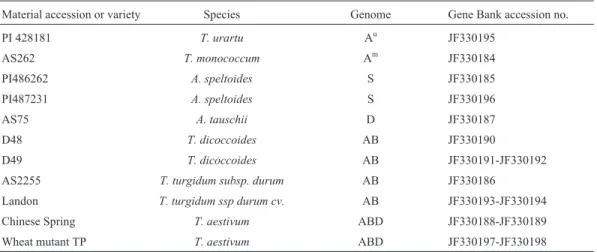
One accession each of Triticum monococcum (2n = 2x = 14, AmAm),T. urartu, (2n = 2x = 14, AuAu) and
A. tauschii (2n = 2x = 14, DD), two accessions of A. speltoides(2n = 2x = 14, SS), four accessions of tetraploid wheat (2n = 2x = 28, AABB) and two accessions ofT. aestivum(2n = 6x = 42, AABBDD) were used (Table 1). All seeds were provided by Dr. Dengcai Liu of Sichuan Ag-riculture University, Yaan , Sichuan, China. Genomic DNA was extracted from fresh leaves by the modified CTAB procedure (Doyle and Doyle, 1987).
PCR amplification and sequencing
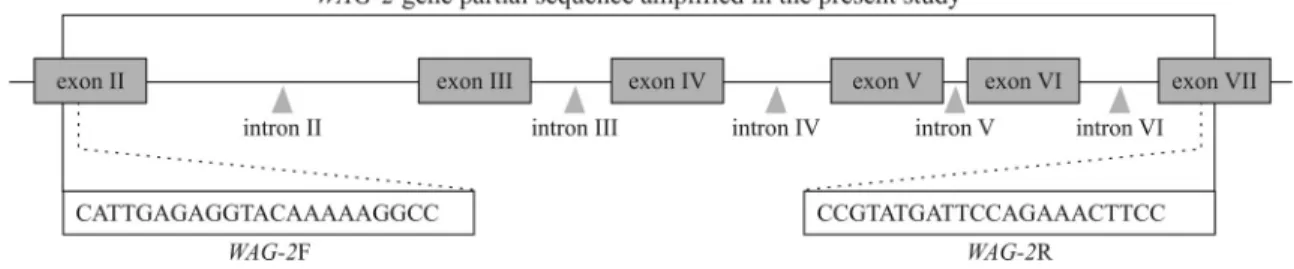
The gene sequence data ofWAG-2(AB465688) were obtained from NCBI (http://www.ncbi.nlm.nih.gov). Spe-cific primers used for partial amplification of theWAG-2 gene were designed with Primer Premier 5.0 (Clarke and Gorley 2001). The forward primer was WAG-2F (5’-CATTGAGAGGTACAAAAAGGCC-3’) and the re-verse primer wasWAG-2R (5’-CCGTATGATTCCAGAA ACTTCC-3’). Figure 1 schematically shows the partial se-quence of theWAG-2gene and the location of the primers. Using the primersWAG-2F andWAG-2R, the region from exon II to exon VII of theWAG-2gene was amplified in dif-ferent species. PCR amplification was done in a thermo-cycler (My-Cycler; Bio-Rad, San Diego, CA, USA) in a volume of 50mL containing approximately 100 ng of tem-plate DNA, 100mM each of dNTP, 1.5 mM Mg2+, 1 U of TaqDNA polymerase, 0.4mM of each primer and 1 x PCR buffer. The PCR cycling included pre-denaturation at 94 °C for 5 min followed by 35 cycles of 94 °C for 1 min, 60 °C for 1 min and 72 °C for 2 min, and a final extension at 72 °C for 5 min. The amplified products were visualized by gel electrophoresis in 1% agarose gels and then documented with a Gel Doc 2000TM system (Bio-Rad). The target DNA bands were recovered and purified from the gels us-ing Qiaquick Gel extraction kits (QIAGEN, Shanghai, Chi-na). The purified PCR products were cloned in the pMD19T vector according to the manufacturers instructions (Takata, Dalian, China). Transformants were plated on LB agar con-taining ampicillin. Clones with inserts were identified
us-Table 1- Plant materials ofTriticumandAegilopsaccessions used in this study.
Material accession or variety Species Genome Gene Bank accession no.
PI 428181 T. urartu Au JF330195
AS262 T. monococcum Am JF330184 PI486262 A. speltoides S JF330185 PI487231 A. speltoides S JF330196
AS75 A. tauschii D JF330187
D48 T. dicoccoides AB JF330190
D49 T. dicoccoides AB JF330191-JF330192 AS2255 T. turgidum subsp. durum AB JF330186
ing blue/white colony selection. Positive clones were then screened and sequenced by Taihe Biotechnology Co. Ltd. (Beijing, China). In total, 56 clones of 11 accessions be-longing to eight species were sequenced using the universal M13 forward and reverse primers. The partial nucleotide sequences of 15WAG-2gene haplotypes were submitted to GenBank at NCBI. The GenBank accession number of each nucleotide sequence is listed in Table 1.
Nucleotide diversity estimate
Fifteen partialWAG-2gene sequences were verified and corrected. The complementary strands were assembled using DNAman 5.2.2 software (Lynnon Biosoft Compa-ny). To confirm whether the sequences wereWAG-2 homo-eologs, the coding regions were compared with WAG-2 gene sequences available in GenBank using BLAST searches (Altschulet al., 1990). Nucleotide sequence align-ments were done using ClustalW (Thompsonet al., 1994) and then optimized using SeaView version 4.1 (Galtieret al., 1996). The alignments were refined manually using the GeneDoc program (Nicholasand Nicholas,1997) in order to maximize the positional homoeology. To reduce the pos-sible effect of PCR artifacts, unique substitutions in single clones were ignored. Several sequences were represented by a single original sequence in alignments.
Exon+intron, exon, and intron sequences from dip-loid, tetraploid and hexaploid species were used to estimate nucleotide diversity based on the calculation ofp as de-scribed by Tajima (1989). The value ofp quantifies the mean percentage of nucleotide difference among all pair-wise comparisons for a set of sequences. Thepvalues of non-synonymous (dn) or synonymous (ds) differences and the mean dn/ds ratios were also estimated (Nielsen and Yang, 1998). These parameters were calculated using DnaSP 4.10.9 (Rozaset al., 2003).
Phylogenetic analysis
The 15 partialWAG-2gene sequences were also used to construct phylogenetic trees. Neighbor-joining and max-imum likelihood trees were generated with MEGA soft-ware version 5.0 (Saitou and Nei, 1987; Tamura et al., 2007) with 1000 bootstrap replicates. Gaps were treated as missing values.
Alignment of the corresponding amino acid se-quences of the 15WAG-2genes, along with other MADS-box genes included in theAGgroup from several species, was done using ClustalW (Thompsonet al., 1994). Phylo-genetic trees of the MADS-box genes were then con-structed using the neighbor-joining and maximum likelihood methods. The amino acid sequences of MADS-box genes fromArabidopsis(AG: X53579), Antir-rhinum (PLE: S53900), maize (ZAG1: L18924, ZMM2: L81162), barley (HvAG1: AF486648, HvAG2: AF486649), rice (OsMADS3: L37528, OsMADS58: FJ750942) and wheat (WAG-1: AB084577; WAG-2: AB465688; WM29A: AM502898; WM29B: AM502899;
TaAGL39: DQ512355) were obtained from NCBI.
Results
Characteristics of the partialWAG-2gene sequences and genomic structure
Partial sequences of theWAG-2gene were amplified and sequenced from different species using the primers WAG-2F andWAG-2R. The sequences were deposited in GenBank under accession numbers JF330184 to JF330198. BLAST searches, which explored the coding region of each sequence, confirmed the cloned sequences to be homoeo-logs of theWAG-2orthologs found in GenBank. Sequence comparisons showed that the 15 partial sequences of the species studied had similar structures, including six exons and five introns (Figure 1). The exon+intron lengths ranged from 1824 to 1899 bp among species. The total length of the six exons studied was 425 bp. The five introns fulfilled theGT-AGrule, but they varied markedly in length and se-quence composition. The length of intron II was 938-964 bp, which was longer than the other four introns. The lengths of intron III were 98, 95 and 94 bp for genomes AA, BB and DD, respectively. For AABB tetraploids (T.
dicoccoides and T. turgidum ssp durum cv.) and the
AABBDD hexaploid (T. aestivum) the length of intron III was 98 and 95 bp, respectively. Introns IV, V and VI also showed marked variations in length. The lengths of intron IV were 151, 193 or 206, and 231 bp for the AA, SS and DD genome diploids, respectively; two of these lengths (151 and 193 bp) were also observed for intron IV in AABB tetraploids (T. dicoccoidesandT. turgidum ssp durum cv.) and the AABBDD hexaploid (T. aestivum), respectively.
Intron V had three lengths,i.e., 102, 100, and 92 bp, as did intron VI,i.e., 106, 102 and 72 bp (Table 2).
Inter-specific variation in the partial sequences of the
WAG-2gene
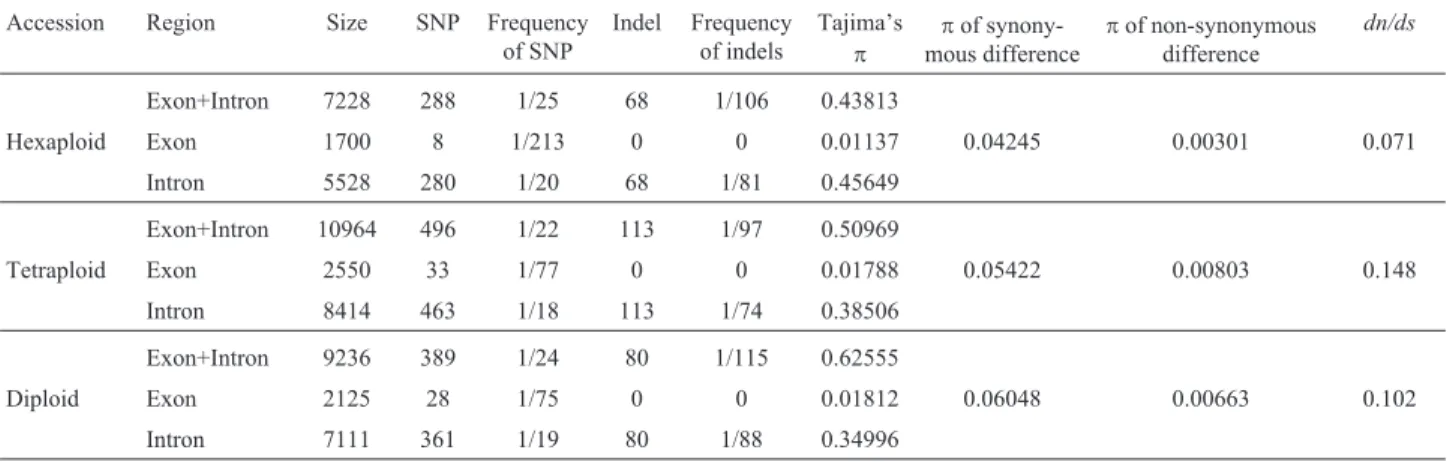
Table 3 summarizes theWAG-2 sequence variation identified in this study. The nucleotide variation in exons was generally less than in introns because of strong con-straints.
In four haplotypes from two accessions of the hexa-ploid, 288 SNPs and 68 indels were identified from 7228 bp sequences (average of 1 SNP/25 bp and 1 indel/106 bp). A total of 288 SNPs were shared by 146 loci of theWAG-2 se-quences cloned. Only eight SNPs (polymorphic rate of 1 SNP/213 bp) were detected in the exon region (Table 3). Seven SNPs (87.5% of total) were in exon IV. The intron region contained 280 SNPs (1 SNP/20 bp). All 68 indels were detected in the intron region. Forty indels were found in intron II and were involved in 18 sites (1 indel site/53 bp). Two indels located in intron III belonged to one site (1 indel site/96 bp). In intron IV, there were 24 indels shared by eight sites (1 indel site/21 bp). Finally, two indels in intron V were shared by one site (1 indel site/96 bp). The indel mutation of a single nucleotide in intron VI was de-tected only at one site; indel mutations at the other seven sites were mainly large fragment aberrations involving at
least two nucleotides (Figure S1). The high polymorphic rates of SNPs and large fragment aberrations meant that exon IV and intron IV were two hotspots for theWAG-2 gene in hexaploid genotypes.
496 SNPs and 113 indels were identified from 10,964 bp sequences in the six haplotypes from four tetra-ploid accessions, which yielded an average of 1 SNP/22 bp and 1 indel/97 bp, respectively (Table 3). Among the 33 SNPs in the exon region, 18 SNPs (54.5%) were in exon VII. 463 SNPs were detected in the intron region (1 SNP/18 bp). The intron region had 113 indels associated with 31 sites; intron IV had 35 indels with a higher fre-quency (1 indel site /21 bp) than the others. Consequently, highly polymorphic SNP was detected in exon VII. Intron IV also had a high frequency of indels (Figure S1).
389 SNPs and 80 indels were identified in 9,236 bp sequences in five haplotypes from the five diploid acces-sions (1 SNP /24 bp and 1 indel /115 bp, respectively) (Ta-ble 3). The highest frequency of SNPs occurred in exon VII, which had 64.4% (18 out of 28) SNPs. The indel fre-quency in intron IV (1 indel site/24 bp) was higher than in the other four introns. Apparently, exon VII and intron IV are two mutation hotspots for theWAG-2gene in diploid genotypes.
Table 3 shows the nucleotide polymorphismp for synonymous differences, non-synonymous differences and
Table 2- Characteristics of theWAG-2 partial sequences among different species (length of each feature given in bp).
Species Exon II (partial)
Intron II Exon III Intron III Exon IV Intron IV Exon V Intron V Exon VI Intron VI Exon VII (partial)
Exon+Intron
T. monococcum 70 945 62 98 103 151 42 102 42 110 106 1831
T. urartu 70 938 62 98 103 151 42 102 42 110 106 1824
A. speltoides 70 951/964 62 95 103 193/206 42 92 42 72 106 1828/1854
A. tauschii 70 951 62 94 103 231 42 92 42 106 106 1899
T. turgidum subsp. durum 70 944 62 98 103 151 42 102 42 110 106 1830
T. dicoccoides 70 938/951 62 98/95 103 151/193 42 102/92 42 110/72 106 1824/1828 T. turgidum ssp durum cv. 70 940/951 62 98/95 103 151/193 42 102/92 42 110/72 106 1826/1828
T. aestivum 70 940/951 62 98/95 103 151/193 42 100/92 42 72 106 1786/1828
Table 3- SNPs and indels of theWAG-2partial sequences identified in all accessions and comparison of genetic diversity.
Accession Region Size SNP Frequency of SNP
Indel Frequency of indels
Tajima’s
p
pof synony-mous difference
pof non-synonymous difference
dn/ds
Exon+Intron 7228 288 1/25 68 1/106 0.43813
Hexaploid Exon 1700 8 1/213 0 0 0.01137 0.04245 0.00301 0.071
Intron 5528 280 1/20 68 1/81 0.45649
Exon+Intron 10964 496 1/22 113 1/97 0.50969
Tetraploid Exon 2550 33 1/77 0 0 0.01788 0.05422 0.00803 0.148
Intron 8414 463 1/18 113 1/74 0.38506
Exon+Intron 9236 389 1/24 80 1/115 0.62555
Diploid Exon 2125 28 1/75 0 0 0.01812 0.06048 0.00663 0.102
mean dn/ds in exons+introns, exons and introns. The nucle-otide polymorphismpwas lowest in hexaploids and high-est in diploids. The values ofpfor synonymous differences were lowest in hexaploids (0.04245) and highest in diploids (0.06048). The values ofpfor non-synonymous differences were 0.00301, 0.00803 and 0.00663. The mean dn/ds for all coding regions was < 1.
Point mutations involve transitions between purines (A and G) or pyrimidines (C and T), but may also involve transversions or changes between purines and pyrimidines. Table 4 shows the types of base substitutions in SNPs in different species. The exon+intron Ti/Tv ratio was 0.84:1, 0.88:1 and 0.96:1 for hexaploid, tetraploid and diploid ge-notypes, respectively. In exons, the main point mutations involved transitions, with Ti/Tv ratios of 3, 5.6 and 4.6. The ratio of A«Gvs.C«T mutations was approximately 1 in hexaploid genotypes. In contrast, in tetraploid and diploid genotypes the main transition was A«G, with the ratio of A«Gvs.C«T transitions being 2.1 and 1.3, respec-tively. In introns, the ratio of A«Gvs.C«T transitions was 0.95 for hexaploid genotypes. The difference between tetraploid and diploid genotypes was that their ratios of A«Gvs.C«T transitions were 1.14 and 1.07, respec-tively.
Based on the different species studied, 57 particular SNP mutations were identified, with seven (12.3%), 11 (19.3%) and 39 (68.4%) in hexaploid, tetraploid and dip-loid genotypes, respectively. Of the 39 SNPs, six SNPs were found in species of genome AA whereas 13 belonged to species of genome BB. Twenty SNPs were specific in species of genome DD. A common feature of these findings was that the main type of base substitution involved transi-tions among species. In exons, only transitransi-tions were de-tected among the species, and in introns the main substitutions in particular SNPs were also transitions. Seven SNPs from hexaploid genotypes were all transitions. Seven out of 11 SNPs were transitions from tetraploid ge-notypes. Diploid genotypes also had 24 SNPs, of which 66.7% were transitions. In addition, several specific SNPs shared by four sites were detected in groups A, B and D genomes.
Phylogenetic analyses of the partial sequences
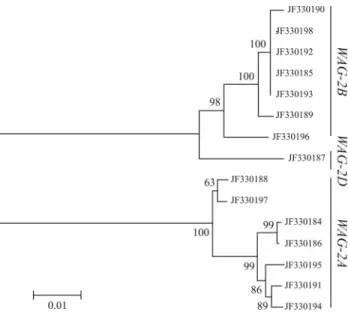
The first series of phylogenetic analyses, which was done using the 15WAG-2gene sequences and the MEGA
program, resulted in two phylogenetic trees generated by different algorithms. The topologies of the two phylogen-etic trees were very similar to each other. A neighbor-joining tree (Figure 2) indicated that the WAG-2 genes formed three major clades (I, II and III). Clade I, referred to as the A genome group ofWAG-2(although it may include the B genome), contained seven sequences from the AA diploid (T. monococcum,T. urartu), AABB tetraploid (T. turgidum, T. dicoccoides) and AABBDD hexaploid (T. aestivum) genomes. This clade was called WAG-2A be-cause all of the species belonging to the clade contained the A genome. This clade also contained seven sequences with identical lengths in introns III (98 bp), IV (151 bp) and V (102 bp and 100 bp inT. aestivum). These seven sequences showed high sequence identity with 81 SNPs. Only 19 SNPs were shared by 12 sites in exons. Clade II, referred to asWAG-2B, contained seven sequences from the BB dip-loid (A. speltoides), AABB tetraploid (T. turgidum, T.
dicoccoides) and AABBDD hexaploid (T. aestivum)
genomes. In this clade, the lengths of introns III, IV and V in the seven sequences were 95, 193 and 92 bp, respec-tively. High sequence identities were also detected in the seven sequences with 45 SNPs, in which only two SNPs were shared by two sites in the exons. Lastly, clade III,
re-Table 4- Base type substitutions in SNPs.
Accession G«T A«C A«G C«G A«T C«T Ts/Tv*
Hexaploid 24 41 62 32 54 65 0.84:1
Tetraploid 44 69 128 51 100 104 0.88:1
Diploid 31 52 100 43 72 92 0.96:1
*Ts: transitions, Tv: transversions.
ferred to asWAG-2D, contained only one sequence from the DD diploid genome (A. tauschii).
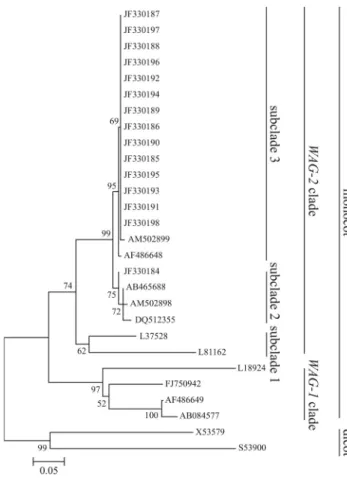
To examine the relationships among wheatAG-like genes, the 15WAG-2genes and otherAGgroup genes were analyzed phylogenetically. The neighbor-joining and max-imum likelihood trees were reconstructed using amino acid sequences. The neighbor-joining tree is shown in Figure 3. Both phylogenetic trees were very similar to each other and differed only in the positions of ZAG1 (L18924) and OsMADS58(FJ750942). The neighbor-joining tree indi-cated that theAGgroup was classified in dicot and monocot clades. Monocot genes were subdivided intoWAG-1and
WAG-2 clades. The WAG-1 clade consisted of barley
HvAG2, rice OsMADS58 and maize ZAG1, while the
WAG-2clade consisted of barleyHvAG1, riceOsMADS3 and maizeZMM2. TheWAG-2clade was divided into three subclades: OsMADS3 and ZMM2 were included in subclade 1,WAG-2(JF330184, AB465688),WM29Aand
TaAGL39 were clustered in subclade 2, and the other
WAG-2genes that were amplified in this study, along with WM29BandHvAG1, were clustered in subclade 3.
Discussion
Nucleotide diversity ofWAG-2in different species
Most protein-coding nuclear genes of plants have exons and introns. Exons, which are usually under strong selection pressure that eliminates deleterious mutations, have a relatively slow rate of nucleotide substitution whereas, unlike chloroplast genes, the introns of nuclear genes have a higher rate of nucleotide substitution (Gaut, 1998). As shown here, all exons of theWAG-2gene shared high sequence similarities. Only SNPs were found in the exons of different species; there were no indels. Compared with exons, the introns showed greater inter-specific poly-morphism. In all species, there were more SNPs in introns than in exons because of the stronger selection pressure in the latter compared to the former.
The frequencies of SNPs and indels were analyzed in hexaploid, tetraploid and diploid species. In exons+introns, the frequency of SNPs among hexaploids (1 SNP/25 bp), tetraploids (1 SNP/22 bp) and diploids (1 SNP/24 bp) was similar. Likewise, there were no marked differences in the frequency of indels among hexaploids (1 indel/106 bp), tetraploids (1 indel /97 bp) and diploids (1 indel /117 bp). SNPs are the most abundant form of variation in all genomes studied to date. Plant SNPs in genomic regions are at least as abundant as in humans. Preliminary estimates range from 1 SNP/60 bp in outbreeding maize (Chinget al., 2002) to 1 SNP/300 bp for inbreeding rice andArabidopsis (Schmidet al., 2003). Some plant species also display a large number of indels (Bhattramakkiet al., 2002; Rafalski, 2002). In the present study, the frequencies of SNPs and indels among different species were higher than those re-ported in most other plants. This may reflect the fact that the exon+intron region investigated here corresponded to the most polymorphic region of WAG-2 genome DNA. This conclusion agrees with the detection of hotspot re-gions, such as exon IV in hexaploid species and exon VII in tetraploid and diploid species (high rate of SNP variation), and intron IV, which had a high indel mutation rate in dif-ferent species.
Strong selection pressure is important in decreasing the nucleotide diversity of some plant species. Most studies on the effect of selection pressure on nucleotide diversity have focused on domesticated crops and on comparing the diversity between wild relatives and cultivars. During the selection of advantageous phenotypes, some crops appear to pass through bottlenecks that substantially reduce diver-sity (Doebley, 1992). In contrast, many grass domesticates have undergone moderate decreases in diversity compared with their wild relatives (Buckleret al., 2001). In the pres-ent study, the nucleotide diversity of theWAG-2gene dur-ing the evolution of common wheat was estimated by
Figure 3- Neighbor-joining phylogenetic tree ofAGgroup MADS-box genes. Predicted amino acid sequences of the partial coding region were obtained from the NCBI: X53579 (AG) fromArabidopsis, (S53900)PLE
calculating p using the method employed by Tajima (1989). For exons,pwas 0.01812, 0.01788 and 0.01137, in-dicating that polymorphism was 1 SNP/55 bp, 1 SNP/56 bp and 1 SNP/88 bp between two homoeologous chromo-somes in diploid, tetraploid and hexaploid species, respec-tively. For the exon+intron and intron regions, there was a common trend in that nucleotide polymorphism p de-creased from diploid and tetraploid to hexaploid genotypes. These results indicate that the nucleotide diversity of the WAG-2gene in hexaploid species was lower than in diploid species. Hexaploid species probably suffered from long, strong artificial selection pressure that reduced nucleotide diversity.
The dn/ds ratio represents the selection effect and its direction. A dn/ds ratio < 1.0 indicates negative selection and a conserved gene, whereas a dn/ds ratio > 1.0 indicates posi-tive selection and a gene susceptible to rapid evolutionary change. All of the dn/ds ratios calculated here were < 1.0, in-dicating thatWAG-2is a conserved gene affected by nega-tive selection (Nielsen, 2005). Furthermore, the dn/ds ratio was lowest among hexaploids and highest among diploids. This result implies that theWAG-2gene experienced rapid changes in its genome during the evolution of common wheat. The selection pressure was weak among diploid and tetraploid species, whereas natural and artificial selection pressure were stronger among hexaploid species.
Transitions generally occur more frequently than transversions such that the rate of transitions in DNA se-quences differs from that of transversions. In mammalian nuclear DNA, transition mutations are approximately twice as frequent as transversions (Gojoboriet al., 1982; Liet al., 1984; Cargillet al., 1999; Lindblad-Tohet al., 2000; Ro-senberget al., 2003). In contrast to the moderate transition bias observed in mammalian nuclear DNA, transitions are approximately 15 times as frequent as transversions in hu-man mitochondrial DNA (Brownet al., 1982; Tamura and Nei, 1993). Transition bias also occurs in plant nuclear DNA. Transitions are about twice as frequent as trans-versions in rice (Hayashiet al., 2004) and maize (Batleyet al., 2003). As shown here, the Ts/Tv ratio of theWAG-2 gene partial sequences was nearly 1:1. The characteristics of transition bias suggest that the transition frequency was probably higher in other regions of the WAG-2 genome DNA. These regions may not have been detected and should be studied in future research based on the overall WAG-2genome DNA. There was also a gradual decrease in the Ts/Tv ratio of theWAG-2gene partial sequences, from diploid and tetraploid to hexaploid species, especially in the exon region. Additional investigations on how transitions and transversions occur in theWAG-2gene of hexaploid wheat should improve our understanding of the molecular evolution of this gene. The A«G to C «T ratio was larger in tetraploid and diploid genotypes (> 1) than in hexaploid genotypes (approximately 1 or < 1). This finding implies a higher level of monthycation in hexaploid
geno-types than in tetraploid or diploid species since most cyto-sines in CpG can be monthycated and changed into thymine through deamination.
57 specific SNP mutations were identified, of which 39 belonged to diploid species. Eight of 10 indels were also detected in diploid species. These SNPs and indels can be used as specific molecular markers. Those specific SNPs and indels in diploid species may persist for longer than in tetraploid or hexaploid species and have a long evolution-ary history, which could explain why the number of spe-cific SNPs and indel mutations decreases with the increase of ploidy. There is also the possibility that the specific SNPs and indel mutations may occur later than common variants. As suggested by population genetics theory, in contrast to common variants, rare variants are more likely to be recently derived and therefore more likely to be popu-lation-specific (Stephenset al., 2001).
Copy number of theWAG-2gene
The partial sequences of theWAG-2gene cloned from different species were assigned to three genomes: AA, BB and DD. TheWAG-2gene of common wheat (T. aestivum L.) can also be copied to A, B and D genomes. The degree of divergence in the length of introns amongWAG-2clones suggests conclusively that more than one copy ofWAG-2is present in hexaploid or tetraploid species (Table 2). In the A or B genome group ofWAG-2, sequences with high identi-ties were clustered inWAG-2A,WAG-2BandWAG-2D. A previous study by Paolacciet al.(2007) revealed the possi-bility of three homoeologs in the A, B or D genome of com-mon wheat. Most nuclear genes are considered members of multi-gene families (Visionet al., 2000; Martin and Burg, 2002). The differences between two products within a taxon could be attributed to differences in the introns alone, as indicated elsewhere (Grobet al., 2004). This finding proves that the number of copies ofWAG-2is an important consideration for future work. Functional diversification of the three homoeologs should also be examined in subse-quent research.
Phylogenetic relationships amongAG-like genes
The two phylogenetic trees using different algorithms had very similar topologies, thus confirming the validity of the phylogenetic analysis. Most MADS-box genes are or-ganized into distinct gene groups that share similar func-tions in regulating plant development (Puruggananet al., 1995; Theissenet al., 1996). WheatAG-like genes were grouped intoWAG-1andWAG-2clades (Figure 3), indicat-ing that wheatAG orthologs were duplicated in monocot wheat species and showed functional differentiation.
WAG-1, ZAG1, OsMADS58 and HvAG2 were clustered
an important role in determining floral meristem and in reg-ulating carpel morphogenesis (Yamaguchi et al., 2006). WheatWAG-1transcripts preferentially accumulate in de-veloping spikes during the late stages, suggesting that WAG-1 is involved in the development of floral organs (Meguroet al., 2003).
WAG-2genes, together withOsMADS3andZMM2,
were clustered in theWAG-2clade (Figure 3), indicating functional homoeology among them. OsMADS3 plays a more predominant role in inhibiting lodicule development and in specifying stamen identity (Kang et al., 1995). ZMM2participates in regulating the formation of stamens and carpels (Menaet al., 1996).WAG-2has been isolated from a wheat EST database (Ogiharaet al., 2003), however its function remains unknown. WAG-2 transcripts have been preferentially detected in the central region of pistils but not in developing stamens during floral organ develop-ment (Mizumotoet al., 2009). Future work should examine the functional role ofWAG-2in the development of the flo-ral organ in wheat. Apart from the WAG-2 gene (JF330184), other WAG-2 genes (JF330185-JF330198) clustered with WM29B (AM502899) and HvAG1 (AF486648)in a single subgroup, probably because of their functional similarity and the high similarity in their amino acid sequences. Likewise, the WAG-2 gene (JF330184, AB465688), WM29A (AM502898) and TaAGL39 were clustered in a single subgroup, probably also because of the similarities in their amino acid sequences and functions. TheWAG-2clade clearly contains several different wheat genes clustered into two subgroups in diploid, tetraploid and hexaploid species. Further study will show whether this sequence diversity involves different functions.
Acknowledgments
This work was supported by the open fund project of the Key Laboratory of Southwest China Wildlife Resour-ces Conservation of the Ministry of Education (XNYB01--5) and by the National Nature Science Foundation of China (30871533).
References
Altschul SF, Gish W, Miller W, Myers EW and Lipman DJ (1990) Basic local alignment search tool. J Mol Biol 1215:403-410.
Batley J, Mogg R, Edwards D, O’Sullivan H and Edwards KJ (2003) A high-throughout SNuPE assay for genotyping SNPs in the flanking regions ofZea mayssequence tagged simple sequence repeats. Mol Breeding 11:111-120.
Bhattramakki D, Dolan M, Hanafey M, Wineland R, Vaske D, Register III JC, Tingey SV and Rafalski A (2002) Inser-tion-deletion polymorphisms in 3 regions of maize genes oc-cur frequently and can be used as highly informative genetic markers. Plant Mol Biol 48:539-547.
Brookes AJ (1999) The essence of SNPs. Gene 234:177-186.
Brown WM, Prager EM, Wang A and Wilson AC (1982) Mito-chondrial DNA sequences of primates, tempo and mode of evolution. J Mol Evol 18:225-239.
Buckler IV ES, Thornsberry JM and Kresovich S (2001) Molecu-lar diversity, structure and domestication of grasses. Genet Res 77:213-218.
Cargill M, Altshuler D, Ireland J, Sklar P, Ardlie K, Patil N, Lane
CR, Lim EP, Kalyanaraman N, Nemesh J, et al.(1999)
Characterization of single nucleotide polymorphisms in co-ding regions of human genes. Nat Genet 22:231-238. Ching A, Caldwell KS, Jung M, Dolan M, Smith OS, Tingey S,
Morgante M and Rafalski AJ (2002) SNP frequency, haplo-type structure and linkage disequilibrium in elite maize in-bred lines. BMC Genetics 3:19-33.
Ciaffi M, Paolacci AR, D’Aloisio E, Tanzarella OA and Porceddu E (2005) Identification and characterization of gene se-quences expressed in wheat spikelets at the heading stage. Gene 346:221-230.
Clarke KR and Gorley RN (2001) PRIMER v. 5: User Man-ual/Tutorial. PRIMER-E Ltd, Plymouth, pp 91-92. Doebley J (1992) Molecular systematics and crop evolution. In:
Soltis DE, Soltis PS and Doyle JJ (eds) Molecular Systemat-ics of Plants. Chapman & Hall, New York, pp 202-222. Doyle JJ and Doyle JL (1987) A rapid DNA isolation procedure
for small quantities of fresh leaf tissue. Phytochem Bull 19:11-15.
Feuillet C, Penger A, Gellner K, Mast A and Keller B (2001) Mo-lecular evolution of receptor-like kinase genes in hexaploid wheat. Independent evolution of orthologs after polyploi-dization and mechanisms of local rearrangements at para-logous loci. Plant Physiol 125:1304-1313.
Galtier N, Gouy M and Gautier C (1996) SEAVIEW and PHYLO_WIN: Two graphic tools for sequence alignment and molecular phylogeny. Comput Appl Biosci 12:543-548. Gaut BS (1998) Molecular clocks and nucleotide substitution
rates in higher plants. Evol. Biol 30:93-120.
Gojobori T, Li WH and Graur D (1982) Patterns of nucleotide substitution in pseudogenes and functional genes. J Mol Evol 18:360-369.
Grob GBJ, Gravendeel B and Eurlings MCM (2004) Potential phylogenetic utility of the nuclear FLORICAULA/LEAFY second intron: Comparison with three chloroplast DNA re-gions in Amorphophallus (Araceae). Mol Phylogenet Evol 30:13-23.
Gu YQ, Coleman-Derr D, Kong XY and Anderson OD (2004) Rapid genome evolution revealed by comparative sequence analysis of orthologous regions from four Triticeae geno-mes. Plant Physiol 135:459-470.
Hama E, Takumi S, Ogihara Y and Murai K (2004) Pistillody is caused by alterations to the class-B MADS-box gene ex-pression pattern in alloplasmic wheats. Planta 218:712-720. Huang S, Sirikhachornkit A, Su X, Faris J, Gill B, Haselkorn R
and Gornicki P (2002) Genes encoding plastid acetyl-CoA
carboxylase and 3-phosphoglycerate kinase of the
Triticum/Aegilopscomplex and the evolutionary history of polyploidy wheat. Proc Natl Acad Sci USA 99:8133-8138. Hayashi K, Hashimoto N, Daigen M and Ashikawa I (2004)
Kang HG, Noh YS, Chung YY, Costa MA, An K and An G (1995) Phenotypic alterations of petal and sepal by ectopic expres-sion of a rice MADS-box gene in tobacco. Plant Mol Biol 29:1-10.
Li WH, Wu CI and Luo CC (1984) Nonrandomness of point muta-tion as reflected in nucleotide substitumuta-tions in pseudogenes and its evolutionary implications. J Mol Evol 21:58-71. Lindblad-Toh K, Winchester E, Daly MJ, Wang DG, Hirschhorn
JN, Laviolette JP, Ardlie K, Reich DE, Robinson E, Sklar P,
et al.(2000) Large-scale discovery and genotyping of single nucleotide polymorphisms in the mouse. Nat Genet 24:381-386.
Martin AP and Burg TM (2002) Perils of paralogy: Using HSP70 genes for inferring organismal phylogenies. Syst Biol 51:570-587.
Meguro A, Takumi S, Ogihara Y and Murai K (2003) WAG, a wheat AGAMOUS homolog, is associated with develop-ment of pistil-like stamens in alloplasmic wheats. Sex Plant Reprod 15:221-230.
Mena M, Ambrose BA, Meeley RB, Briggs SP, Yanofsky MF and Schmidt RJ (1996) Diversification of C-function activity in maize flower development. Science 274:1537-1540. Mizumoto K, Hatano H, Hirabayashi C, Murai K and Takumi S
(2009) Altered expression of wheat AINTEGUMENTA
homolog, WANT-1, in pistil and pistil-like transformed sta-men of an alloplasmic line withAegilops crassacytoplasm. Dev Genes Evol 219:175-187.
Murai K, Murai R, Takumi S and Ogihara Y (1998) Cloning and characterization of cDNAs corresponding to the wheat MADS-box genes. Proc 9th Int Wheat Genet Symp 1:89-94. Murai K, Takumi S, Koga H and Ogihara Y (2002) Pistillody,
homeotic transformation of stamens into pistil-like struc-tures, caused by nuclear-cytoplasm interaction in wheat. Plant J 29:169-181.
Murai K, Miyamae M, Kato H, Takumi S and Ogihara Y (2003) WAP1, a wheatAPETALA1homolog, plays a central role in the phase transition from vegetative to reproductive growth. Plant Cell Physiol 44:1255-1265.
Nicholas KB and Nicholas HBJ (1997) GeneDoc: A tool for edit-ing and annotatedit-ing multiple sequence alignments. Embnew News 4:1-4.
Nielsen R (2005) Molecular signatures of natural selection. Annu Rev Genet 39:197-218.
Nielsen R and Yang Z (1998) Likelihood models for detecting positively selected amino acid sites and applications to the HIV-1 envelope gene. Genetics 148:929-936.
Ogihara Y, Mochida K, Nemoto Y, Murai K, Yamazaki Y, Shin-I T and Kohara Y (2003) Correlated clustering and virtual dis-play of gene expression patterns in the wheat life cycle by large-scale statistical analyses of expressed sequence tags. Plant J 33:1001-1011.
Paolacci AR, Tanzarella OA, Porceddu E, Varotto S and Ciaffi M (2007) Molecular and phylogenetic analysis of MADS-box genes of MIKC type and chromosome location of SEP-like genes in wheat (Triticum aestivumL.). Mol Genet Genomics 278:689-708.
Petersen G, Seberg O, Yde M and Berthelsen K (2006) Phylogen-etic relationships ofTriticumandAegilopsand evidence for the origin of the A, B, and D genomes of common wheat (Triticum aestivum). Mol Phylogenet Evol 39:70-82.
Purugganan MD, Rounsley SD, Schmidt RJ and Yanofsky MF (1995) Molecular evolution of flower development: Diversi-fication of plant MADS-box regulatory gene family. Genet-ics 140:345-356.
Rafalski A (2002) Applications of single nucleotide polymor-phisms in crop genetics. Curr Opin Plant Biol 5:94-100. Rosenberg MS, Subramanian S and Kumar S (2003) Patterns of
transitional mutation biases within and among mammalian genomes. Mol Biol Evol 20:988-993.
Rozas J, Sanchez-Delbarrio JC, Messeguer X and Rozas R (2003) DnaSP, DNA polymorphism analyses by the coalescent and other methods. Bioinformatics 19:2496-2497.
Saitou N and Nei M (1987) The neighbor-joining method: A new method for reconstructing phylogenetic trees. Mol Biol Evol 4:406-425.
Shimada S, Ogawa T, Kitagawa S, Suzuki T, Ikari C, Shitsukawa
N, Abe T, Kawahigashi H, Kikuchi R, Handa H, et al.
(2009) A genetic network of flowering-time genes in wheat
leaves, in which an APETALA1/FRUITFULL-like gene,
VRN1, is upstream of FLOWERING LOCUS T. Plant J 58:668-681.
Schmid KJ, Sorensen TR, Stracke R, Torjek O, Altmann T, Mitchell-Olds T and Weisshaar B (2003) Large-scale identi-fication and analysis of genome-wide single-nucleotide polymorphisms for mapping in Arabidopsis thaliana. Ge-nome Res 13:1250-1257.
Shitsukawa N, Tahira C, Kassai KI, Hirabayashi C, Shimizu T, Takumi S, Mochida K, Kwaura K, Ogihara Y and Murai K (2007) Genetic and epigenetic alteration among three homo-eologous genes of a class E MADS-box gene in hexaploid wheat. Plant Cell 19:1723-1737.
Soltics DE, Soltics PS and Tate JA (2003) Advances in the study of polyploidy since plant speciation. New Phytol 161:173-191.
Stephens JC, Schneider JA, Tanguay DA, Choi J, Acharya T, Stanley SE, Jiang R, Messer CJ, Chew A, Han JH, et al.
(2001) Haplotype variation and linkage disequilibrium in 313 human genes. Science 293:489-493.
Tajima F (1989) Statistical method for testing the neutral mutation hypothesis by DNA polymorphism. Genetics 123:585-595. Tamura K and Nei M (1993) Estimation of the number of
nucleo-tide substitutions in the control region of mitochondrial DNA in humans and chimpanzees. Mol Biol Evol 10:512-526.
Tamura K, Nei M and Kumar S (2004) Prospects for inferring very large phylogenies by using the neighbor-joining method. Proc Natl Acad Sci USA 101:11030-11035. Tamura K, Dudley J, Nei M and Kumar S (2007) MEGA4:
Molec-ular Evolutionary Genetics analysis (MEGA) software ver-sion 4.0. Mol Biol Evol 24:1596-1599.
Theissen G, Kim JT and Saedler H (1996) Classification and phy-logeny of the MADS-box multigene family suggest defined roles of MADS-box gene subfamilies in the morphological evolution of eukaryotes. J Mol Evol 43:484-516.
Vision TJ, Brown DG and Tanksley SD (2000) The origins of genomic duplications in Arabidopsis. Science 290:2114-2117.
Yamaguchi T, Lee DY, Miyao A, Hirochika H, An G and Hirano H-Y (2006) Functional diversification of the two C-class
MADS box genes OSMADS3 and OSMADS58 inOryza
sativa. Plant Cell 18:15-28.
Zhao T, Ni Z, Dai Y, Yao Y, Nie X and Sun Q (2006b) Character-ization and expression of 42 MADS-box genes in wheat (Triticum aestivumL.). Mol Gen Genom 276:334-350. Zhao XY, Cheng ZJ and Zhang XS (2006) Overexpression of
TaMADS1, aSEPALLATA-like gene in wheat, causes early flowering and the abnormal development of floral organs in
Arabidopsis. Planta 223:698-707.
Supplementary Material
The following supplementary material is available for this article:
Figure S1 - Alignment of the intron IV sequence of theWAG-2gene from different species.
This material is available as part of the online article at http://www.scielo.br/gmb.
Associate Editor: Marcio de Castro Silva-Filho