Synechococcus
and Their Myoviruses in the
East China Sea
Qiang Zheng, Nianzhi Jiao*, Rui Zhang, Jingjing Wei, Fei Zhang
State Key Laboratory for Marine Environmental Science, Institute of Marine Microbes and Ecospheres, Xiamen University, Xiamen, People’s Republic of China
Abstract
MarineSynechococcusis a principal component of the picophytoplankton and makes an important contribution to primary productivity in the ocean. Synechophages, infecting Synechococcus, are believed to have significant influences on the distribution and abundance of their hosts. Extensive previous ecological studies on cyanobacteria and viruses have been carried out in the East China Sea (ECS). Here we investigate the diversity and divergence of Synechococcus and their myoviruses (Synechomyoviruses) based on their shared photosynthesis psbA gene. Synechococcus is dominated by subclades 5.1A I, 5.1A II and 5.1A IV in the ECS, and clades I and II are the dominant groups in the Synechomyoviruses. As two phylogenetically independent clades, there is much higher diversity of the Synechomyoviruses thanSynechococcus. Obvious partitioning characteristics of GC and GC3 (the GC content at the third codon position) contents are obtained among different picophytoplankton populations and their phages. The GC3 content causes thepsbAgene inSynechococcus
to have a higher GC content, while the opposite is true in the Synechomyoviruses. Analyzing more than one-time difference of the codon usage frequency ofpsbAsequences, the third position nucleotides of preferred codons forSynechococcusare all G and C, while most Synechomyoviral sequences (72.7%) have A and T at the third position of their preferred codons. This work shed light on the ecology and evolution of phage-host interactions in the environment.
Citation:Zheng Q, Jiao N, Zhang R, Wei J, Zhang F (2014) The Evolutionary Divergence ofpsbAGene inSynechococcusand Their Myoviruses in the East China Sea. PLoS ONE 9(1): e86644. doi:10.1371/journal.pone.0086644
Editor:Zhang Zhang, Beijing Institute of Genomics, Chinese Academy of Sciences, China
ReceivedSeptember 2, 2013;AcceptedDecember 11, 2013;PublishedJanuary 23, 2014
Copyright:ß2014 Zheng et al. This is an open-access article distributed under the terms of the Creative Commons Attribution License, which permits unrestricted use, distribution, and reproduction in any medium, provided the original author and source are credited.
Funding:This work was supported by the NSFC project (41076063), the 973 program (2013CB955700) and China SOA project associated with task GASI-03-01-02-05 to NJ, Fundamental Research Funds for the Central Universities (2013121051) and NSFC project (41306126) to QZ, and the NSFC project (41376132) to RZ. The funders had no role in study design, data collection and analysis, decision to publish, or preparation of the manuscript.
Competing Interests:The authors have declared that no competing interests exist.
* E-mail: [email protected]
Introduction
Marine picocyanobacteria, mainly including Synechococcus and
Prochlorococcus, and photosynthetic picoeukaryotes are the principal primary producers in the ocean [1–3]. Cyanophages, the viruses infecting cyanobacteria, control the mortality of their hosts and participate in nutrient regeneration and cycling in the ocean [4–7]. MarineSynechococcus, an ancient and genetically diverse clade, is ubiquitous in the global ocean and is abundant in both estuarine and coastal waters [8–10]. The genus has developed many eco-types to adapt to different environments, and is divided into three major subclusters, 5.1, 5.2 and 5.3 [9,11]. Synechomyoviruses (Synechococcusmyoviruses) infect and interact with their hosts in the marine environment, leading to the rapid diversification for both of them [12]. Synechomyoviruses are known to encode accessory metabolic genes, including those for photosynthesis (psbAD) and carbon metabolism (talC, zwf, gnd, cp12), which are obtained via horizontal gene transfer (HGT) and constitute a large reservoir of the genetic diversity pool [6,13–23].
Recently, photosynthetic genes (psbA) coding for key photosystem II proteins (D1) have been widely discovered in the genome of cyanomyoviruses and also frequently detected from marine metagenomic data [13,15,18,24–26]. The psbA gene provides a shared gene marker between hosts and phages to investigate their antagonistic co-evolution in the marine environment. The GC
contents inpsbAsequences from Synechomyoviruses (46%–51%) are lower than those from theirSynechococcushosts (56%–62%) [27]. SynechomyoviruspsbAsequences have a patchy GC distribution as a result of intragenic recombination [27,28]. Since thepsbAgene has been obtained by cyanophages for a long time and evolved into an independent clade, the question arises as to how cyanophages diverged the genes which were obtained via HGT.
The East China Sea (ECS) is one of the largest continental marginal sea in the world, and is heavily influenced by human activity and multi-currents, such as the Yangtze dilution water, the Kuroshio current, the Taiwan warm current and so on [29–32]. Studies on distribution patterns and abundance about cyanobac-teria and viruses have been extensively carried out over the past decades in the ECS [29,30,33–36]. However, little is known concerning the diversity and community structure of the cyanobacteria and cyanophages in this complex oceanic area. The purpose of this study was to illuminate the diversity and evolutionary divergence of thepsbAgene inSynechococcusand their myoviruses in the ECS.
Results and Discussion
Community Structure
picophytoplankton (PEP), but the number was greatly decreased with increasing distance off-estuary (Fig. 1). Station DH3-1 also had the most Synechomyoviruses and the least Synechococcus
sequences in this transect (Table 1). This might have been caused by viral aggregation or attachment to particles, which would then block the filters. In stations DH3-3 and DH3-6,
Synechococcussequences dominated. No sequence of Prochlorococcus
or their phages was found in these three stations.
In the nearshore-offshore transect (DH22-DH24-DH27b),
Synechococcus sequences were only found in station DH27b-5M (Fig. 1). However, the Synechomyovirus sequences declined with
offshore direction. PEPs also showed the same trend and were the predominant community in the two near-shore stations (Table 1).
Prochlorococcusand their phages were detected in all stations, but increased significantly in the open-shelf station DH27b (both DH27b-5M and DH27b-150M). In the euphotic zone (150 m) of station DH27b, all sequences wereProchlorococcusand their phages except for two PEP clones (Table 1).
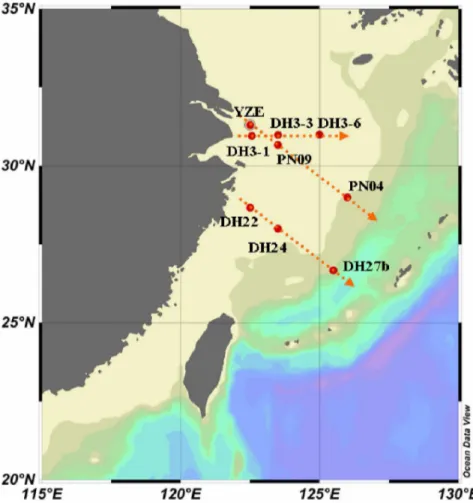
In the cross-shelf PN transect, no PCR product was obtained from the nearest estuarine station YZE (Fig. 1). This indicated that all the communities containing the psbA gene had a low abundance in winter near the estuary. From PN09 to PN04, Figure 1. Map of the ECS showing the locations of the sampling stations.
doi:10.1371/journal.pone.0086644.g001
Table 1.The community composition in each station.
Taxon DH3-1 DH3-3 DH3-6 DH22 DH24
DH27b -5M
DH27b
-150M PN09 PN04 Total GOS
S 7 81 93 0 0 5 0 9 2 197 283(96)
SM 36 13 2 40 29 13 0 73 71 277 282(123)
SP 3 1 0 0 0 0 0 1 2 7
-PEP 48 1 0 48 62 11 2 15 9 197
-P 0 0 0 3 5 69 98 2 13 190
-Total 94 96 95 91 96 98 100 100 97 868
S,Synechococcus; SM,SynechococcusMyovirus; SP,SynechococcusPodovirus; PEP, photosynthetic eukaryotic picophytoplankton; P,ProchlorococcusandProchlorococcus phages.
doi:10.1371/journal.pone.0086644.t001
Synechococcusand PEPs sequences decreased, and Synechomyovirus sequences basically remained the same (Table 1). Although many more sequences ofProchlorococcusand their phages were acquired from station PN04 compared to PN09, the proportion was much lower than at station DH27b.
The Diversity ofSynechococcus psbASequences
In the ECS,Synechococcuswas dominated by subclusters 5.1A, in which clades I, II and IV were the predominant components. Notably, the clade 5.1A I took up nearly three quarters of all
Synechococcus sequences (Fig. 2). Sequences from the GOS database formed eight small clades, which might be related to their specific original habitats. As a result of the uneven sequences obtained from the different stations, we ignored their diversity analyses along the transect.
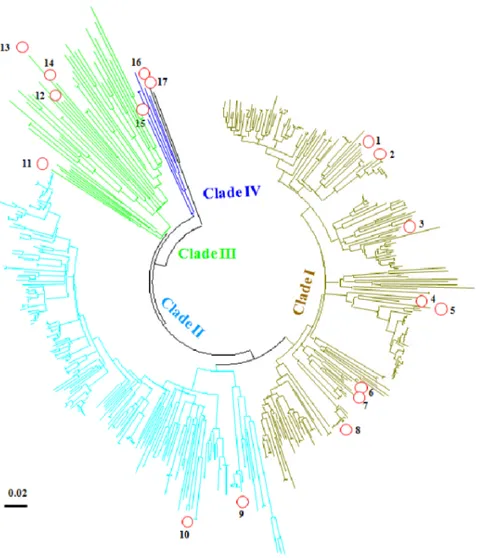
The Diversity ofpsbAGenes in Synechococcus Myoviruses
All Synechomyovirus could be classified into four groups -clades I, II, III and IV, in which -clades I and II are the dominant groups in the ECS (Fig. 3). These clades are inconsistent with their host classification. However, Cyanophage S-TIM5 represents a previously unknown lineage of myoviruses [37], and here itspsbA
sequence also formed a unique clade (IV) (Fig. 3).
The diversity ofpsbAsequences belonging toSynechococcusphages was far higher than that of their hosts, even though the sampling method did not target the phages (Fig. 4). This indicated that viral
psbAgenes are not only undergoing an independent selection but also evolving under an increased evolutionary rate [27,28].
Partitioning Based on GC and GC3 Content
Studies show that the GC content can separatepsbAsequences into Prochlorococcus and their phages (39%–46%), Synechococcus
Figure 2. The neighbor-joining tree based on theSynechococcus psbAsequences.Bootstrap percentages (.50) are shown in the tree. Scale bar represents 2% nucleotide substitution percentage.
doi:10.1371/journal.pone.0086644.g002
Figure 3. The neighbor-joining phylogenetic tree for all SynechomyoviruspsbAsequences.1. S-SM1 (GU071094); 2. S-RIM8 (JF974288); 3. S-SM2 (GU071095); 4. Syn33 (GU071108); 5. Syn1 (GU071105); 6. Syn19 (GU071106); 7. S-RSM4 (FM207411); 8. Syn9 (DQ149023); 9. S-ShM2 (GU071096); 10. S-SSM5 (GU071097); 11. S-PM2 (AJ630128); 12. S-CRM01 (HQ615693); 13. S-ShM1 (); 14. S-SSM7 (GU071098); 15. Cyanophage S-TIM5 (JQ245707); 16. Pycnococcus provasolii (FJ493498); and 17.Pyramimonas parkeae (FJ493499). Scale bar represents 2% nucleotide substitution percentage.
doi:10.1371/journal.pone.0086644.g003
phages (46%–51%) andSynechococcus(56%–62%) [27]. We added GC3 content (GC content at the third codon positions) to analyze ourpsbAsequences.
The overall average GC content differed substantially among different communities, ranging from 40% to 60%. However, the GC3 content had a much wider range, 30% to 80% (Fig. 5A).
As can be seen fromFig. 5A, different communities take up their own partitioned area.Synechococcusis in the top position, and
psbAgenes in Synechomyoviruses are almost completely separated from their hosts. This clearly separated pattern is also shown in Fig. 5B, which sequences are collected from GOS database
Prochlorococcus and their phages had much lower GC and GC3 content, and were mixed together (Fig. 5A). The low-light
Prochlorococcuswas located at the upper end of this region (although some isolated low-lightProchlorococcusoccupied the lower position of the Synechococcus region). The GC content of psbA genes in photosynthetic eukaryotic picophytoplankton (PEP) shared a similar range withProchlorococcusand their phages, but their GC3 content was relatively low. In our data, the lowest GC and GC3 contents were also found in PEPs.
The value of GC3 was much higher (8.3%–21.4%) than the corresponding GC value inSynechococcus psbAsequences, and the range was from22% to 10.4% in Synechomyoviruses, while the GC3 value of allpsbA sequences belonging toProchlorococcusand their myoviruses were usually lower than the GC value except for several low-lightProchlorococcusones.
The main clades ofSynechococcusalso showed obvious partition-ing characteristics from the GC and GC3 values (Fig. 5C).
Subcluster 5.2 (with the highest GC content) occupied the top position, followed by subcluster 5.1B and clade 5.1A II which occupied overlapping regions. Clade 5.1A I had the lowest GC and GC3 content, and occupied the bottom position. Another main clade (5.1A IV) was just between clades 5.1A I and 5.1A II. The clear partitioning showed that GC and GC3 played significant roles in the divergence ofSynechococcus. Using GC and GC3 partitioning Synechomyoviruses, no clear pattern was found (Fig. 5D). This might have been due to the high frequency ofpsbA
recombination among the cyanophages and between phages and their hosts, which also leads to patchy GC distribution in psbA
sequences [27,28].
The GC3 content contributed 85.5% and 82.1% of the overall GC content variation (or decline) in Synechococcus and their myoviruses, respectively. The GC3 content played an important role in shaping the overall GC content and the long-term evolution of the GC content. The variation of GC3 usually represents a synonymous mutation process. Mutation is the engine that drives evolution and adaptation forward in that it generates the variation on which natural selection acts. Decreased genomic GC content, together with decreased bacterial genome size (or gene number) are also found from Synechococcus to low-light
Prochlorococcusthen to high-light Prochlorococcus[9]. However, it is unclear whether the changes are directly related to certain environmental pressures.
It seemed thatpsbAgene conversion was a biased process that tended towards AT from Synechococcus to Synechomyoviruses. There is a large gap betweenSynechococcusandProchlorococcusin the Figure 4. Rarefaction curves.Based on A: nucleotide sequences; B: amino acid sequences. Cutoff values are selected as 1%, 3% and 10% for nucleotide sequences, and 1%, 3% and 5% for amino acid sequences.
GC and GC3 figure (Figs. 5A and B), and the Synechomyo-viruses just make it. This implied that SynechomyoSynechomyo-viruses might have played important roles in the evolution of the cyanobacteria. Previous work shows that nutrient availability (mainly nitrogen) may have some potential relationship with the genomic GC content, and the high nitrogen-uptake ability bacteria, for example nitrogen-fixers, tend to hold a higher genomic GC content, since the GC base pairs contained eight N atoms while the AT base pairs had seven N atoms [38]. Viruses assemble their particles on the principle of the least energy and materials, which might have contributed to the low GC content in the Synechomyoviruses. This also provided hints: 1) thatProchlorococcus(with its much lower GC content) could live better thanSynechococcusin the oligotrophic oceanic area; 2) that the high-light Prochlorococcus, which usually lives in the surface water with few nutrients, have a lower GC content than the low-light ones [9,39].
Codon Usage
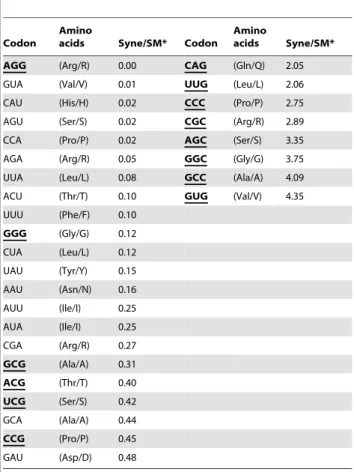
A more than double codon usage frequency ofpsbAsequences was found between Synechococcusand their myoviruses. The third position nucleotides of the preferred codons forSynechococcuswere all G and C, while most SynechomyoviralpsbAsequences (72.7%) had A and T at the third position (Table 2). The number of preferred codons for Synechomyoviruses was nearly twice that for
Synechococcus, which indicated that some rare codons inSynechococcus
became frequent in the phages. That also showed that different evolutionary or selection pressure occurred between the Synecho-myoviruses and their hosts.
The diversity and divergence between Synechococcus and Synechomyoviruses studied here shed light on the ecology and evolution of phage-host interactions in the environment. The isolation of more phage-host modeling systems is required to better understand their antagonistic co-evolution characteristics. Further environmental metagenomics and transcriptomics with deeper sequencing might give some clues concerning the in-situ dynamics of phage-host ecosystems.
Materials and Methods
Sample Collection
Water samples were collected on board during two cruises (from Dec. 2009 to Jan. 2010, and Jun. 2010) (Fig. 1). Transect DH3 (including stations DH3-1, DH3-3 and DH3-6) was from the summer cruise. The other two transects, PN (including stations YZE, PN09 and PN04) and DH22-DH24-DH27b, were from the winter cruise. Subsamples (2 to 3 liters) were pre-filtered through a 3-mm filter (GE Water & Process Technologies) and subsequently
filtered onto 0.22-mm-pore-size polycarbonate filters (Millipore).
The filters were immediately frozen and stored at280uC until further analysis. All necessary permits were obtained for the described field studies. One permit was required and obtained from the State Oceanic Administration People’s Republic of China.
Nucleic Acid Extraction
DNA was extracted using the hot sodium dodecylsulphate, phenol: chloroform: isoamyl alcohol, ethanol precipitation extrac-Figure 5. Relationship between the overall GC versus GC3 ofpsbAsquences.A. The partitioning characteristics for all communities (data from ECS).Synechococcus: y = 2.5655x - 0.7067 (R2= 0.9265); Synechomyovirus: y = 2.463x - 0.6944 (R2= 0.8566). B. The partitioning characteristics for
Synechococcus and Synechomyovirus (data from GOS database). C. The partitioning characteristics for different Synechococcus clades. D. The partitioning characteristics for different Synechomyovirus clades.
doi:10.1371/journal.pone.0086644.g005
tion protocol as described initially by Fuhrman et al. [40] with minor modifications by Zenget al. [41]. The DNA was stored at
220uC for future use.
Construction ofpsbAGene Clone Libraries
A polymerase chain reaction (PCR) was performed using the primers, psbA-F (59-GTN GAY ATH GAY GGN ATH MGN
GAR CC-39) andpsbA-R (59-GGR AAR TTR TGN GCR TTN CKY TCR TGC-AT-39) [42]. The PCR reaction mixture (50mL)
consisted of 25mL ExTaq premix (TaKaRa, Dalian, China),
0.5mM each primer, and 2mL (ca. 10 ng DNA) of template. The
amplification conditions comprised steps at 95uC for 5 min, 30 cycles at 94uC for 1 min, 55uC for 1 min, and 68uC for 1 min followed by one step of 10 min at 72uC. The amplified products were gel-purified and ligated into the pMD18-T vector (TaKaRa, Dalian, China) and then transformed into competent cells of
Escherichia coli DH5a. The ampicillin-resistant clones were randomly picked and screened for inserts using performing colony PCR with M13 primers (Invitrogen, Shanghai, China) for the vector.
Sequencing and Phylogenetic Analysis
Clones were sequenced on an ABI 3730 genetic analyser using M13F as the sequencing primer. All psbA gene sequences were checked manually based on the BLAST result and given a general classification. All sequences were aligned using the program ClustalX 2 [43]. Phylogenetic trees were constructed using the neighbour-joining algorithms of MEGA software 3.0 [44]. Sequences (both nucleotide and amino acid sequences) were grouped as operational taxonomic units (OTUs) by 99% or greater sequence similarity in the DOTUR program for further rarefac-tion analyses [45]. Rarefacrarefac-tion curves were calculated based the OTUs results using the statistical program PAST, ver. 1.34 (http://folk.uio.no/ohammer/past).
All partialpsbAgene sequences obtained in this study have been deposited into the GenBank database under accession numbers: KC997816–KC998700.
Acknowledgments
Professor John Hodgkiss of The University of Hong Kong is thanked for polishing the English in this manuscript.
Author Contributions
Conceived and designed the experiments: QZ NJ RZ. Performed the experiments: QZ JW FZ. Analyzed the data: QZ RZ JW. Contributed reagents/materials/analysis tools: QZ JW FZ. Wrote the paper: QZ RZ NJ.
References
1. Partensky F, Hess W, Vaulot D (1999)Prochlorococcus, a marine photosynthetic prokaryote of global significance. Microbiology and Molecular Biology Reviews 63: 106–127.
2. Johnson ZI, Zinser ER, Coe A, McNulty NP, Woodward EMS, Chisholm SW (2006) Niche partitioning among Prochlorococcus ecotypes along ocean-scale environmental gradients. Science 311: 1737–1740.
3. Scanlan DJ, West NJ (2002) Molecular ecology of the marine cyanobacterial generaProchlorococcusandSynechococcus. FEMS microbiology ecology 40: 1–12. 4. Suttle CA, Chan AM (1994) Dynamics and distribution of cyanophages and
their effect on marineSynechococcusspp. Applied and environmental microbiology 60: 3167–3174.
5. Binder B (1999) Reconsidering the relationship between virally induced bacterial mortality and frequency of infected cells. Aquatic microbial ecology 18: 207– 215.
6. Sullivan MB, Waterbury JB, Chisholm SW (2003) Cyanophages infecting the oceanic cyanobacteriumProchlorococcus. Nature 424: 1047–1051.
7. Shelford EJ, Middelboe M, Møller EF, Suttle CA (2012) Virus-driven nitrogen cycling enhances phytoplankton growth. Aquatic microbial ecology 66: 41–46. 8. Zwirglmaier K, Jardillier L, Ostrowski M, Mazard S, Garczarek L, et al. (2008) Global phylogeography of marine Synechococcus and Prochlorococcus reveals a distinct partitioning of lineages among oceanic biomes. Environmental microbiology 10: 147–161.
9. Scanlan DJ, Ostrowski M, Mazard S, Dufresne A, Garczarek L, et al. (2009) Ecological genomics of marine picocyanobacteria.
10. Huang S, Wilhelm SW, Harvey HR, Taylor K, Jiao N, Chen F (2011) Novel lineages of Prochlorococcusand Synechococcusin the global oceans. The ISME journal.
11. Dufresne A, Ostrowski M, Scanlan DJ, Garczarek L, Mazard S, et al. (2008) Unraveling the genomic mosaic of a ubiquitous genus of marine cyanobacteria. Genome Biol 9: R90.
12. Marston MF, Pierciey FJ, Shepard A, Gearin G, Qi J, et al. (2012) Rapid diversification of coevolving marineSynechococcusand a virus. Proceedings of the National Academy of Sciences 109: 4544–4549.
13. Mann NH, Cook A, Millard A, Bailey S, Clokie M (2003) Marine ecosystems: bacterial photosynthesis genes in a virus. Nature 424: 741–741.
14. Millard A, Clokie MRJ, Shub DA, Mann NH (2004) Genetic organization of the psbADregion in phages infecting marineSynechococcusstrains. Proceedings of the National Academy of Sciences of the United States of America 101: 11007– 11012.
15. Sullivan MB, Coleman ML, Weigele P, Rohwer F, Chisholm SW (2005) Three Prochlorococcuscyanophage genomes: signature features and ecological interpre-tations. PLoS biology 3: e144.
16. Lindell D, Jaffe JD, Coleman ML, Futschik ME, Axmann IM, et al. (2007) Genome-wide expression dynamics of a marine virus and host reveal features of co-evolution. Nature 449: 83–86.
Table 2.The difference of codon usage.
Codon
Amino
acids Syne/SM* Codon Amino
acids Syne/SM*
AGG (Arg/R) 0.00 CAG (Gln/Q) 2.05
GUA (Val/V) 0.01 UUG (Leu/L) 2.06
CAU (His/H) 0.02 CCC (Pro/P) 2.75
AGU (Ser/S) 0.02 CGC (Arg/R) 2.89
CCA (Pro/P) 0.02 AGC (Ser/S) 3.35
AGA (Arg/R) 0.05 GGC (Gly/G) 3.75
UUA (Leu/L) 0.08 GCC (Ala/A) 4.09
ACU (Thr/T) 0.10 GUG (Val/V) 4.35
UUU (Phe/F) 0.10
GGG (Gly/G) 0.12
CUA (Leu/L) 0.12
UAU (Tyr/Y) 0.15
AAU (Asn/N) 0.16
AUU (Ile/I) 0.25
AUA (Ile/I) 0.25
CGA (Arg/R) 0.27
GCG (Ala/A) 0.31
ACG (Thr/T) 0.40
UCG (Ser/S) 0.42
GCA (Ala/A) 0.44
CCG (Pro/P) 0.45
GAU (Asp/D) 0.48
*Syne/SM, the ratio means the codon usage ofSynechococcus psbAsequences divided by the codon usage in Synechomyovirus. The third codon position with G or C is highlighted using bold/underline.
17. Lindell D, Jaffe JD, Johnson ZI, Church GM, Chisholm SW (2005) Photosynthesis genes in marine viruses yield proteins during host infection. Nature 438: 86–89.
18. Lindell D, Sullivan MB, Johnson ZI, Tolonen AC, Rohwer F, et al. (2004) Transfer of photosynthesis genes to and fromProchlorococcusviruses. Proceedings of the National Academy of Sciences of the United States of America 101: 11013–11018.
19. Wang K, Chen F (2008) Prevalence of highly host-specific cyanophages in the estuarine environment. Environmental microbiology 10: 300–312.
20. Sharon I, Alperovitch A, Rohwer F, Haynes M, Glaser F, et al. (2009) Photosystem I gene cassettes are present in marine virus genomes. Nature 461: 258–262.
21. Alperovitch-Lavy A, Sharon I, Rohwer F, Aro EM, Glaser F, et al. (2011) Reconstructing a puzzle: existence of cyanophages containing both photosystem-I and photosystem-photosystem-Iphotosystem-I gene suites inferred from oceanic metagenomic datasets. Environmental microbiology 13: 24–32.
22. Be´ja` O, Fridman S, Glaser F (2012) Viral clones from the GOS expedition with an unusual photosystem-I gene cassette organization. The ISME journal 6: 1617–1620.
23. Thompson LR, Zeng Q, Kelly L, Huang KH, Singer AU, et al. (2011) Phage auxiliary metabolic genes and the redirection of cyanobacterial host carbon metabolism.Proceedings of the National Academy of Sciencesof the United States of America 108: 757–764.
24. Sharon I, Tzahor S, Williamson S, Shmoish M, Man-Aharonovich D, et al. (2007) Viral photosynthetic reaction center genes and transcripts in the marine environment. The ISME journal 1: 492–501.
25. Che´nard C, Suttle C (2008) Phylogenetic diversity of sequences of cyanophage photosynthetic genepsbAin marine and freshwaters. Applied and environmental microbiology 74: 5317–5324.
26. Tzahor S, Man-Aharonovich D, Kirkup BC, Yogev T, Berman-Frank I, et al. (2009) A supervised learning approach for taxonomic classification of core-photosystem-II genes and transcripts in the marine environment. BMC genomics 10: 229.
27. Sullivan MB, Lindell D, Lee JA, Thompson LR, Bielawski JP, et al. (2006) Prevalence and evolution of core photosystem II genes in marine cyanobacterial viruses and their hosts. PLoS biology 4: e234.
28. Zeidner G, Bielawski JP, Shmoish M, Scanlan DJ, Sabehi G, Be´ja` O (2005) Potential photosynthesis gene recombination between Prochlorococcus and Synechococcusvia viral intermediates. Environmental microbiology 7: 1505–1513. 29. Jiao N, Yang Y, Koshikawa H, Watanabe M (2002) Influence of hydrographic conditions on picoplankton distribution in the East China Sea. Aquatic microbial ecology 30: 37–48.
30. Jiao N, Yang Y, Hong N, Ma Y, Harada S, et al. (2005) Dynamics of autotrophic picoplankton and heterotrophic bacteria in the East China Sea. Continental Shelf Research 25: 1265–1279.
31. Pan L, Zhang J, Zhang L (2007) Picophytoplankton, nanophytoplankton, heterotrophic bacteria and viruses in the Changjiang Estuary and adjacent coastal waters. Journal of plankton research 29: 187–197.
32. Hu A, Jiao N, Zhang R, Yang Z (2011) Niche partitioning of marine group I Crenarchaeotain the euphotic and upper mesopelagic zones of the East China Sea. Applied and environmental microbiology 77: 7469–7478.
33. Jiao N, Zhao Y, Luo T, Wang X (2006) Natural and anthropogenic forcing on the dynamics of virioplankton in the Yangtze river estuary. Journal of the Marine Biological Association of the United Kingdom 86: 543–550. 34. Jiao N, Zhang Y, Zeng Y, Gardner WD, Mishonov AV, et al. (2007) Ecological
anomalies in the East China Sea: impacts of the Three Gorges Dam? Water Research 41: 1287–1293.
35. Xiao T, Yue H, Zhang W, Wang R (2003) Distribution ofSynechococcusand its role in the microbial food loop in the East China Sea. Oceanologia ET Limnologia Sinica 34: 33–43.
36. Pan L, Zhang L, Zhang J, Gasol JM, Chao M (2005) On-board flow cytometric observation of picoplankton community structure in the East China Sea during the fall of different years. FEMS microbiology ecology 52: 243–253. 37. Sabehi G, Shaulov L, Silver DH, Yanai I, Harel A, Lindell D (2012) A novel
lineage of myoviruses infecting cyanobacteria is widespread in the oceans. Proceedings of the National Academy of Sciences of the United States of America 109: 2037–2042.
38. McEwan CEA, Gatherer D, McEwan NR (1998) Nitrogen-fixing aerobic bacteria have higher genomic GC content than non-fixing species within the same genus. Hereditas 128: 173–178.
39. Palenik B (2012) Recent Functional Genomics Studies in MarineSynechococcus. Functional Genomics and Evolution of Photosynthetic Systems 103–118. 40. Fuhrman JA, Comeau DE, Hagstro¨m A˚ , Chan AM (1988) Extraction from
natural planktonic microorganisms of DNA suitable for molecular biological studies. Applied and environmental microbiology 54: 1426–1429.
41. Zeng Y, Jiao N, Cai H, Chen X, Wei C (2004) Phylogenetic diversity of ribulose-1, 5-bisphosphate carboxylase/oxygenase large subunit genes of bacterioplank-ton in the East China Sea. Acta Oceanol Sin 23: 673–685.
42. Zeidner G, Preston CM, Delong EF, Massana R, Post AF, et al. (2003) Molecular diversity among marine picophytoplankton as revealed by psbA analyses. Environmental microbiology 5: 212–216.
43. Thompson JD, Gibson TJ, Plewniak F, Jeanmougin F, Higgins DG (1997) The CLUSTAL_X windows interface: flexible strategies for multiple sequence alignment aided by quality analysis tools. Nucleic acids research 25: 4876–4882. 44. Kumar S, Tamura K, Nei M (2004) MEGA3: Integrated software for molecular evolutionary genetics analysis and sequence alignment. Briefings in Bioinfor-matics 5: 150–163.
45. Schloss P, Handelsman J (2005) Metagenomics for studying unculturable microorganisms: cutting the Gordian knot. Genome biology 6: 229.