INTRODUCTION
Several studies have reported the existence of im-portant genetic mechanisms acting on phenotypes involved in certain human responses possibly related to resistance/ susceptibility to malaria (Abel et al., 1992a), tegumentary (Shaw et al., 1995; Alcaïs et al., 1997) and visceral (Feitosa et al., 1998) leishmaniasis, leprosy (Abel and Demenais, 1988; Abel et al., 1989, 1992ab, 1995; Feitosa et al., 1995a,b, 1996) and schistosomiasis mansoni (Abel et al., 1991; Marquet et al., 1996; Müller-Myhsok et al., 1997).
Eosinophils are involved in the development and expression of antiparasite resistance and of parasite-in-duced pathology (Butterworth, 1977). One of the causes of eosinophilia is the presence of intestinal parasites with an extra-digestive phase in their life cycle. The activation of cells associated with eosinophilia, as well as alterations in functions, such as the synthesis and secretion of cat-ionic proteins (Tai et al., 1984), leukotriene C4 (Silberstein et al., 1986), major basic protein (Butterworth, 1977), and eosinophil peroxidase (Gruart et al., 1989), are some of the host’s mechanisms for fighting parasites. The capacity for eosinophilia probably has a major role in the resistance to parasitic infestations that trigger this response.
The presence of a major gene responsible for set-ting up the eosinophil response to helminthic infestation has been reported for rodents (Butterworth, 1977; Claas and
Deelder, 1979; Vadas, 1982; Hurley and Vadas, 1983; Wakelin and Donachie 1983; Lammas et al., 1988, 1992). Studies in sheep selected for high and low responsiveness to helminths showed that this variation was under genetic control (Dawkins et al., 1989). In humans, Moro-Furlani and Krieger (1992) demonstrated that in three Brazilian samples the familial re-semblance of eosinophil levels resulted from biological trans-mission rather than shared environmental factors. These conclusions were based on a series of familial correlations. In this study, we examined the causes of this bio-logical mechanism, using commingling and segregation analyses, applied to one of the above Brazilian samples.
MATERIAL AND METHODS
Sample
The sample consisted of 350 individuals from 180 families living in Bambui (State of Minas Gerais) in south-eastern Brazil, an area endemic for Chagas’ disease (for more details see Dias et al., 1983; Abreu et al., 1989; Krieger et al., 1992; Moro-Furlani and Krieger, 1992).
A sub-sample composed only of individuals in-fested by Ascaris lumbricoides, Strongyloides stercoralis, Ancylostomids and/or Schistosoma mansoni contained 177 subjects belonging to 120 complete or incomplete nuclear families. The presence of parasites in stool specimens was determined by standard parasitologic techniques and only helminths displaying extraintestinal cycles were consid-ered. A clinical hemogram was obtained and the eosino-phil rate was recorded as a percent of the total leukocytes.
Statistical analysis
In addition to the usual stepwise multiple regression, commingling and segregation analyses were performed.
EVIDENCE FOR BIOLOGICAL INHERITANCE OF THE EOSINOPHIL RESPONSE TO
INTERNAL PARASITES IN SOUTHEASTERN BRAZIL
Fátima Conti1, Glória M. Duccini Dal’ Colletto2, Mary Furlan Feitosa3 and Henrique Krieger2,4
A
BSTRACTOne hundred and seventy-seven individuals belonging to 120 complete or incomplete nuclear families from Bambui, in the State of Minas Gerais, southeastern Brazil, were studied in order to examine causes of variation in the eosinophil rate among subjects infested by intestinal worms with an extra-digestive cycle. Segregation analysis without correction for skewness showed that the hypothesis of the presence of an additive major gene was consistent with the data, although a dominant, recessive, or a multifactorial hypothesis could not account properly for the observed significant familial aggregation. The most parsimonious correction for skewness showed similar results, but could not distinguish between dominant and recessive models, although co-dominance was rejected. Since these models assume that skewness was attributable to the commin-gling of two distributions, these results seem to agree with those for uncorrected data. These findings suggest that several genetically independent factors determine the resistance/susceptibility to helminth infestation mainly through their ability to influence the eosinophil response.
1Departamento de Genética, Universidade Federal do Pará, Belém, PA, Brasil. 2Departamento de Parasitologia, Instituto de Ciências Biomédicas,
Universidade de São Paulo, 05508-900 São Paulo, SP, Brasil. Send corre-spondence to H.K. Fax: +55-11-818-7417 E-mail:
[email protected] / [email protected]
3Departamento de Genética, Instituto Oswaldo Cruz, FIOCRUZ, Rio de
Janeiro, RJ, Brasil.
4Division of Biostatistics, Washington University School of Medicine, Saint
Commingling analysis
This analysis was carried out as described by MacLean et al. (1976) using the computer program SKUMIX (Morton et al., 1983). The analysis assumes that the quantitative variable is influenced by a single major locus with two alleles (A, a) distributed in three possible genotypes (AA, Aa, and aa).This model, which may in-clude an optional power transformation parameter (P) to reduce skewness, can contemplate a mixture of up to three distributions in Hardy-Weinberg proportions. In addition to P, other parameters include the overall mean (u), the within-component variance (E), which is assumed to be equal for each of the component distributions, the square root of the relative proportion of the component distribu-tion with the highest mean (q), the displacement (t) be-tween the means of the two extreme component means, and the relative position of the intermediate mean (d) from the mean of the lowest component.
The parameters were estimated by maximum like-lihood. Six hypotheses were tested under one, two or three component distributions, each with (S = skewed) or with-out (N = normal) skewness. Tests of hypotheses for nested model comparisons were carried out using the likelihood ratio test (-2lnL). For non-nested model comparisons, Akaike’s information criterion (AIC), defined as the sum of -2lnL plus twice the number of estimated parameters, was used to assess the fit. The model with the smallest AIC value was accepted as the best model (Akaike, 1974). Commingling analysis was used to determine: i) whether there were multiple distributions, consistent with (but not proof of) a major gene hypothesis, ii) whether the form of the distribution varied among parents and offspring (i.e., generation heterogeneity), and iii) whether there was skewness in the distributions.
Segregation analysis
While commingled distributions are consistent with the presence of a major gene, skewness can result from environmental effects and from causal heterogeneity. Seg-regation analysis was used to determine whether the ma-jor effect is transmitted in families according to Mende-lian expectations. The model used for segregation analy-sis was the unified mixed model (Lalouel et al., 1983), which combines the mixed model (Morton and MacLean, 1974) and the transmission probability parameters (Elston and Stewart, 1971) as implemented in the computer pro-gram POINTER (Lalouel and Morton, 1981; Morton et al., 1983). The major gene effect results from segregation at a single locus with two alleles (A and a), with geno-types distributed in Hardy-Weinberg proportions. There are seven parameters in the model: the overall variance (V), the overall mean (u), the major locus gene frequency (q), the displacement between the two homozygous means (t), the relative position of the mean of the heterozygote,
or dominant (d), and two parameters representing the mul-tifactorial heritabilities in children (H) and parents (HZ). The parameters d, t, and q are parallel to those outlined for commingling analysis.
Additional parameters, τAA, τAa, τaa, can be esti-mated to test deviations from Mendelian transmission of the major effect from parent to offspring, and denote the probabilities of transmitting allele A for genotypes AA, Aa, and aa, respectively. Under Mendelian transmission, τAA = 1, τAa = 1/2, τaa = 0, while no major gene transmission is obtained when the three taus are equal. To infer the pres-ence of a major locus, three conditions are usually required: i) rejection of the hypothesis d = t = q = 0 (no major ef-fect), ii) no rejection of Mendelian transmission (when τAA = 1, τAa = 1/2, τaa = 0), and iii) rejection of the non-Men-delian transmission model (when τAA = τAa = τaa). Differ-ent hypotheses were tested by estimating or fixing param-eters of the complete model.
RESULTS AND DISCUSSION
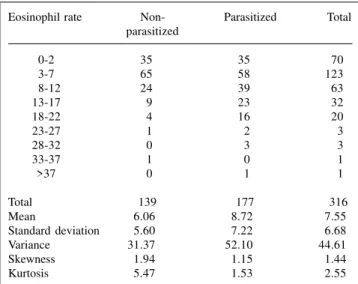
The eosinophil rate (ER) among individuals with and without internal parasites is shown in Table I, and the distribution of different parasites among the subjects is shown in Table II. The sample was divided into subjects without parasites and those with at least one of the inter-nal parasites (Ascaris lumbricoides, Strongyloides stercoralis, Ancylostomids and/or Schistosoma mansoni). The mean ER among individuals infested with some form of internal parasite was significantly higher than among individuals with no signs of infestation (t = -3.70, P < 0.001). Similarly, the variance of ER was also significantly higher in the former sub-group (F1,314 = 12.39, P < 0.001), suggesting that since it was not restricted to a shift to the right, the response was not uniform among infested indi-viduals, i.e.,some individuals reacted more intensely than others.
To investigate the effects of sex and age on eosi-nophil rate, regression analyses were done on the entire sample and on the parasitized sub-group. Because of the skewness of the distributions and the large variance val-ues, the stepwise multiple regressions were done using the natural logarithms of the eosinophil rate (LER) and the independent variables sex, age, age squared and sex-age interactions. None of these independent variables had a significant effect on the LER of the whole sample or the parasitized sub-group.
Tests of generation heterogeneity for each of the six commingling models (1N, 2N, 3N, 1S, 2S and 3S dis-tributions) showed no heterogeneity between parents and offspring (P > 0.05). Thus, all subsequent analyses were applied only to combined generations. Table III shows that there was skewness under one (1N-1S; χ2
1 = 22.23, P < 0.001), two (2N-2S; χ2
1 = 16.89, P < 0.001) and three (3N-3S; χ2
1 = 16.89, P < 0.001) distributions. Two-skewed dis-tributions fitted better than one-skewed (1S-2S; χ2
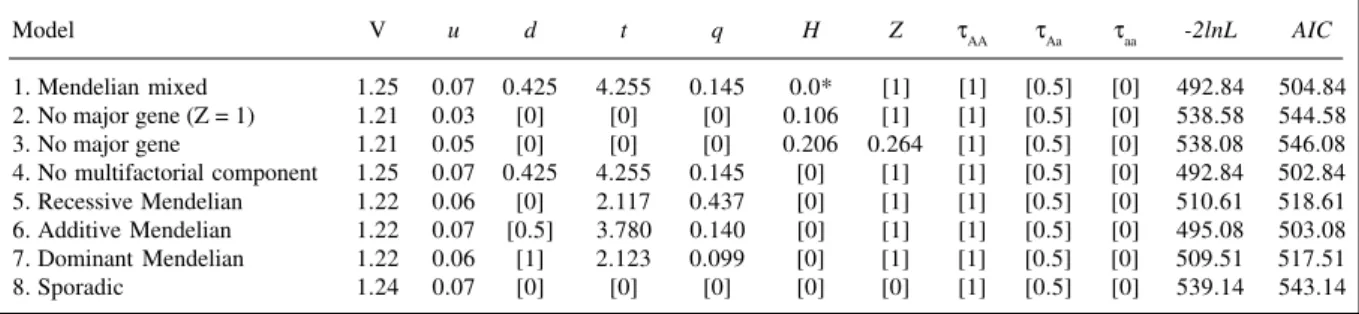
analysis. Table IV shows the results of segregation analy-ses for 177 individuals from 120 incomplete families, us-ing only individuals with a positive parasite test, and untransformed data. The mixed model (model 1) did not converge when the usual iterative procedure was used. The parameter H tended towards zero. Thus, a gradient of fixed values of H was used and the model that provided the smallest value of -2lnL was considered the minimum chi-square estimator (confirming H = 0). Using this approach, there was no generational difference in the multifactorial component (model 2 vs. model 3: χ2
1 = 0.50; P = 0.48) and the model without a multifactorial component (4) was not rejected (model 4 vs. model 1: χ2
1 = 0.0, P > 0.99). The hypothesis of no familial aggregation (model 8) was rejected (model 8 vs. model 1: χ2
4 = 46.30, P < 0.001), as was the hypothesis of no major effect (model 2 vs. model 1: χ2
3 = 45.74, P < 0.001). The data were consistent with an additive model of inheritance (model 6 vs. model 4: χ2
1 = 2.24, P = 0.13), while the recessive and dominant mod-els were rejected (model 5 vs. model 4: χ2
1 = 17.77, P < 0.001; model 7 vs. model 4: χ2
1 = 16.67, P < 0.001). The models that estimate taus (free and equal τs) did not reach convergence. Consequently, the presence of a major gene, based on the untransformed data, although suggestive, could not be further tested.
The results for segregation analyses after correc-tion for skewness (P = -1.925) are shown in Table V. No generational difference was detected in the multifactorial component (model 2 vs. model 3: χ2
1 = 0.0, P > 0.99). There was a significant familial resemblance (model 8 vs. model 1: χ2
4 = 18.11, P = 0.001) and a strict multifactorial model could not explain the familial aggregation (model 2 vs. model 1: χ2
3 = 14.01, P = 0.003). Neither the recessive (model 5 vs. model 4: χ2
1 = 1.40, P = 0.24) nor dominant (model 7 vs. model 4: χ2
1 = 0.0, P > 0.99) model was re-jected, whereas the additive model was rejected (model 6 vs. model 4: χ2
1 = 6.95, P = 0.008). Additionally, the domi-nant Mendelian model was not rejected (model 1 vs. model 9: χ2
3 = 2.11, P = 0.55), although a model with equal taus, i.e., equal transmission rates but different from half (model 10 vs. model 9: χ2
2 = 2.00, P = 0.37) fitted to the data. The AIC criterion also indicated the dominant Mendelian model as the most parsimonious and best model. Thus, a major
Table III - Commingling analysis of eosinophil’s levels among parasitized individuals.
Distribution E u d t q P -2lnL AIC
1 Normal 1.230 0.067 [0] [0] [0] [1] 269.57 273.57
1 Skewed 0.981 -0.181 [0] [0] [0] -1.815 247.34 253.34 2 Normal 0.525 0.067 [0] 2.106 0.446 [1] 256.50 264.50 2 Skewed 0.351 -0.190 [0] 1.592 0.687 -1.925 239.61 249.61 3 Normal 0.525 0.067 0.0* 2.106 0.446 [1] 256.50 266.50 3 Skewed 0.351 -0.190 0.0* 1.535 0.687 -1.925 239.61 251.61
E = Variance, u = mean, d = dominance, t = displacement, q = major gene frequency, P = power transform,
-2lnL = likelihood ratio test, AIC = Akaike’s information criterion.
Table II - Distribution of different parasites among individuals in a sample from Bambui, MG, Brazil.
Parasites Number of individuals
Ascaris lumbricoides 43
Strongyloides stercoralis 11
Ancylostomids 90
Schistosoma mansoni 4
A. lumbricoides and S. stercoralis 2
A. lumbricoides and Ancylostomids 13
S. stercoralis and Ancylostomids 7
S. mansoni and Ancylostomids 4
A. lumbricoides, S. stercoralis and Ancylostomids 2
A. lumbricoides, S. mansoni and Ancylostomids 1
Table I - The distribution of the eosinophil rate among parasitized and non-parasitized individuals.
Eosinophil rate Non- Parasitized Total parasitized
0-2 35 35 70
3-7 65 58 123
18-12 24 39 63
13-17 9 23 32
18-22 4 16 20
23-27 1 2 3
28-32 0 3 3
33-37 1 0 1
>37 0 1 1
Total 139 177 316
Mean 6.06 8.72 7.55
Standard deviation 5.60 7.22 6.68
Variance 31.37 52.10 44.61
Skewness 1.94 1.15 1.44
Kurtosis 5.47 1.53 2.55
t-value = -3.70, degrees of freedom = 314.
P = 0.02) and was more parsimonious than three-skewed distributions (3S-2S; χ2
1 = 0.0, P > 0.99). The AIC test indicated two-skewed distributions to be the best model.
effect acting on eosinophil levels could be inferred, but not proved. Analyses of the data without correction for skewness indicated the presence of a co-dominant mecha-nism while a model corrected for two distributions did not take into account the three genotypes. This probably ex-plains why dominant or recessive models fit the data.
The genetic basis for the capacity to develop an eosinophilic response to helminthic infections may depend on the eosinophils themselves and/or on some external factor. Eosinophilia is lymphocyte T-cell dependent (Basten and Beeson, 1970), with interleukin 5 (IL-5) play-ing a major regulatory role, not only in eosinopoiesis, but also in eosinophil maturation/activation and in immuno-globulin A production. Segregation analysis has indicated the presence of a major gene controlling IL-5 production in humans infected with S. mansoni (Rodrigues et al., 1996), while Rioux et al. (1998) showed that familial eosi-nophilia maps to the cytokine gene cluster. Using a simi-lar approach, Abel et al. (1991) showed that the intensity of infection by S. mansoni, measured by fecal egg counts, is under the control of a major gene. These observations were latter confirmed by mapping this gene to chromo-some 5q31-q33 (Marquet et al., 1996; Müller-Myhsok et al., 1997).
If the present results represent the individual’s ca-pacity to produce an efficient eosinophil response to
in-festation by helminths, then the factors involved in this phenomenon may be potentially separable by complex segregation and linkage analyses in an appropriate popu-lation, particularly since past contact with parasites and the population’s demographic history should indicate the factor determining this phenotype.
ACKNOWLEDGMENTS
Research supported by Conselho Nacional de Desen-volvimento Científico e Tecnológico (CNPq), Fundação de Amparo à Pesquisa do Estado de São Paulo (FAPESP) and Coor-denação de Aperfeiçoamento de Pessoal de Nível Superior (CAPES). Publication supported by FAPESP.
RESUMO
Uma amostra de 177 indivíduos pertencentes a 120 famílias nucleares, completas ou incompletas, de Bambui, Estado de Minas Gerais, sudeste do Brasil, foi estudada com o objetivo de apurar algumas das causas da variabilidade da taxa de eosinófilos em pessoas parasitadas por vermes intestinais com ciclo de vida extra-digestivo. A análise de segregação, aplicada aos dados sem correção para a assimetria, mostrou que a hipótese de um gene principal aditivo é consistente com os dados, enquanto que as hipóteses que supõem a ação de um gene dominante, de um gene recessivo ou ainda herança multifatorial não explicam, adequadamente, a significante agregação familial observada. A
Table IV - Segregation analysis of eosinophil levels among parasitized individuals.
Model V u d t q H Z τAA τAa τaa -2lnL AIC
1. Mendelian mixed 1.25 0.07 0.425 4.255 0.145 0.0* [1] [1] [0.5] [0] 492.84 504.84 2. No major gene (Z = 1) 1.21 0.03 [0] [0] [0] 0.106 [1] [1] [0.5] [0] 538.58 544.58 3. No major gene 1.21 0.05 [0] [0] [0] 0.206 0.264 [1] [0.5] [0] 538.08 546.08 4. No multifactorial component 1.25 0.07 0.425 4.255 0.145 [0] [1] [1] [0.5] [0] 492.84 502.84 5. Recessive Mendelian 1.22 0.06 [0] 2.117 0.437 [0] [1] [1] [0.5] [0] 510.61 518.61 6. Additive Mendelian 1.22 0.07 [0.5] 3.780 0.140 [0] [1] [1] [0.5] [0] 495.08 503.08 7. Dominant Mendelian 1.22 0.06 [1] 2.123 0.099 [0] [1] [1] [0.5] [0] 509.51 517.51 8. Sporadic 1.24 0.07 [0] [0] [0] [0] [0] [1] [0.5] [0] 539.14 543.14
* The parameter tended towards zero. H = Multifactorial component, Z = generation component for the multifactorial component. For other abbreviations see Table II.
Table V - Segregation analysis of eosinophil levels among parasitized individuals, after correction for skewness (P = -1.925).
Model V u d t q H Z τAA τAa τaa -2lnL AIC
1. Mendelian mixed 0.99 -0.13 1.0* 1.603 0.254 0.102 [1] [1] [0.5] [0] 482.62 494.62 2. No major gene (Z = 1) 0.98 -0.14 [0] [0] [0] 0.336 [1] [1] [0.5] [0] 496.63 502.63 3. No major gene 0.89 -0.14 [0] [0] [0] 0.346 0.921 [1] [0.5] [0] 496.63 504.63 4. No multifactorial component 1.00 -0.13 1.0 1.590 0.244 [0] [1] [1] [0.5] [0] 483.70 493.70 5. Recessive Mendelian 0.99 -0.14 [0] 1.582 0.649 [0] [1] [1] [0.5] [0] 485.10 493.10 6. Additive Mendelian 1.00 -0.14 [0.5] 2.410 0.651 [0] [1] [1] [0.5] [0] 490.65 498.65 7. Dominant Mendelian 0.99 -0.13 [1] 1.589 0.244 [0] [1] [1] [0.5] [0] 483.70 491.70 8. Sporadic 0.99 -0.15 [0] [0] [0] [0] [0] [1] [0.5] [0] 500.73 504.73 9. Free τs 1.00 -0.17 1.0* 1.606 0.304 0.117 [1] 1.0* 0.647 0.0* 480.51 498.51 10. Equal τs 0.99 -0.11 1.0* 1.600 0.264 0.101 [1] 0.102 0.102 0.102 482.51 496.51
correção mais parcimoniosa para assimetria mostrou resultados semelhantes, mas não permitiu a distinção entre os modelos dominante e recessivo, embora permitisse a rejeição do modelo codominante. Considerando que esse modelo supõe ser a assimetria devida ao entrelaçamento de duas distribuições, esses resultados parecem concordar com aqueles obtidos quando os dados não foram corrigidos. Pode-se sugerir que o papel desempenhado por vários fatores genéticos independentes na resistência/suscetibilidade à infestação por helmintos seja determinado, principalmente, por suas capacidades de agir no estabelecimento de uma resposta eosinofílica.
REFERENCES
Abel, L. and Demenais, F. (1988). Detection of major genes for suscepti-bility to leprosy and its subtypes in a Caribbean island: Desirade island. Am. J. Hum. Genet.42: 256-266.
Abel, L., Demenais, F., Baule, M.S., Blanc, M., Müller, A., Raffoux, C., Millan, J., Bois, E., Babron, M.C. and Feingold, N. (1989). Ge-netic susceptibility to leprosy on a Caribbean island: linkage analy-sis with five markers. Int. J. Lepr.57: 465-471.
Abel, L., Demenais, F., Prata, A., Souza, A.E. and Dessein, A. (1991). Evidence for the segregation of a major gene in human susceptibil-ity/resistance to infection by Schistosoma mansoni. Am. J. Hum. Genet.48: 959-970.
Abel, L., Cot, M., Mulder, L., Carnevale, P. and Feingold, J. (1992a). Segregation analysis detects a major gene controlling blood infec-tion levels in human malaria. Am. J. Hum. Genet. 50: 1308-1317.
Abel, L., Obert, J., Lap, V.D., Thuc, N.V., Guillord-Bataille, M., Schurr, E. and Lagrange, P.H. (1992b). Segregation analysis of leprosy in Vietnam. Am. J. Hum. Genet.51: 1318 (A335).
Abel, L., Vu, D.L., Oberti, J., Nguyen, V.T., Van, V.C., Guilloud Bataille, M., Schurr, E. and Lagrange, P.H. (1995). Complex segregation analysis of leprosy in southern Vietnam. Genet. Epidemiol.12: 63-82.
Abreu, M.C.A., Guimarães, R.C. and Krieger, H. (1989). Serum uric acid levels in Chagas’ disease. Mem. Inst. Oswaldo Cruz 84: 151-155.
Akaike, H. (1974). A new look at the statistical model identification. IEEE Trans. Automatic Control 19: 716-723.
Alcaïs, A., Abel, L., David, C., Torrez, M.E., Flandre, P. and Dedet, J.P.
(1997). Evidence for a major gene controlling susceptibility to tegu-mentary leishmaniasis in a recently exposed Bolivian population. Am. J. Hum. Genet. 61: 968-979.
Basten, A. and Beeson, P.B. (1970). Mechanism of eosinophilia. II. Role of the lymphocyte. J. Exp. Med. 131: 1288-1305.
Butterworth, A.E. (1977). The eosinophil and its role in immunity to hel-minth infection. Curr. Top. Microbiol. Immunol.77: 127-168.
Claas, F.H. and Deelder, A.M. (1979). H-2 linked immune response to murine experimental Schistosoma mansoni infections. Immunoge-netic6: 167-175.
Dawkins, H.J., Windon, R.G. and Eagleson, G.K. (1989). Eosinophil re-sponses in sheep selected for high and low responsiveness to Tricho-strongylus colubriformis. Int. J. Parasitol. 19: 199-205.
Dias, J.C.P., Camacho, L.A.B., Silva, J.C., Magalhães, J.S. and Krieger, H. (1983). Esofagopatia chagásica na área endêmica de Bambui, MG, Brazil. Rev. Soc. Bras. Med. Trop.16: 46-57.
Elston, R.C. and Stewart, J. (1971). A general model for the genetic analy-sis of pedigree data. Hum. Hered.21: 523-542.
Feitosa, M.F., Borecki, I., Krieger, H., Beiguelman, B. and Rao, D.C.
(1995a). The genetic epidemiology of leprosy in a Brazilian popula-tion. Am. J. Hum. Genet.56: 1179-1185.
Feitosa, M.F., Krieger, H. and Beiguelman, B. (1995b). Epidemiologia genética da hanseníase e da reação de Mitsuda. Hansenol. Int. 20: 5-8.
Feitosa, M.F., Krieger, H., Borecki, I., Beiguelman, B. and Rao, D.C.
(1996). Genetic epidemiology of the Mitsuda reaction in leprosy. Hum. Hered.46: 32-35.
Feitosa, M.F., Azevêdo, E.S., Lima, A.M. and Krieger, H. (1999). Ge-netic causes involved in Leishmania chagasi infection in
northeast-ern Brazil. Genet. Molec. Biol. 22: 1-5.
Gruart, V., Balloul, J.M., Prin, L., Tomassini, M., Loiseau, S., Capron, A. and Capron, M. (1989). Variations in protein expression related to human eosinophil heterogeneity. J. Immunol. 142: 4416-4421.
Hurley, J.C. and Vadas, M.A. (1983). Eosinophilia and acquisition of re-sistance to Nematospiroides dubius in mice sensitized with adult worms. Aust. J. Exp. Biol. Med. Sci. 61: 1-9.
Krieger, M.A., Almeida, E., Oeleman, W., Lafaille, J.J., Pereira, J.B., Krieger, H., Carvalho, M.R. and Goldenberg, S. (1992). Use of recombinant antigens for the accurate immunodiagnosis of Chagas’ disease. Am. J. Trop. Med. Hyg. 46: 427-434.
Lalouel, J.M. and Morton, N.E. (1981). Complex segregation analysis with pointers. Hum. Hered.31: 312-321.
Lalouel, J.M., Rao, D.C., Morton, N.E. and Elston, R.C. (1983). A uni-fied model for complex segregation analysis. Am. J. Hum. Genet.35: 816-826.
Lammas, D.A., Mitchell, L.A. and Wakelin, D. (1988). Genetic control of eosinophilia in parasitic infections: responses of mouse strains to treatment with cyclophosphamide and parasite antigen. Int. J. Parasitol.18: 1077-1085.
Lammas, D.A., Wakelin, D., Mitchell, L.A., Tuohy, M., Else, K.J. and
Grencis, R.K. (1992). Genetic influences upon eosinophilia and re-sistance in mice infected with Trichinella spiralis. Parasitology105: 117-124.
MacLean, C.J., Morton, N.E., Elston, R.C. and Yee, S. (1976). Skewness in commingled distributions. Biometrics 32: 695-699.
Marquet, S., Abel, L., Hillaire, D., Dessein, H., Kalil, J., Feingold, J., Weissenbach, J. and Dessein, A.J. (1996). Genetic localization of a locus controlling the intensity of infection by Schistosoma mansoni
on chromosome 5q31-q33. Nat. Genet.14: 181-184.
Moro-Furlani, A.M. and Krieger, H. (1992). Familial analysis of eosino-philia caused by helminthic parasites. Genet. Epidemiol. 9: 185-190.
Morton, N.E. and MacLean, C.J. (1974). Analysis of family resemblance. III. Complex segregation analysis of quantitative traits. Am. J. Hum. Genet.26: 489-503.
Morton, N.E., Rao, D.C. and Lalouel, J.M. (1983). Methods in Genetic Epidemiology. Karger, Basel.
Müller-Myhsok, B., Stelma, F.F., Guisse-Sow, F., Muntau, B., Thye, T., Burchard, G.D., Gryseels, B. and Horstmann, R.D. (1997). Fur-ther evidence suggesting the presence of a locus, on human chromo-some 5q31-q33, influencing the intensity of infection with Schisto-soma mansoni. Am. J. Hum. Genet.61: 452-454.
Rioux, J.D., Stone, V.A., Daly, M.J., Cargill, M., Green, T., Nguyen, H., Nutman, T., Zimmerman, P.A., Tucker, M.A., Hudson, T., Goldstein, A.M., Lander, E. and Lin, A.Y. (1998). Familial eosino-philia maps to the cytokine gene cluster on human chromosomal re-gion 5q31-q33. Am. J. Hum. Genet. 63: 1086-1094.
Rodrigues Jr., V., Abel, L., Piper, K. and Dessein, A.J. (1996). Segrega-tion analysis indicates a major gene in the control of interleukin-5 production in humans infected with Schistosoma mansoni. Am. J. Hum. Genet. 59: 453-461.
Shaw, M.A., Davies, C.R., Llanos-Cuentas, E.A. and Collins, A. (1995). Human genetic susceptibility and infection with Leishmania peruviana. Am. J. Hum. Genet.57: 1159-1168.
Silberstein, D.S., Owen, W.F., Gasson, J.C., DiPersio, J.F., Golde, D.W., Bina, J.C., Soberman, R., Austen, K.F. and David, J.R. (1986). Enhancement of human eosinophil cytotoxicity and leukotriene syn-thesis by biosynthetic (recombinant) granulocyte-macrophage colony-stimulating factor. J. Immunol. 137: 3290-3294.
Tai, P.C., Spry, C.J., Peterson, C., Venge, P. and Olsson, I. (1984). Mono-clonal antibodies distinguish between storage and secreted forms of eosinophil cationic protein. Nature309: 182-184.
Vadas, M.A. (1982). Genetic control of eosinophilia in mice: gene(s) ex-pressed in bone marrow-derived cells control high responsiveness. J. Immunol.128: 691-695.
Wakelin, D. and Donachie, A.M. (1983). Genetic control of eosinophilia. Mouse strain variation in response to antigens of parasite origin. Clin. Exp. Immunol.51: 239-246.