Vol.61, no.spe: e18000510, 2018
http://dx.doi.org/10.1590/1678-4324-smart-2018000510 ISSN 1678-4324 Online Edition
BRAZILIAN ARCHIVES OF BIOLOGY AND TECHNOLOGY
A N I N T E R N A T I O N A L J O U R N A L
Solar Energy for Residential Use and Its Contribution to the
Energy Matrix of the State of Paraná
Gabriela Garcia
1*, Eliel Ferreira Nogueira
1, Roberto Cesar Betini
11Universidade Tecnológica Federal do Paraná, Curitiba, Brasil.
ABSTRACT
The present study evaluates the economic viability of the application of solar energy for electric power generation via the use of photovoltaic systems in a residential consumption unit in the city of Curitiba. Since the energy from the sun is abundant, clean, renewable and has the potential to compete in productivity and profitability, the evaluation of the applicability of these systems in homes, not only in industrial parks, is of great interest. A household with the determined consumption profile was chosen for this case study through simulations with the HomerPro software. After analyzing the data, the photovoltaic potential of the State of Paraná was estimated to investigate the possibility of photovoltaic generation growth in the state energy matrix and its consequences.
Keywords: Photovoltaic Systems; Solar Energy; Renewable Energy; Photovoltaic Power Generation.
INTRODUCTION
With the introduction of electrical energy as the driving force of machines since the Industrial Revolution, technological innovations have been increasingly associated with electricity, making economic growth contingent on this form of energy.
The degradation of the environment and the projected shortage of fossil fuels in the near future highlight the importance of generating energy with a minimum environmental impact, thus asserting the relevance of including different sources of energy to the national energy matrix.
Although the state of Paraná presents a great hydraulic potential, it is estimated that around 70 per cent of its potential has already been explored, which hinders the expansion of this sector and creates the necessity of investments in other sources of electrical energy generation, highlighting renewable sources such as wind and solar energy1,2.
A case study was implemented with the software HomerPro³ in which a household representing the majority of residential consumers in the city of Curitiba was selected for simulations in case residents adhered to the photovoltaic generation system connected to the energy distribution system.
After obtaining data through simulations with the software, the values of photovoltaic potential of Paraná could be estimated, provided that the photovoltaic generation were disseminated in the state and became more representative in the energy matrix.
MATERIAL AND METHODS
Case Study
With the aim of analyzing the economic viability of installing a photovoltaic system, a household was selected in the Santa Felicidade neighborhood, in the Northewest region of Curitiba. The house is located on the corner of Doutor Leao Mocelin and Auguste Comte Streets.
Table 1- Monthly consumption of electrical energy
Month/Year Consumption (kWh)
10/16 307
09/16 351
08/16 297
07/16 362
06/16 295
05/16 275
04/16 320
03/16 277
02/16 279
01/16 295
12/15 293
11/15 278
Average = 302
Simulation with the HomerPro Software
The HomerPro software can be downloaded from the Homer Energy website³. First, a test with the demo version is advisable; the trial license lasts for 30 days, and, after exploring the software, the choice of the most appropriate licensing is uncomplicated. In this study the thirty-day trial version was used.
The software aims at modeling renewable and non-renewable generation stations. It brings a variety of more detailed elements which can be inserted in the system and thus assist analysis with more profound and accurate results.
After obtaining the average energy consumption of the household studied, it was possible to perform simulations intended at analyzing the radiation levels absorbed by the solar modules, the demand load by the residents, the system operating costs, the amount of energy generated by the photovoltaic system, as well as the amount of surplus energy consumed from the distribution network.
Analysis and Estimate of the Photovoltaic Potential of Paraná
Following the presentation of the economic viability of the installation of photovoltaic systems in residences of up to 70m², an in-depth analysis of the implantation of these systems was performed to ascertain an estimate of the photovoltaic generation potential of Paraná in its totality and to explore alternatives for the possibility of expanding the photovoltaic market so it assumes a more important role in the energy matrix of the state.
The latest energy balance of Paraná provided by the State of Paraná Energy Company (COPEL)8 was issued in 2010 (base year 2009), which demonstrates that the state’s
Table 2- Evolution of energy production in Paraná
Consumption (GWh) 2005 2006 2007 2008 2009
Hydropower 6.844 5.950 6.953 7.450 7.057
Sugarcane products 1.961 2.437 3.168 3.652 3.742
Firewood 1.512 1.605 1.697 1.765 1.665
Wood waste 1.215 1.287 1.321 1.564 1.620
Other sources 261 250 253 333 355
Shale 180 217 213 151 182
Petroleum 370 237 195 146 0
Mineral coal 45 45 47 52 53
Total 12.388 12.028 13.847 15.113 14.674
Table 2 displays the behavior change in the state of Paraná in relation to the energy sources used between 2005 and 2009.
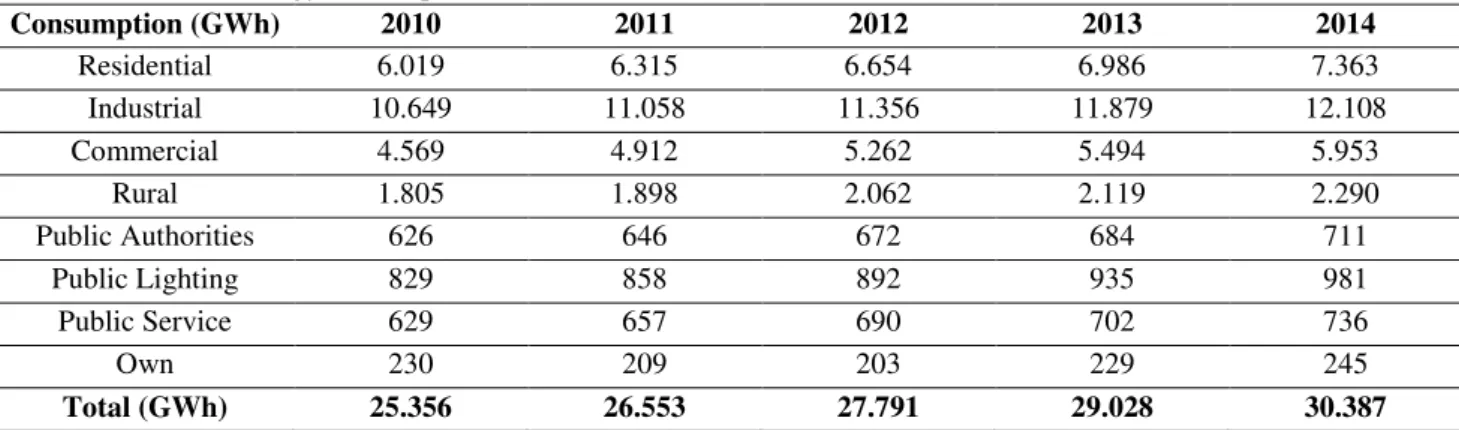
Table 3 presents a comparison of electricity consumption in the state of Paraná between 2010 and 2014, assessing the amount consumed by each individual sector. The total electricity consumption in the state advanced about 20 per cent from 2010 to 2014. The largest energy consumer is the industrial sector, followed by the residential and commercial sectors.
Table 3 - Electrical energy consumption in Paraná
Consumption (GWh) 2010 2011 2012 2013 2014
Residential 6.019 6.315 6.654 6.986 7.363
Industrial 10.649 11.058 11.356 11.879 12.108
Commercial 4.569 4.912 5.262 5.494 5.953
Rural 1.805 1.898 2.062 2.119 2.290
Public Authorities 626 646 672 684 711
Public Lighting 829 858 892 935 981
Public Service 629 657 690 702 736
Own 230 209 203 229 245
Total (GWh) 25.356 26.553 27.791 29.028 30.387
Table 3 shows the development of electrical energy consumption in the state of Paraná according to different sectors from 2010 to 2014.
RESULTS AND DISCUSSION
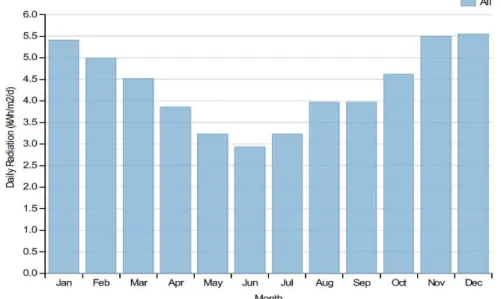
Solar Radiation Data for the Selected Location Generated by HomerPro
Solar radiation is a relevant point for the assessment of a future performance of the photovoltaic system. For this end, the HomerPro software³ uses a NASA database - The Surface Meteorology and Solar Energy Database.A study determined the geographical location data as the point of latitude 25°25'06.55'' S and longitude 49°20'03.17'' W. The software uses these data to calculate, through Internet search, the levels of radiation in the geographical location defined by the user.
The data obtained through the HomerPro software³, as demonstrated in Figure 1, had a maximum solar radiation index of 5,6 kWh/m2/d in December and a minimum value of 2,8 kWh/m2/d in June.
Figure 1 - Annual radiation generated by the HomerPro software
Figure 1 shows the daily solar radiation values in a year.
The Electrical Energy Consumption of the Residence
Figure 2 - Household consumption per hour in kW
Figure 2 Presents the values of electrical energy demand in the household during the hours of a full day.
Energy Generated by the Photovoltaic System
Figure 3 represents the monthly generation of photovoltaic energy by solar modules (Shar250) and the electrical energy consumption of the household provided by the distribution network in the same period (Grid).
The study demonstrated that the energy provided by the plates is the same as the energy consumed by the household from the distribution network. As the consumption of energy in the household does not occur in the same period of energy production by the solar plates, at that moment we withdrew the network energy. In other words, at the time the energy is generated, it is being totally injected in the network, and, at the time the energy is consumed, not enough energy is generated, thus the consumption from the distribution network is necessary.
Operating and Installing Costs
Through market research on the necessary equipment, a photovoltaic system was designed to partially supply the energy demand of the household, so that the tariff of the energy generated by the system was as beneficial as possible to meet the consumption needs of the residents.
The photovoltaic system modulated by the software would have eight solar modules of 2kWp and an inverter of 2,5kW. The cost of each solar panel is R$ 1,000.00 each, totaling R$ 8,000.00. The inverter costs R$ 5,000.00, according to market research. It should be noted that the projected system has an average life of 25 years without the need to replace the solar panels. Since the inverter must be replaced every 10 years, two replacements would be necessary during the average lifespan of the photovoltaic system, adding R$ 10,000.00. to the budget. Estimated maintenance costs for the solar modules are R$ 2,500.00 and R$ 1,250.00 for the inverters during the average lifespan of 25 years. Consequently, the total maintenance cost would be R$ 3,750.00. Table 4 demonstrates the total cost of the system, without considering the possible works required for its installation, as well as the equipment required by COPEL for the connection to the distribution network.
Table 4 - Budget for photovoltaic system
Item Quantity Cost (R$)
Solar Module 8 1,000.00 (each)
Inverter 1 5,000.00
Change of Inverter 2 5,000.00 (each)
Maintenance - 3,750.00
Total 26,750.00
Table 4 presents the costs of the photovoltaic system elements for the household in Brazilian currency (Real).
Annual Saving and Estimate Return on Investment
Table 5 - Annual saving with the implementation of the photovoltaic system and estimate return on investment
Year
PV Generation in kWh/year (with loss of efficiency of 0.65%/year)
Tariff (adjustment of
8.5% /year) Annual Saving (R$)
2016 3.639 0.55867 2,033.00013
2017 3.615,3465 0.60615 2,191.46740
2018 3.591,846748 0.65768 2,362.28681
2019 3.568,499744 0.71358 2,546.42116
2020 3.545,304496 0.77423 2,744.90832
2021 3.522,260016 0.4004 2,958.86707
2022 3.499,365326 0.91145 3,189.50336
2023 3.476,619452 0.98892 3,438.11717
2024 3.454,021425 1.07298 3,706.10981
2025 3.431,570286 1.16418 3,994.99180
2030 3.321,484697 1.75053 5,814.,38708
2040 3.111,79494 3.95793 12,316.2937
2041 3.091,568273 4.29436 13,276.3180
Total Saving 157,518.505
Table 5 shows the annual saving with the implementation of the photovoltaic system in the household, in Brazilian currency (Real), as well as the estimate return on investment.
For the calculation of return on investment, the total investment on implementation of the photovoltaic system mentioned above and the savings obtained by the photovoltaic generation should be considered. These figures permit to estimate the return on investment in years. For the system studied, the return on investment is slightly over eight years, as observed in Table 5, in the year of 2024.
Figure 4 - Operating and installing costs of photovoltaic system
Figure 4 presents the costs of initial investment, inverter replacement, and operating in Brazilian currency (Real).
Estimated Results of the Photovoltaic Potential of the State of Paraná
The IBGE data presented above shows that there are about 1,310,059 middle-class households in Paraná. If all residences of the class chosen for the study had their own photovoltaic systems connected to the distribution network, and an estimated generation of 250 kWh/month per household, totaling around 3 MWh/year per residence, the state of Paraná would be producing about 3,930,177 MWh/year through photovoltaic systems
– given that the state produced 1,003,674,506 MWh of electrical energy in the year of 20156. Considering that the city of Curitiba consumes around 4,951,764 MWh/year7,
this estimated photovoltaic generation could supply almost 80 per cent of the state capital. According to Table 2, the electrical energy consumption in state households in 2014 was of 7,363 GWh; therefore, if middle-class households joined the photovoltaic generation, this model of micro-generation could supply above 53 per cent of the state residences.
These are just estimated figures, for they do not represent the exact potential of photovoltaic generation of Paraná. These numbers can serve as a base for an analysis of how photovoltaic generation could represent to the state.
Perspectives
According to the Energy Research Company (EPE) 4, the projection of electrical energy
electrical energy, with an annual growth of 4.4 per cent. For the same perspective, EPE has projected a growth of 5 million permanent households, totaling around 71 million by the end of 2020. Consequently, the continuous expansion of per capita income, along with the development of per capita electrical energy consumption, is a relevant observation in this study. It should be noted that the advance in electrical energy demand, a greater number of households and the elevation of per capita income represent a favorable perspective for the investment in renewable energy sources in the country.
DISCUSSION
The photovoltaic generation is still regarded as an expensive energy source given the cost of initial investment; yet, as this study demonstrates, it provides a satisfactory return in the medium and long term. The photovoltaic generation is still seldom disseminated in the market; consequently, in most cases the consumers regard the concept of micro-generation as a simple utopia or an investment that only people of great purchasing power could afford. However, according to the results presented in this study, solar energy can be a part of the energetic matrix not only in the state of Paraná, but also in Brazil.
The existence of financing programs for those interested in purchasing their own micro-generation centers would be of great importance. Today, banks such as Caixa Economica Federal, Brazilian Development Bank (BNDES), and Santander have loan and financing programs destined for photovoltaic projects. For instance, the state of Sao
Paulo has created the “Green Economy Financing Line”, which aims at reducing 20 per
cent of CO2 emission by 2020, and financing solar generation projects. The creation of
a national program intended for introducing photovoltaic energy not only to households but also to companies would bring prosperity to the country.
If Brazil were to use photovoltaic energy on a larger scale, this action would increase the incentive for the national production of photovoltaic modules, making them more economic, as most of such modules are imported. This would increase the total investment in this type of system.
As for the state of Paraná, if the households mentioned above actually joined the photovoltaic generation, the energetic and economic scenario of the state would change. With micro-generation in residences, the demand for energy generated by other sources
– which are controlled by COPEL – would gradually decrease. Conversely, the energy injected in the network by these generation centers would advance. The reduction of energy import from other countries, such as Paraguay, would be providential. All this would contribute to the reduction of the cost of energy supplied by COPEL, which would result in a chain reaction to the state economy.
CONCLUSIONS
In a developing country such as Brazil, there are areas to be prioritized, such as public health, education, and basic sanitation. However, in relation to micro-generation, the creation of governmental or private initiative programs would be crucial so that citizens could learn about the functioning of photovoltaic generation systems connected to the network, the advantages provided, and the possible difficulties.
can be an alternative for the decentralization of energy generation, collaborating for the diversification of the energy matrix of the state.
Although the distributed generation benefits the electric network in many ways, it is necessary to consider some intrinsic aspects to its usage. Issues such as controlling, the penetration level of photovoltaic generation facilities, types of technologies used, the configuration of the distribution network itself, the network protections, and the network operation capacity with bidirectional power fluids can affect the integration of generation unities.
Therefore, as most of electricity generation sources, photovoltaic generation also impacts the environment and the current distribution network in Brazil. As technologies and studies advance in the area, the representativeness of this source of energy matrix has a promising potential in the country.
REFERENCES
1- Roberto Cesar Betini. Energias Renováveis, Políticas Públicas e Planejamento Energético. Curitiba: UTFPR; 2014 [cited 2017 April 02]. Available from: http://repositorio.utfpr.edu.br/jspui/bitstream/1/942/1/Energias%20Renov%C3%A1veis_ Pereira2C%20Thulio%20C%C3%ADcero%20Guimar%C3%A3es_2014.pdf.
2- Gerson Tiepolo. Estudo do Potencial de Geração de Energia Elétrica Através de Sistemas Fotovoltaicos Conectados à Rede no Estado do Paraná [dissertation]. Curitiba: SIBI/PUCPR; 2015.
3- Homer Energy. Software HomerPro. Boulder: Homer Energy; 2014. [cited 2017 April 02]. Available from: http://www.homerenergy.com/ HOMER_pro.html .
4- Empresa de Pesquisa Energética. Anuário Estatístico de Energia Elétrica, 2015. Brasília: EPE; 2015 [cited 2017 April 02]. Available from: http://www.epe.gov.br/AnuarioEstatisticodeEnergiaEletrica/Anu%C3%A1rio%20Estat% C3%ADstico%20de%20Energia%20El%C3%A9trica%202015.xls.
5- Instituto Brasileiro de Geografia e Estatística. Censo Demográfico 2010: Rendimento
– Amostra (Paraná). Rio de Janeiro: IBGE; 2010 [cited 2017 April 02]. Available from: http://www.ibge.gov.br/estadosat/temas.php?sigla=pr&tema=censodemo g2010_rend. 6- Operador Nacional do Sistema. Boletim Mensal de Geração por Estado. Brasília: ONS. 2017 [cited 2017 April 02]. Available from: http://www.ons. org.br/resultados_operacao/boletim_mensal_geracao_estado/ index.aspx.
7- Instituto Paranaense de Desenvolvimento Econômico e Social. Anuário Estatístico do Estado do Paraná - Infraestrutura: Energia, 2012. Curitiba: IPARDES; 2012 [cited 2017 April 02]. Available from: http://www.ipardes.pr.gov.br/anuario_2012/ index.html. 8- Companhia Paranaense de Energia. Balanço Energético. Curitiba: COPEL; 2010 [cited 2017 April 02]. Available from: http://www.copel.com/hpcopel/root/ nivel2.jsp?endereco=%2Fhpcopel%2Froot%2Fpagcopel2.nsf%2Fdocs%2FC824D47B053 08F650325740C00438020.
Received: December 21, 2017;