R. gest. sust. ambient., Florianópolis, v. 9, n. esp , p. 363-386, fev. 2020
363 COMPARATIVE ANALYSIS OF THE ENERGY CONSUMPTION OF FIXED AND
VARIABLE SPEED PRESSURE SYSTEMS
DOI: http://dx.doi.org/10.19177/rgsa.v9e02020363-386
Ana Catarina Formigoni Abel1
Diego Antônio Custódio2
ABSTRACT
The objective of this study was analyzing two pressure systems relative to energy consumption. One of the systems operates at a fixed speed and the other with variable speed by using a frequency inverter. It was selected two product models based on the water demand, which was calculated with the average flow rate spent per each type of sanitary appliance. Thus, it was possible to estimate the power consumed in each hour and then, calculate the electric energy consumption. The cost of energy per hour was also found, considering the current energy tariff. The results showed an economical use of the inverter compares to non-use. The average potential energy savings was 44.7%, and it was found R$ 369.11 of reduction in the monthly energy cost. Therefore, it is concluded the use frequency inverter is economically viable in relation to energy consumption and reduce the costs of electric energy.
Key words: Pressure systems. Fixed speed. Variable speed. Energy savings.
¹ Graduada em engenharia civil pela Universidade do Estado de Santa Catarina (2018). Técnica em produtos na empresa Franklin Electric. E-mail: [email protected]
² Graduado em engenharia civil pela Universidade do Estado de Santa Catarina (2012). Mestre em engenharia civil pela Universidade Federal de Santa Catarina (2017). Professor colaborador do Departamento de Engenharia Civil da Universidade do Estado de Santa Catarina (2015-2019). Doutorando em engenharia civil pela Universidade Federal de Santa Catarina. E-mail: [email protected]
R. gest. sust. ambient., Florianópolis, v. 9, n. esp , p. 363-386, fev. 2020
364
1 INTRODUCTION
In 2016, the world total final electricity consumption was 3.2% higher than in 2015. In 2016, non-OECD (Organization for Economic Cooperation and Development) countries, including Brazil, total final electricity consumption had an increase of 4.8% from 2015 (IEA, 2017).
After two years of decline in 2017, the electricity consumption in Brazil grew 1.2% over 2016, keeping Brazil among the 10 largest consumers in the world. The South and Center-West regions led growth, with rates of 3.1% and 2.4%. The industrial sector continues to be the largest consumer, followed by the residential sector (EPE, 2018).
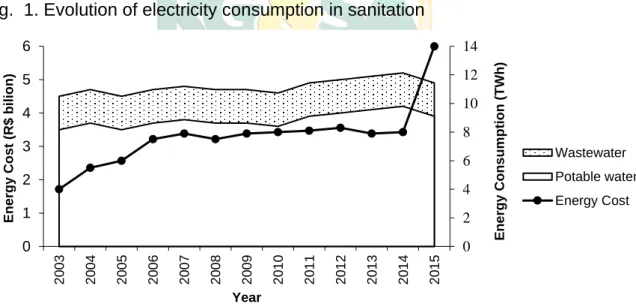
In 2015, the electricity costs of sanitation service providers participating in the National Sanitation Information System (SNIS) reached R $ 5.14 billion, consuming 11.0 TWh with water supply, as shown in Fig. 1. (SNIS, 2015).
Fig. 1. Evolution of electricity consumption in sanitation
Source: Adapted from SNIS (2015).
The reduction in energy consumption in 2015, when compared to 2014 is mainly attributed to measures to rationalize the volume of water consumed. Despite this reduction, energy expenditures increased substantially, almost 50% over the previous year. The main reasons for this increase are the tariff
0 1 2 3 4 5 6 2 0 0 3 2 0 0 4 2 0 0 5 2 0 0 6 2 0 0 7 2 0 0 8 2 0 0 9 2 0 1 0 2 0 1 1 2 0 1 2 2 0 1 3 2 0 1 4 2 0 1 5 0 2 4 6 8 10 12 14 Year Ene rgy Cos t (R$ bi li on ) Ene rgy Cons um pti on (TW h) Wastewater Potable water Energy Cost
R. gest. sust. ambient., Florianópolis, v. 9, n. esp , p. 363-386, fev. 2020
365 readjustments and the implementation of the flag system that came into force and reinforce the importance of adequate energy management by service providers and users (SNIS, 2015).
It is very often that a public water distribution network is not enough for buildings (LEITE, 2008). One solution to this problem is pressurizing, which is to increase the pressure in the use of an automated hydraulic pump, but around three percent of the worldwide electricity consumption is using in pumps (Liu, Ouedraogo, Manghee and Danilenko, 2012).
However, in addition to providing more comfort, there needs to be less energy consumption. Energy efficiency is the ability of a component, the equipment or the ability to perform a fixed amount of work with the least energy expenditure (PROCEL, 2009).
An example of the city of Milan, Italy, the cost of pumping water to customers was about 16 M€/year which needed an investigation to reduce the cost of the operations, and that resulted in 26% reduction (Castro-Gama, Pan, Lanfranchi, Jonoski and Solomatine, 2017).
Numerous ways of increasing the energy efficiency in a pressurizing system and in this work will be analyzed with the application of the frequency inverters for purposes of optimization of electric energy use without affecting the pumping operating systems (RODRIGUES, 2007).
1.1 OBJECTIVE
The objective of this study was to compare the energy consumption of a fixed and a variable speed pressure system to find the energy saving of the variable system and prove the efficiency of using a frequency inverter.
2 METHOD
2.1 PREMISES ADOPTED FOR THE SIMULATIONS
A single apartment model was set as standard to compare the energy consumption between two building pressurization systems.
R. gest. sust. ambient., Florianópolis, v. 9, n. esp , p. 363-386, fev. 2020
366 This apartment was obtained by surveying the characteristics of Brazilian residential buildings, conducted by the Brazilian Center for Energy Efficiency in Buildings (CB3E) (2015). In this survey were evaluated buildings from all over brazil, but for this work was focused on the data obtained for the Southern Brazil. It was noticed in the survey that in relation to the number of dormitories the majority has three, with a total of 2,233 housing units (UHS) in this configuration.
Using the highest UHS values for each room, the standard apartment could be defined, which has 3 bedrooms, 2 bathrooms, no toilet and integrated kitchen and laundry area.
The constructive characteristics of the buildings were also considered in the study, among them, the height of the right foot, number of pavements type and number of apartments per floor. For the standard building, the average values found in the south region survey were considered, resulting in a right foot of 2.6 m, 10 floor type and 4 apartments per floor.
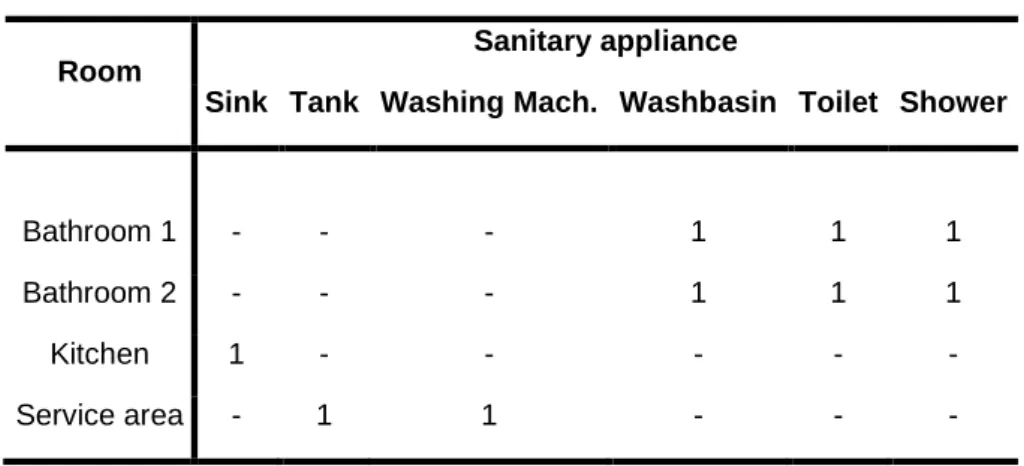
Thus, with a standard apartment of 3 bedrooms, 2 bathrooms, kitchen and service area, it was estimated the number of hydraulic devices installed in each room, as shown in Table 1.
Table 1. Standard apartment hydraulic appliances
Room
Sanitary appliance
Sink Tank Washing Mach. Washbasin Toilet Shower
Bathroom 1 - - - 1 1 1
Bathroom 2 - - - 1 1 1
Kitchen 1 - - - - -
Service area - 1 1 - - -
Source: According to author
2.2 DAILY CONSUPTION PROFILE
In order to elaborate the water consumption profile for the hours of the day, the data set forth in technical support document no. E1 - Characterization and
R. gest. sust. ambient., Florianópolis, v. 9, n. esp , p. 363-386, fev. 2020
367 Monitoring of Water Consumption, of the National Program to Combat Water Waste, proposed by Ministry of Planning and Budget and the National Secretariat for Urban Policy (1999).
This document presents the average consumption per hour of each piece of sanitary used, per apartment, in multifamily buildings. Fig. 2 shows the total water consumption per hour of the day by adding the consumption of the sanitary appliances present in the standard apartment adopted.
Fig. 2. Consumption of sanitary appliances per hour of the standard apartment
Source: Adapted from Rocha, Barreto and Ioshimoto (1999).
Adopting the consumption shown in Fig. 2, we found the total consumption per hour of the day. With this, it was possible to find the time of greatest consumption in the buildings studied. This time was taken as a reference of the time of greater use of water for the standard building, where 100% of the simultaneous flow is consumed, ie, the maximum design flow is consumed. For the other hours a percentage of consumption was attributed according to the maximum consumption. Table 2 presents the consumption values of each sanitary appliance, the sum of the total consumption and the final percentage adopted per hour of the day.
0 20 40 60 80 100 120 140 1 3 5 7 9 11 13 15 17 19 21 23 W ater con sup tion ( L ) Daily hours (h) Washbasin Washing Mach. Coupling box Tank Sink Shower
R. gest. sust. ambient., Florianópolis, v. 9, n. esp , p. 363-386, fev. 2020
368
Table 2. Percentages of consumption per hour
Daily hours (h) Water consuption (L) Percentage (%)
Shower Sink Tank
Coupling Box
Washing
Machine Washbasin Total
1 16 0,5 0 0 0 0 16,5 12 2 0 0,8 0 0 0 0 0,8 1 3 0 0,5 0 0 0 0 0,5 0 4 0 0,5 0 0 0 0 0,5 0 5 0 0,4 0 0 0 0 0,4 0 6 22 0,3 0 0 0 4,6 26,9 20 7 0 1 0 0 0 6,2 7,2 5 8 110 3,5 0 0 0 2,3 115,8 88 9 0 4,1 9 8,5 22 13 56,6 43 10 40 13 23 9 25,5 7 117,5 89 11 86 2,1 7 6,5 29 1,5 132,1 100 12 21 6,2 3 10,5 4,9 2,1 47,7 36 13 22 5 0 7 13 3 50 38 14 41 1,8 0 0,5 8 2,9 54,2 41 15 22 8 1 6,3 19 1,8 58,1 44 16 50 5 1 6,4 3 2,3 67,7 51 17 80 17,5 0 4,2 0 2,5 104,2 79 18 70 7 8 6 26 1,8 118,8 90 19 46 9,6 3 0 27 1,5 87,1 66 20 18 13 0 11 0 1,7 43,7 33 21 39 8 0 6,2 40 3,9 97,1 74 22 37 3 0 6,5 0 2,3 48,8 37 23 2 0,5 0 0 0 1,6 4,1 3 24 0 0,5 0 0 0 2 2,5 2
R. gest. sust. ambient., Florianópolis, v. 9, n. esp , p. 363-386, fev. 2020
369
2.3 PRESSURE IN POINTS OF CONSUMPTION
In dynamic conditions, the water pressure at the points of use should be established in order to guarantee the indicated design flow and the proper functioning of the use piece and sanitary appliance (ABNT, 1998).
The pressure shall not be less than 10 kPa, except for the point of the discharge box where the pressure may be less than this value, up to a minimum of 5 kPa, and the point discharge valve for a sanitary basin where the pressure shall not be less than 15 kPa.
In addition to NBR 5626 (ABNT, 1998), the minimum working pressure proposed by Dias and Segatto (2015) for supply through the system used, in which the water goes from the lower reservoir directly to the points of consumption, is considered. With this, it was adopted that the minimum pressure in the connection of the last deck pavement is at least 100 kPa.
2.4 DETERMINATION OF PUMP MANOMETRIC HEIGHT
The load losses were calculated by defining a standard path for the pipe and calculating the losses located along the entire length.
In order to supply the load losses in the pipeline, it is standardized at 10% of the total value of the projected head, in all cases analyzed in this work, as proposed by Dias and Segatto (2015).
In this way, Eq. 1 was applied to determine the manometric height for the motor pump.
𝐻 = (𝐻𝑔𝑒𝑜 + 𝐻𝑐𝑜𝑛𝑠). 1,1 (1)
At where:
H is the total head to be supplied by the pump (kPa);
Hgeo is the geometric difference between the suction of the pump and the highest point of supply (kPa);
R. gest. sust. ambient., Florianópolis, v. 9, n. esp , p. 363-386, fev. 2020
370 1,1 is the coefficient adopted to supply the load losses in the piping.
2.5 DETERMINATION OF MAXIMUM FLOW OF PROJECT AND FLOW PER HOUR
The NBR 5626 (ABNT, 1998) establishes the minimum flow per sanitary device as well as the method of weights for the determination of the flows in the pipe.
In the weight method, from the sum of the relative weights, we can find the maximum probable instantaneous flow rate of the pipe, as shown in Eq. 2:
𝑄 = 0,3√∑ 𝑃 (2)
At where:
Q is the maximum design flow rate (L/s);
∑P is the sum of the relative weights of the sanitary devices according to NBR 5626 (ABNT, 1998).
With the maximum design flow rate, we continue to calculate the flows for each hour of the day, described according to section 3.2, by the maximum design flow, as shown in Eq. 3.
𝑄ℎ = 𝑄. 𝑃ℎ (3)
At where:
𝑸𝒉 is the flow per hour (m³/s);
𝑸 is the maximum design flow (m³/s); 𝑷𝒉 is the percentage per hour (%).
2.6 POWER REQUIRED FOR EVERY TIME OF DAY
With the products selected, the pressure vs. flow curve and the flow curve vs. the engine power were extracted directly from the product manufacturer. The pressure vs. flow curve showed the different operating points at which the pumps can work. The power curve, however, revealed the different powers associated with the required operating points.
R. gest. sust. ambient., Florianópolis, v. 9, n. esp , p. 363-386, fev. 2020
371 The following are the procedures for calculating the powers for the two types of pumps:
a) Fixed speed
For fixed speed, since there is no variation, the calculations considered only the power required at the operating points chosen for each hour of the day. the information was taken from the flow chart versus product power.
b) Variable speed
For variable speed, the calculation needs more variables due to the change in the operating frequency of the product. Thus, the frequency curves of the pump were varied from 30 Hz to 60 Hz, with a difference of 1 Hz, which resulted in a total of 30 different frequency curves susceptible to work varying their speed.
To make the curves, all new frequencies were referenced with the hydraulic curve and the frequency of the pump operating at fixed speed. The fixed speed pump, like most pumps marketed in Brazil, operates at the maximum frequency of 60 Hz.
The calculations followed the following equations (MESQUITA, 2015):
a) New flow
𝑸𝒇 = 𝑸𝒊(𝑭𝒇
𝑭𝒊 ) (4) At where:
𝑸𝒇 is the flow rate at the new frequency (m³/s);
𝑸𝒊 is the flow at the fixed speed pump at 60Hz (m³/s); 𝑭𝒇 is the new operating frequency (Hz);
𝑭𝒊 is the operating frequency of the fixed speed pump (60 Hz).
R. gest. sust. ambient., Florianópolis, v. 9, n. esp , p. 363-386, fev. 2020 372 𝑯𝒇 = 𝑯𝒊(𝑭𝒇 𝑭𝒊) 𝟐 (5) At where:
𝑯𝒇 is the manometer height at the new frequency (kPa); 𝑯𝒊 is the head gauge at the fixed speed pump at 60Hz (kPa); 𝑭𝒇 is the new operating frequency (Hz);
𝑭𝒊 is the operating frequency of the fixed speed pump (60 Hz).
c) New power
𝑷𝒇 = 𝑷𝒊(𝑭𝒇 𝑭𝒊)
𝟑 (6)
At where:
𝑷𝒇 is the power consumed at the new frequency (hp);
𝑷𝒊 is the power consumed at the fixed speed pump at 60Hz (hp); 𝑭𝒇 is the new operating frequency (Hz);
𝑭𝒊 is the operating frequency of the fixed speed pump (60 Hz).
2.7 ENERGY CONSUMPTION FOR EVERY HOUR OF THE DAY
According to WEG (2017), in its Guide to Efficient Electric Power Management, the calculation of the energy consumption of the motors must take into account the power consumed, the number of operating hours and their efficiency.
In order to obtain this value, it was observed the type of motor used in the chosen pump and later, in the manufacturer's technical catalog, the percentage yield was obtained.
The Eq. 7 shows how the energy consumed in kWh was calculated for each power consumed at each hour per day.
𝑬 =𝑷𝒐𝒕 .𝒉
R. gest. sust. ambient., Florianópolis, v. 9, n. esp , p. 363-386, fev. 2020
373 At where:
𝑬 is the energy consumption (kWh);
𝑷𝒐𝒕 is the power associated with time of day (kW); 𝒉 is the number of hours of operation;
𝒏 is the engine efficiency (%).
2.8 PERCENTAGE OF ENERGY ECONOMY
In addition to the analysis provided by the graphs, one can extract in percent which system energy savings are more efficient compared to the system that consumes the most energy.
This analysis was elaborated by extracting the percentage of energy saving gain for each hour of the day, presented in Eq. 8.
(𝑬𝟐−𝑬𝟏)
𝑬𝟐 . 𝟏𝟎𝟎% (8)
At where:
𝑬𝟐 is the energy consumed in the product with the highest expenditure (kWh); 𝑬𝟏 is the energy consumed in the product with the least expense (kWh).
2.9 COST OF ENERGY
The cost was calculated by multiplying the tariff of the electricity bill by the consumption of each hour as shown in Eq. 9. for this research, the tariff subgroup b1 was adopted and the normal residential classification, according to the Vigilant Energy Rate of the Operator Celesc, 0.43142 (R$/kWh).
𝑪𝒉= 𝑬𝒉𝑻 (9)
At where:
𝑪𝒉 is the cost of energy per hour (R$); 𝑬𝒉 is the energy spent per hour (kWh); 𝑻 is the energy tariff (R$/kWh).
R. gest. sust. ambient., Florianópolis, v. 9, n. esp , p. 363-386, fev. 2020
374 Adding to the cost of each hour, the daily cost was obtained and by multiplying this daily cost by 30 days, the amount of energy paid was found throughout the month.
With the monthly cost for each product, one can know the gain in percentage savings in the cost that the most efficient product provides, presented in Eq. 10.
(𝑪𝒎𝟐−𝑪𝒎𝟏)
𝑪𝒎𝟐 . 𝟏𝟎𝟎% (10)
At where:
𝑪𝒎𝟐 is the cost of energy in the product with the highest expense (R$); 𝑪𝒎𝟏 is the cost of energy in the product with the lowest expense (R$).
3 RESULTS AND DISCUSSION
3.1 DETERMINATION OF MANOMETRIC HEIGHT
The manometric height was determined from the one described in section 3.4, where the variables adopted were the pressure at the point of consumption and the geometric height obtained by multiplying the height of the right foot of 2.6m by the number of floors, fixed in 10. The manometric height found was 39.6 meter of water column (396 kPa) For greater ease in the selection of the pump the value of the manometric height was approximated to 40 meters of water column (400 kPa).
3.2 DETERMINATION OF PROJECT FLOW AND FLOWS PER HOUR
Based on section 3.1, it was possible to calculate the quantity of each sanitary appliance for the whole building. in the case of the sink, tank and washing
R. gest. sust. ambient., Florianópolis, v. 9, n. esp , p. 363-386, fev. 2020
375 machine, a total of 40 appliances were installed in the building, since only one piece of each per apartment was established in the kitchen and service area.
In the case of the lavatory, basin and electric shower, a total of 80 was obtained, as it was considered that each standard apartment has two bathrooms, with a washbasin, a sanitary basin and a shower each.
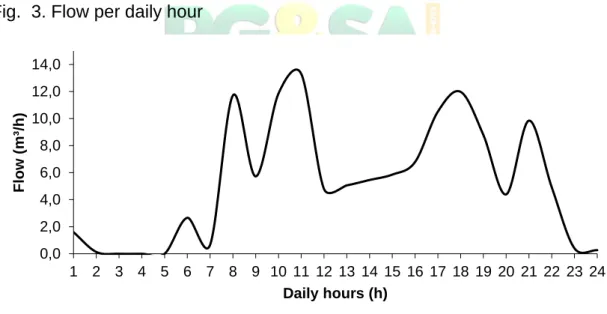
In order to obtain the maximum simultaneous flow rate, the relative weights method described in section 3.5 was used, where the weights of the sanitary pieces were multiplied by their quantities and in the total sum a total relative weight of 152 was obtained the maximum flow rate of the project was 13.31 m³/h (0,0036 m³/s), which was rounded to the value of 13.5 m³/h (0,0037 m³/s).
With the maximum design flow rate, the flow rates were calculated for each hour of the day according to the procedure described in section 3.5 and, with the multiplication of the maximum design flow by all percentages of use, the water consumption of the for each hour of the day, which are available in Fig. 3.
Fig. 3. Flow per daily hour
Source: According to author
3.3 CHOICE OF PRODUCTS
The product was chosen based on the calculated manometric height, as described in section 4.1, and the maximum design flow, obtained in section 4.2, and with this, the operating point of the motor pump was defined. The product
0,0 2,0 4,0 6,0 8,0 10,0 12,0 14,0 1 2 3 4 5 6 7 8 9 10 11 12 13 14 15 16 17 18 19 20 21 22 23 24 Flow ( m³ /h) Daily hours (h)
R. gest. sust. ambient., Florianópolis, v. 9, n. esp , p. 363-386, fev. 2020
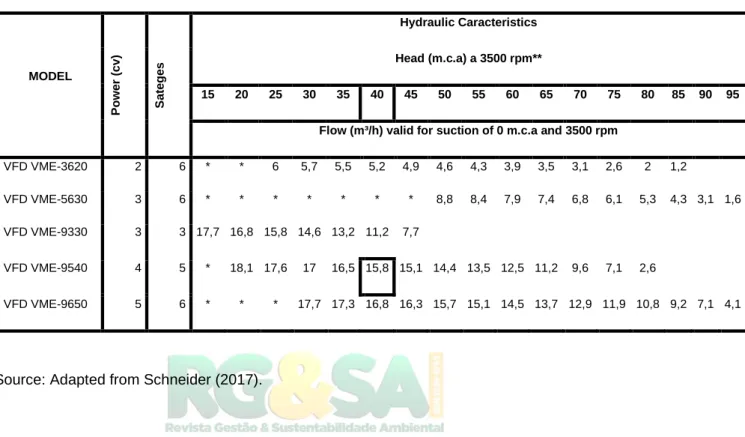
376 was scaled through the analysis of the Schneider Motorcycle Catalog, as shown in Table 3.
Table 3. Pump selection table with frequency inverter
MODEL P owe r (c v ) S a te ges Hydraulic Caracteristics Head (m.c.a) a 3500 rpm** 15 20 25 30 35 40 45 50 55 60 65 70 75 80 85 90 95
Flow (m³/h) valid for suction of 0 m.c.a and 3500 rpm
VFD VME-3620 2 6 * * 6 5,7 5,5 5,2 4,9 4,6 4,3 3,9 3,5 3,1 2,6 2 1,2
VFD VME-5630 3 6 * * * * * * * 8,8 8,4 7,9 7,4 6,8 6,1 5,3 4,3 3,1 1,6
VFD VME-9330 3 3 17,7 16,8 15,8 14,6 13,2 11,2 7,7
VFD VME-9540 4 5 * 18,1 17,6 17 16,5 15,8 15,1 14,4 13,5 12,5 11,2 9,6 7,1 2,6 VFD VME-9650 5 6 * * * 17,7 17,3 16,8 16,3 15,7 15,1 14,5 13,7 12,9 11,9 10,8 9,2 7,1 4,1
Source: Adapted from Schneider (2017).
In the catalogue, the model was chosen according to the selection table, and the correct choice from the operational point of view was the VFD-VME model 9540.
It was also observed that in the hydraulic characteristics of Table 3, the flow point of 13.5 m³/h (0,0037 m³/s) does not appear detailed, as the table is a summary representation of the curve. For this reason, Fig. 4. shows the curve of the VFD-VME 9540 motor pump, where the point was accurately found.
R. gest. sust. ambient., Florianópolis, v. 9, n. esp , p. 363-386, fev. 2020
377
Source: Schneider (2014).
For the choice of fixed speed product, the manufacturer's catalog of the previous variable speed pump was explored and a pump with the same structural and hydraulic configurations was chosen, but without drive with frequency inverter, only operating with the fixed speed. The product selected was the Schneider model, VME 9540.
R. gest. sust. ambient., Florianópolis, v. 9, n. esp , p. 363-386, fev. 2020
378
3.4 POWER REQUIRED
The results of power calculations for the two types of pumps are described below, as described in section 3.6.
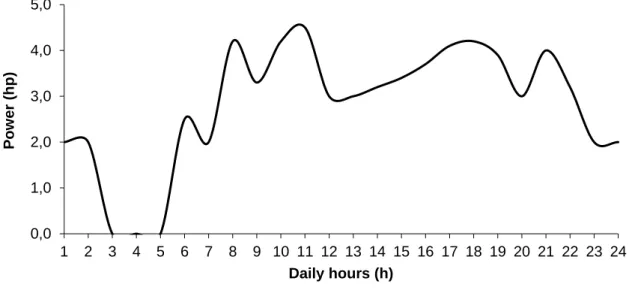
3.4.1 FIXED SPEED
For the fixed-speed pump, since it does not change its speed, the operating powers were extracted directly from the product curve, relating the flow operated at each hour of the day to the power consumption.
The Fig. 5 shows the power used for each hour of the day.
Fig. 4. Power consumption at fixed speed
Source: According to author.
3.4.2 VARIABLE SPEED
For the pump operated with variable speed, a graph was created where all the operating frequencies were understood, following Eq. 4 and 5 of item b in section 3.6. 0,0 1,0 2,0 3,0 4,0 5,0 1 2 3 4 5 6 7 8 9 10 11 12 13 14 15 16 17 18 19 20 21 22 23 24 P o w er ( h p ) Daily hours (h)
R. gest. sust. ambient., Florianópolis, v. 9, n. esp , p. 363-386, fev. 2020
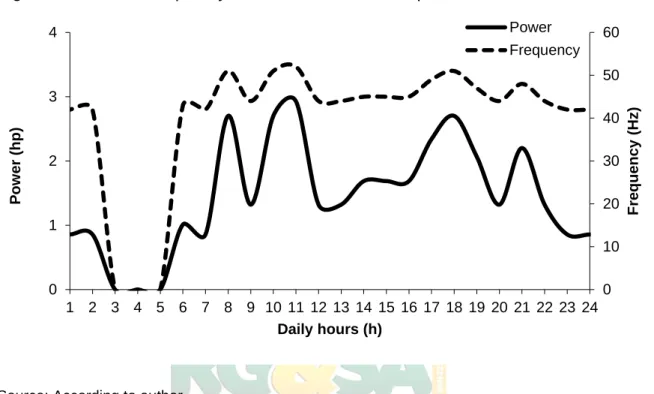
379 The rotational frequencies and power consumed for each hour of the day are shown in the graph of Fig. 6. On the ordinates, the right axis refers to the frequency and left values, to power values, both related to each hour of the day.
Fig. 5. Power and frequency consumed at variable speed
Source: According to author.
In relation to the data found for the powers consumed, a significant difference was observed in relation to the two systems. In the fixed speed system, as the pump always operates at maximum speed the power consumption is higher at all hours of the day. In the variable speed system, as the pump is suitable for consumption by varying the frequency, the pump consumes less power.
3.5 ENERGY CONSUMPTION
In it, the economy in the energy consumption of the pump of varied velocity is clear in comparison with the one of fixed speed.
0 10 20 30 40 50 60 0 1 2 3 4 1 2 3 4 5 6 7 8 9 10 11 12 13 14 15 16 17 18 19 20 21 22 23 24 F requ ency ( Hz ) P o w er ( h p ) Daily hours (h) Power Frequency
R. gest. sust. ambient., Florianópolis, v. 9, n. esp , p. 363-386, fev. 2020
380 Fig. 6. Comparison of energy consumption
Source: According to author.
With the analysis of the graph of Fig. 7, it is noticed that only in the points of lower consumption, in which the pumps work with the minimum power, the values of energy consumption approached. In the rest of the chart, the pump with frequency inverter was more economical. This saving is more evident at the point of greatest consumption (11h), in which the fixed speed pump had an expenditure of approximately 3.78kWh of energy, while in the variable speed pump this expense was approximately 2.46kWh.
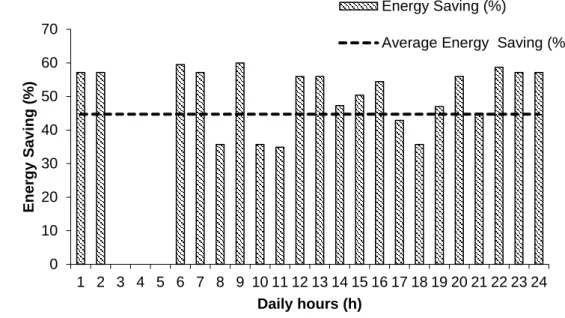
3.6 ENERGY SAVING
As explained, the variable speed pump presented lower energy consumption. Fig. 8 shows a graph of the percentage of energy savings found for each hour of the day. With this information, an average saving of 44.7% was calculated on a day of consumption (24h).
0 1 2 3 4 5 1 2 3 4 5 6 7 8 9 10 11 12 13 14 15 16 17 18 19 20 21 22 23 24 E n er g y ( kW h ) Daily hours (h) Variable Speed Fixed Speed
R. gest. sust. ambient., Florianópolis, v. 9, n. esp , p. 363-386, fev. 2020
381 Fig. 7. Percent of energy savings
Source: According to author.
3.7 COST ANALYSIS
Fig. 9 shows the cost of energy consumption for each hour of the day, according to the values of the energy tariff in force. Table 4 presents the daily and monthly costs for the two pumps, according to the graph of Fig. 9. For daily costs, the values obtained were approximately R$ 25.16 for fixed speed pump and R$ 12.86 for the variable speed. In relation to the monthly costs, the approximate values were R$ 755.01 and R$ 385.90, respectively.
Table 4. Daily and monthly energy cost
Energy Cost (R$) Fixed Speed Variable Speed
Total Daily Cost 25,16 12,86
Total Monthly Cost 755,01 385,90
Source: According to author. 0 10 20 30 40 50 60 70 1 2 3 4 5 6 7 8 9 10 11 12 13 14 15 16 17 18 19 20 21 22 23 24 E n er g y S av ing ( % ) Daily hours (h) Energy Saving (%)
R. gest. sust. ambient., Florianópolis, v. 9, n. esp , p. 363-386, fev. 2020
382 Fig. 8. Cost of energy per hour
Source: According to author.
The monthly cost difference found was R$ 369.11, resulting in an average saving of approximately 48.88% in the use of the pump with varied speed.
4 CONCLUSION
In general, in terms of both cost and energy consumption, the variable speed pump performed better, allowing more significant savings for the building. With these data, it is noted that when investigating the use of a pressurizing system it is not only necessary to analyze the cost of implantation and acquisition of the product, but to give due importance to the operating costs, evidenced by the costs associated with energy which will remain throughout the life of the building and have been reduced with the use of the frequency inverter. It is therefore concluded that the use of the frequency inverter is economically feasible in relation to the energy consumption and, therefore, the costs associated with the electric energy.
0 1 2 0 1 2 3 4 5 6 7 8 9 10 11 12 13 14 15 16 17 18 19 20 21 22 23 24 E n er g y Co st ( R$) Daily hours (h)
R. gest. sust. ambient., Florianópolis, v. 9, n. esp , p. 363-386, fev. 2020
383
REFERENCES
Brazilian Association of Technical Standards - ABNT (1998), NBR 5626 - Cold
water building installation (in Portuguese). ABNT, Rio de Janeiro.
CELESC (2016), Rates. Santa Catarina (in Portuguese), available at: http://www.celesc.com.br/portal/index.php/duvidas-mais-frequentes/1140-tarifa (accessed August 2017).
PROCEL SANEAR and Eletrobrás (2005). Energy Efficiency in Pumping
Systems (in Portuguese). PROCEL SANEAR and Eletrobrás, Rio de Janeiro.
CASTRO-GAMA, M., PAN, Q., LANFRANCHI, E. A., JONOSKI, A., & SOLOMATINE, D. P. (2017). Pump scheduling for a large water distribution
network. Milan, Italy. Procedia Engineering, Vol.186, pp. 436–443.
COSTA, A.F.V (2009), Economical Efficiency in Operation of Water Supply
Pumping Stations (in Portuguese). Faculty of Engineering, University of Porto,
Porto.
CB3E (2015). Survey of the characteristics of Brazilian residential buildings
(in Portuguese). CB3E, available at:
http://cb3e.ufsc.br/sites/default/files/Relatorio_TipologiasResidenciais.pdf. (accessed June 2017).
DIAS, A.M and SEGATTO, E.C (2015). Comparative analysis of energy
efficiency between building water supply systems (in Portuguese).
Engevista, Vol. 17, pp. 83-94.
ENERGY RESEARCH COMPANY - EPE (2018). Statistical Yearbook of
Electricity, EPE, Rio de Janeiro.
FERREIRA, F.T.E.; FONG, J.A.C and ALMEIDA, A.T (2011). Ecoanalysis of
Variable-Speed Drives for Flow Regulation in Pumping Systems. IEEE
transactions on industrial electronics, Vol. 58, pp. 2117-2125.
INSTITUTE OF ADVANCED STUDIES - IEA (2018). Electricity Information
2018 overview. IEA, available at: https://www.iea.org/statistics/electricity/
(accessed July 2019).
LEITE, S.P (2008). Water supply of tall buildings (in Portuguese). Faculty of Engineering, University of Porto, Porto.
LIU, F., OUEDRAOGO, A., MANGHEE, S., and DANILENKO, A. (2012). A
primer on energy efficiency for municipal water and wastewater utilities.
The World Bank Group, Report No.: 001/12.
MACINTYRE, A.J (1987). Pumps and Pumping Facilities (in Portuguese), ed. 2, LTC – Livros Técnicos e Científicos, Rio de Janeiro, BR.
R. gest. sust. ambient., Florianópolis, v. 9, n. esp , p. 363-386, fev. 2020
384 MARCHI, A.; SIMPSON, R. and ERTUGRUL, N. (2012). Assessing variable
speed pump efficiency in water distribution systems, Drinking Water
Enginnering and Science, Vol. 5, pp.15-21.
MESQUITA, R. P (2009). Technical and economic feasibility analysis for the
application of frequency inverters in low power pumping systems (in
Portuguese). Faculty of Engineering, State University of São Paulo, Guaratinguetá.
NETTO, A. (1998). Hydraulics Manual (in Portuguese), ed. 8, Blucher, São Paulo, BR.
ROCHA, A.L.; BARRETO, D. and IOSHIMOTO, E. (1999). Supporting
Technical Document No. E1 - Characterization and Monitoring of Building Water Consumption. Brasilia: National Program to Combat Water Waste -
PNCDA (in Portuguese) available at:
http://www.pmss.gov.br/index.php/biblioteca-virtual/167-documentos-tecnicos-de-apoio-dta. (accessed September 2017).
RODRIGUES, W. (2007). Criteria for Efficient Use of Frequency Drives in
Water Pumping Systems (in Portuguese). Faculty of Civil Engineering,
Architecture and Urbanism, State University of Campinas, Campinas.
RUAS, M.;VITAL, R.;RAMISIO, P.;NUNES, E.; MEDEIROS, C.; SANTOS, A. A.; BELTRÃO, J.; FARINHA, P. and OLIVAL, L. (2005). Pressurization Systems, Engineering Manual (in Portuguese). Bombas Grundfos, Portugal.
SALVADOR, M. and GRIEU, S., 2012. Methodology for the design of energy
production and storage systems in buildings: Minimization of the energy impact on the electricity grid. Elsevier (Energy and Buildings), Vol. 47, pp. 659–
673.
SCHNEIDER (2017). Technical Catalog Pressurization Systems (in
Portuguese). Schneider, available at:
http://www.schneider.ind.br/media/205147/schneider_catalogo_pressurizacao_ 03-2017.pdf. (accessed April 2017).
SCHNEIDER (2014). VFD VME Pumping System (in Portuguese). Schneider, available at: http://www.schneider.ind.br/produtos/sistemas-de-bombeamento/pressuriza%C3%A7%C3%A3o/vfd-vme/#Downloads (accessed June 2017).
SCHNEIDER (2013). VME 3-5-9 Vertical Multistage (in Portuguese). Schneider, available at: http://www.schneider.ind.br/produtos/motobombas-de superf%C3%ADcie/large/multiest%C3%A1gios-vertical/vme-3-5-9 (accessed June 2017)
SNIS (2017). Diagnosis of Water and Sewerage Services (in Portuguese). SNIS, available at: http://www.snis.gov.br/diagnostico-agua-e esgotos/diagnostico-ae-2015 (accessed September 2017)
R. gest. sust. ambient., Florianópolis, v. 9, n. esp , p. 363-386, fev. 2020
385 WEG (2012). Electric Motors: Specification Guide (in Portuguese). Weg, available at: http://ecatalog.weg.net/files/wegnet/WEG-guia-de
especificacao-de-motores-eletricos-50032749-manual-portugues-br.pdf (accessed May 2017).
WEG (2017). Efficient management of electricity (in Portuguese). Weg, available at:
http://ecatalog.weg.net/files/wegnet/WEG-cartilha-weg-uso-eficiente-da-energia-eletrica-50030292-catalogo-portugues-br.pdf (accessed