Universidade de Brasília
Instituto de Ciências ExatasDepartamento de Ciência da Computação
Automatically Fixing Static Analysis Tools Violations
Diego Venâncio Marcilio
Dissertação apresentada como requisito parcial para conclusão do Mestrado em Informática
Orientador
Prof. Dr. Rodrigo Bonifácio de Almeida
Brasília
2019
Universidade de Brasília
Instituto de Ciências ExatasDepartamento de Ciência da Computação
Automatically Fixing Static Analysis Tools Violations
Diego Venâncio Marcilio
Dissertação apresentada como requisito parcial para conclusão do Mestrado em Informática
Prof. Dr. Rodrigo Bonifácio de Almeida (Orientador) CIC/UnB
Prof. Dr. Paulo Meirelles Prof. Dr. Márcio Ribeiro
Universidade de São Paulo Universidade Federal de Alagoas
Prof. Dr. Bruno Luiggi Macchiavello Espinoza
Coordenador do Programa de Pós-graduação em Informática
Dedication
Along my career, both in industry and academia, I had the great luck of being surrounded by great colleagues (including bosses and supervisors). I dedicate this work to them, as I am sure it would not have been possible without their help and support.
Acknowledgements
I thank my supervisor, Dr. Rodrigo Bonifácio, for all the patience and support during all these last years. I also thank all my coauthors for their invaluable support and input on the work done in this dissertation. My friends and family must not also be forgotten. Thank you!
Resumo
A qualidade de software tem se tornado cada vez mais importante à medida que a so-ciedade depende mais de sistemas de software. Defeitos de software podem custar caro à organizações, especialmente quando causam falhas. Ferramentas de análise estática analisam código para encontrar desvios, ou violações, de práticas recomendadas de pro-gramação definidas como regras. Essa análise pode encontrar defeitos de software de forma antecipada, mais rápida e barata, em contraste à inspeções manuais. Para corrigir-se uma violação é necessário que o programador modifique o código problemático. Essas modificações podem ser tediosas, passíveis de erro e repetitivas. Dessa forma, a au-tomação de transformações de código é uma funcionalidade frequentemente requisitada por desenvolvedores. Esse trabalho implementa transformações automáticas para resolver violações identificadas por ferramentas de análise estática. Primeiro, nós investigamos o uso da ferramenta SonarQube, uma ferramenta amplamente utilizada, em duas grandes organizações open-source e duas instituições do Governo Federal do Brasil. Nossos re-sultados mostram que um pequeno subconjunto de regras é responsável por uma grande porção das violações resolvidas. Nós implementamos transformações automáticas para 11 regras do conjunto de regras comumente resolvidas achadas no estudo anterior. Nós submetemos 38 pull requests, incluindo 920 soluções para violações, geradas automati-camente pela nossa técnica para diversos projetos open-source na linguagem Java. Os mantenedores dos projetos aceitaram 84% das nossas transformações, sendo 95% delas sem nenhuma modificação. Esses resultados indicam que nossa abordagem é prática, e pode auxiliar desenvolvedores com resoluções automáticas, uma funcionalidade frequente-mente requisitada.
Abstract
Software quality is becoming more important as the reliance on software systems in-creases. Software defects may have a high cost to organizations as some can lead to software failure. Static analysis tools analyze code to find deviations, or violations, from recommended programming practices defined as rules. This analysis can find software defects earlier, faster, and cheaper than manual inspections. When fixing a violation, a programmer is required to modify the violating code. Such modifications can be tedious, error-prone, and repetitive. Unsurprisingly, automated transformations are frequently re-quested by developers. This work implements automatic transformations tailored to solve violations identified by static analysis tools. First, we investigate the use of SonarQube, a widely used Static Analysis Tool, in two large open source organizations and two Brazil-ian Government Federal Institutions. Our results show that a small subset of the rules is responsible for a large portion of the fixes. We implement automatic fixes for 11 rules from the previously found set of frequently fixed rules. We submitted 38 pull requests, including 920 fixes generated automatically by our technique for various open-source Java projects. Projects maintainers accepted 84% of our fixes (95% of them without any mod-ifications). These results indicate that our approach is feasible, and can aid developers with automatic fixes, a long requested feature.
Contents
1 Introduction 1
1.1 Software Quality . . . 2
1.2 Static Analysis . . . 3
1.3 Automatic Static Analysis Tools . . . 3
1.4 Program Transformation . . . 4
1.5 Research Questions . . . 5
1.5.1 Perceptions and practices on fixing ASATs’ violations . . . 6
1.5.2 Automatically providing fix suggestions for ASATs’ violations . . . 7
1.6 Contributions . . . 9
1.7 Dissertation structure . . . 10
2 Are Static Analysis Violations Really Fixed? A Closer Look at Real-istic Usage of SonarQube 11 2.1 Study Settings . . . 13
2.1.1 Research Goal . . . 13
2.1.2 Research Questions . . . 13
2.1.3 Research Methods . . . 14
2.1.4 SonarQube Data Collection . . . 15
2.2 Results . . . 16
2.2.1 What are the practitioners’ perceptions about the use of static analysis tools? (RQ2.1) . . . 16
2.2.2 How often developers fix issues found by SonarQube? (RQ2.2) . . . 18
2.2.3 What are the SonarQube issues that developers fix more frequently? (RQ2.3) . . . 23
2.2.4 How is the distribution of the SonarQube issues? (RQ2.4) . . . 25
2.3 Discussion . . . 27
3 Automatically Generating Fix Suggestions in Response to Static Code
Analysis Warnings 29
3.1 SpongeBugs: Approach and Implementation . . . 31
3.1.1 Rule Selection . . . 31
3.1.2 How SpongeBugs Works . . . 33
3.2 Empirical Evaluation of SpongeBugs: Experimental Design . . . 34
3.2.1 Research Questions . . . 35
3.2.2 Selecting Projects for the Evaluation . . . 35
3.2.3 Submitting Pull Requests With Fixes Made by SpongeBugs . . . 36
3.3 Empirical Evaluation of SpongeBugs: Results and Discussion . . . 38
3.3.1 RQ3.1: Applicability . . . 38
3.3.2 RQ3.2: Effectiveness and Acceptability . . . 41
3.3.3 RQ3.3: Performance . . . 45
3.3.4 Discussion . . . 47
3.4 Conclusions . . . 48
4 Conclusions 50 4.1 Related Work . . . 51
4.2 Threats to Validity and Limitations . . . 52
4.2.1 Identifying what kind of violations developers tend to fix . . . 52
4.2.2 Automatically providing fix suggestions for ASATs’ violations . . . 53
4.3 Future Work . . . 54
List of Figures
2.1 Do you agree that warning messages reported by ASAT tools are relevant for improving the design and implementation of software? (Q1) . . . 16 2.2 Survey responses on whether respondents postpone a release (Q6), reject
pull-requests (Q5), or use transformation tools (Q3). . . 17 2.3 How important is the use of program transformation tools to fix issues
re-ported by ASATs? (Q4) . . . 17 2.4 Descriptive statistics with the interval in days to fix reported issues (grouped
by organization) . . . 18 2.5 Speed resolutions of the organizations . . . 19 2.6 Mean differences of the interval in days to fix issues, considering the severity
of the issues . . . 20 2.7 Number of issues fixed after one year they had been reported . . . 21 2.8 Descriptive statistics with the interval in days to fix reported issues (grouped
List of Tables
1.1 GQM related to the goal of investigating what kind of violations developers
tend to fix . . . 5
1.2 GQM related to the goal of studying whether automatically fixing issues is applicable in supporting developers to improve quality attributes of a system 5 2.1 Survey questions answered by all 18 participants . . . 14
2.2 Overview of the collected data. The last column indicates quantity of (W)on’t (F)ix and (F)alse-(P)ositive issues. . . 16
2.3 Descriptive statistics related to the number of days for fixing issues . . . 19
2.4 Speed resolutions for PF’s different lines of software development projects . 19 2.5 Some descriptive statistics related to the frequency based metrics . . . 22
2.6 Issues fixed per day of the week . . . 23
2.7 Most frequently fixed issues by type in each organization . . . 24
2.8 Most frequently fixed issues classifying severity to type . . . 24
2.9 Most frequently fixed issues in all organizations . . . 25
3.1 The 11 static code analysis rules that SpongeBugs can provide fix suggestions for. The rule descriptions are based on SonarQube’s, which classifies rules in (B)ugs and (C)ode smells. . . 32
3.2 The 15 projects we selected for evaluating SpongeBugs. For each project, the table report its domain, and data from its GitHub repository: the number of stars, forks, contributors, and the size in lines of code. Since Eclipse’s GitHub repository is a secondary mirror of the main repository, the corresponding data may not reflect the project’s latest state. . . 36
3.3 Responses to our inquiries about whether it is OK to submit a pull request to each project, and how many pull requests were eventually submitted and approved. . . 38
3.4 For each project and each rule checked by SonarQube, the table reports two numbers x/y: x is the number of warnings violating that rule found by SonarQube on the original project; y is the number of warnings that have disappeared after running SpongeBugs on the project and applying all its fix suggestions for the rule. The two rightmost columns summarize the data per project (total), and report the percentage of warnings that SpongeBugs successfully fixed (fixed %). The two bottom rows summarize the data per rule in the same way. . . 39 3.5 Descriptive statistics summarizing 5 repeated runs of SpongeBugs. Time is
measured in minutes. . . 46 3.6 Descriptive statistics summarizing 5 repeated runs of SpongeBugs on the 5
Chapter 1
Introduction
Software quality is becoming more important as society is increasingly more dependent on software systems. Software defects, or bugs, may incur in a high cost to companies, especially when they cause failures [1]. To circumvent these potential problems, there are are some strategies to assess and assure quality in software, including tests and source code reviews [1].
As an example, Automatic Static Analysis Tools (ASATs) provide means of analyzing source code without the necessity of running it, aiding the quality assurance task during the software development process. ASATs can find potential problems in the source
code [2], also named source-code violations, that indicate deviations from recommended
coding standards or good practices [3], which are verified by rules defined within an ASAT. ASATs are widely used for both private and open-source software development [4,5]. Some organizations even employ development workflows stating that a project needs to comply to ASATs checks before a release [3, 6].
To correct these violations, developers need to take action—commonly applying a source code transformation. Such transformations can be tedious, error-prone, require changes on multiple lines and files, and, in some cases, also require non-trivial inferences
and considerations [7, 8]. These hindrances reinforce the need for automatic program
transformations.
The overarching motivation for this dissertation is to aid developers in reducing ASATs’ violations by automatically transforming offending Java source code. To fulfill this goal, we first explore what kind of violations developers tend to fix (see Chapter 2). With this information, we select commonly fixed violations to implement the SpongeBugs tool, which currently support program transformations that fix 11 Java rules. As shown in Chapter 3, SpongeBugs is effective to solve a high percentage (81%) of common violations while scaling, performance wise, satisfactorily to large code bases. Moreover, SpongeBugs’ generated patches have a high acceptance rate, which might indicate its applicability in
helping developers reduce the technical debt incurred by ASATs’ violations.
This chapter introduces the concepts, research questions, research methods, contribu-tions, and the overall structure of this dissertation.
1.1
Software Quality
Software quality, per ISO/IEC 24765, can be defined as the capacity of a software product in satisfying explicit and implicit necessities when used under specific conditions [9].
When trying to measure quality in software, a vast variety of dimensions and factors have been proposed. Each one of them aims at defining a set of characteristics that, when fulfilled, increase the chances of producing a high-quality software [10]. One classification for these characteristics is to divide them into two categories: 1) external attributes; and 2) internal attributes [11].
External attributes are visible to the users of a system, while internal attributes are
of the developers’ interest [11]. Measuring external attributes, such as usability and
portability, poses several challenges and difficulties as the assessment usually involves the knowledge and experience from the users of the software [12]. Internal quality attributes
are much easier to be quantified in comparison to external attributes [13]. They are
independent of the environment in which they execute and can be measured by only observing its source code [13]. In general, software users are only concerned with external quality attributes, but the internal attributes are the reason that those external attributes were reached in the first place [11]. In this way, it is recommended to determine a system’s external attributes by observing its internal quality attributes [14], since there are well defined metrics to measure internal quality attributes [12]. Examples of internal attributes are size, cohesion, and coupling [13], and examples of metrics that measure these attributes
are, respectively [12]: LOC (Lines of Code), LCOM (Lack of Cohesion in Methods), and
COF (Coupling Factor).
The ISO/IEC 25010 [15] states that internal quality software attributes represent
static attributes of a software product that are related to its architecture, structure, and components. These attributes can be verified by employing revision, inspection, simulation, and/or automatic tools. One of the ways used by automatic tools to inspect source code is Static Analysis, which calculate several software metrics, among other aspects. We discuss Static Analysis in Section 1.2.
1.2
Static Analysis
Static analysis is a verification technique that examines source code without running the program. It aims at capturing defects earlier in the development process, aiding on improving software quality [1].
A relevant motivation for the technique is that certain kinds of defects are rarely observed, be it from rarely occurring, or from not representing problems perceived as severe enough [16]. ASATs can find an important class of problems that are typically not found neither by unit tests nor by manual inspections [17].
While software tests may detect a potentially large fraction of defects, they may be disadvantageous due to its high cost [16]. Tests are also written by humans, which might result in incorrect and incomplete judgments when assessing source code functionality [17].
ASATs should complement the test activity in a software quality assurance process [17].
ASATs can be integrated to the development pipeline by a variety of ways, such as on demand, just in time before the source code is stored in a source management system,
or continuously during software development activities [1]. The latter can be achieved
through the adoption of continuous integration (CI) practices, specifically by continuous inspection, which includes static analysis of source code [18].
1.3
Automatic Static Analysis Tools
Several tools integrate static analysis into development workflows, including SonarQube.
SonarQube [19] is one of the most adopted code analysis tool in the context of CI
envi-ronments [18, 20]. It supports more than 25 languages and is used by more than 85,000
organizations. SonarQube includes its own rules and configurations, but new rules can be added. Notably, it incorporates popular rules of other static and dynamic code analysis
tools, such as FindBugs and PMD [18].
SonarQube considers rules as coding standards. When a piece of code violates a rule, an issue is raised. SonarQube classifies issues by type and severity. Issues’ types are
related to the code itself [21]. There are three broad kinds of issues on SonarQube. A
Bug occurs when an issue is related to a piece of code that is demonstrably wrong. A Vulnerability occurs when a piece of code could be exploited to cause harm to the
system. Finally, a Code smell occurs when an issue represent instances of improper code, which are neither a bug nor a vulnerability.
The severities of issues can also be categorized by their possible impact, either on the system or on the developer’s productivity. Blocker and critical issues might impact negatively the system, with blocker issues having a higher probability compared to critical
ones. SonarQube recommended to fix these kind of issues as soon as possible1. Major
issues can highly impact the productivity of a developer, while minor ones have little impact. Finally, info issues represent all issues that are neither a bug nor a quality flaw. In SonarQube, issues flow through a lifecycle, taking one of multiple possible statuses, namely: open, which is set by SonarQube on new issues; resolved, set manually to indicate that an issue should be closed; closed, which is set automatically by SonarQube when an issue is fixed.
1.4
Program Transformation
Program transformation can be applied in diverse software engineering areas such as compilation, optimization, refactorings, and software rejuvenation [22]. The goal of trans-forming programs is to increase the developers’ productivity by automating programming tasks, thus, allowing the developer to focus more in high-level details, which might increase external software attributes such as maintainability and reusability [22].
Even though programs are written as text, a textual representation is often not appro-priate to apply complex transformations [22]. In this manner, a structured representation, along with semantic rules, of the program is needed. The structure allows programs to be transformed while the semantics provide means of comparing programs and of verifying the feasibility of applying transformations [22].
Transforming a program involves changing a program to another. It can also describe, more formally, the algorithm that implements the program transformation. The language in which the program being transformed and the resulting program are written is called
the source and target languages, respectively [22]. When a program is transformed and
both source and target are in the same programming language, this process is called as
rephrasing [22]. Rephrasing usually aims at improving one internal quality attribute of
the program [22].
A parse tree is a graphical representation that corresponds to the input program [23]. Parse trees contain syntactic information such as layout (blank spaces and commen-taries) [22], and thus they are relatively large in comparison to the source code [23]. This information is usually not relevant to a large portion of transformations; thus, parse
trees are frequently transformed into abstract syntax trees (ASTs) [22]. An AST retains
the essential structure of the parse tree but eliminates unnecessary syntactic
informa-tion [23]. ASTs are widely used in compilers and interpreters. Source-to-source systems
often use ASTs to regenerate code easily [23].
1
In this thesis we developed SpongeBugs, a program transformation tools that aims
to fix issues of ASATs. SpongeBugs is implemented in Rascal [24], a domain-specific
language for source code analysis and manipulation, which facilitates several common meta-programming tasks, such as traversing the program structure, pattern matching, defining templates for program transformation, and extracting an AST from source code.
1.5
Research Questions
This research explores the topic of “Automatic static analysis tools’ violations”. We ad-dress two main research questions here:
(RQ1) What kind of violations developers tend to fix?
(RQ2) Is it possible to reliably aid developers with automatic fixes for static analysis tools’ violations
We structure our research goals using a GQM (Goals/Questions/Metrics) template [25]
in Table 1.1 and Table 1.2. Then we introduce in Sections 1.5.1 and 1.5.2 the empirical evaluation done to answer the research questions.
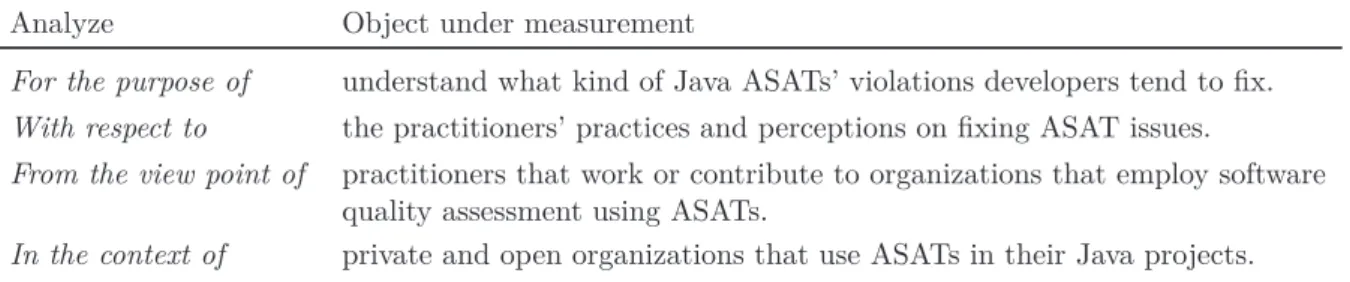
Analyze Object under measurement
For the purpose of understand what kind of Java ASATs’ violations developers tend to fix.
With respect to the practitioners’ practices and perceptions on fixing ASAT issues.
From the view point of practitioners that work or contribute to organizations that employ software quality assessment using ASATs.
In the context of private and open organizations that use ASATs in their Java projects.
Table 1.1: GQM related to the goal of investigating what kind of violations developers tend to fix
Analyze Object under measurement
For the purpose of evaluate whether automatically fixing ASATs’ violations is applicable in supporting developers .
With respect to the applicability of the proposed tool (SpongeBugs) on: (a) how many rules it can detect and fix;
(b) how many of the fixes are accepted by open-source maintainers; (c) how scalable it is in terms of running time on large code bases.
From the view point of open-source projects maintainers.
In the context of well established open-source projects that utilize SonarQube.
Table 1.2: GQM related to the goal of studying whether automatically fixing issues is applicable in supporting developers to improve quality attributes of a system
1.5.1
Perceptions and practices on fixing ASATs’ violations
Even though the use of ASATs provide several benefits, developers face several challenges when using and adopting ASATs [1,26]. Practitioners may find a high number of warnings, and often in the thousands, when analyzing code with these tools, especially on the first
time a set of rules is run [1]. This high number of warnings hinders the developer task
of filtering through issues, which can result in violations being ignored [26]. To better select a representative set of rules that developers may find valuable, we investigate what kind of issues are frequently fixed in hundred of systems from two large open-source foundations (Apache Software Foundation and Eclipse Foundation) and two Brazilian Federal Government institutions (Brazilian Court of Account (TCU) and the Brazilian Federal Police (PF)). We follow the rationale introduced by Liu et al. [27] that frequently fixed rules are more likely to correspond to issues that developers are interested.
Background
Although previous works have already investigated how open-source software (OSS) projects use ASATs (e.g., [6, 21, 27]), we find gaps in their findings. Digkas et al. [21] and Liu et al. [27] study which kind of violations developers tend to fix on SonarQube and FindBugs, respectively. SonarQube and FindBugs are Static Analysis Tools widely used in practice and studied in the literature. Both studies rely on revisions of the projects and then run the ASATs. We argue that this might not reflect the precise usage of these tools. Also, their study restricted some type of rules and did not have any industrial projects in their datasets.
(RQ1) What kind of violations developers tend to fix?
This research question aims to build a broad comprehension of how developers use Sonar-Qube and how they respond to the warnings reported by it. We observed a realistic usage of SonarQube, which do not rely on software revisions. As stated by Liu et al., when researchers investigate fixes by running the tool on revisions, they face the threat that developers might not use the ASAT in their toolchain. This possible lack of use might lead to a piece of code reported as fixed that was not ever perceived as a violation, thus, not fixed intentionally. Consequently, previous studies did not precisely report on how developers respond to violations.
Research Method
To answer this research question, we first conducted an online survey with 18 developers of the analyzed projects from the four studied organizations. We asked 6 closed questions
mainly using a Likert scale [28]. The estimated time to complete the survey was between 12 to 15 minutes. The survey was available for approximately one month, and in the end, we had a completion rate of 23% (18 developers from 81 unique visits).
For our quantitative analysis, we identified 4 SonarQube instances, one for each or-ganization studied. Our selection focused on projects from Eclipse Foundation (EF) and
Apache Software Foundation (ASF), two of the largest open-source foundations [29]. For
our private datasets, we selected two Brazilian government institutions not only due to convenience, also because they have heterogeneous contexts: TCU does in-house devel-opment whereas PF mostly outsources. We then implemented a tool to mine data from these instances. Overall, we mined 421,976 issues from 246 projects. We leveraged statis-tical techniques, including exploratory data analysis (plots and descriptive statistics) and hypothesis testing methods to analyze our mined data and then investigate the practices for fixing issues.
Summary of the Results
The survey results indicate that more than 80% of the developers consider ASATs warnings relevant for overall software improvement. In some cases (22%) developers postpone at least once a release or reject a pull-request based on the output of ASATs. Moreover, more than 60% of the developers consider program transformation tools to fix issues automatically. However, 66.6% of the respondents never or rarely use a tool for this purpose. This reinforces the need for tools that focus on fixing ASATs violations.
Our quantitative analysis found a low resolution of issues (only 8.77% of the issues were fixed). ASATs’ violations are fixed in median faster than bugs, and some issues are fixed faster than others. We found that violations classified as Code Smells (improper code) are responsible for almost 70% of all of the fixed issues. Interestingly, some kind of issues is present among the most fixed and also the most non-fixed sets. This indicates that developers consider a variety of factors when deciding whether to fix an issue. Additionally, our results show that 20% of the rules correspond to 80% of the fixes, which paves the way for selecting a subset of the rules that developers might find valuable.
1.5.2
Automatically providing fix suggestions for ASATs’
viola-tions
Developers frequently request tools that can fix ASATs’ violations. However, implement-ing fixes poses several challenges. First, ASATs are infamously known for their high percentage of false-positives (issues that do not represent an actual problem). Fixing violations that developers do not perceive as a real problem might be a waste of time
(in particular, to time to review the modifications, which can span multiple lines of code and files). Secondly, a common limitation in the program repair literature is to generate fixes, or patches, that developers find acceptable. Fixing a violation is often not enough. Developers must assess that the patch has enough quality. Lastly, the approach must not take a long time to run. A tool should integrate within the developer workflow, not be on his way.
Background
Automatic Static analysis tools (ASATs), such as SonarQube and FindBugs/SpotBugs, analyze source code by checking it against several independent rules, which developers can select. Each rule describes a good practice or recommended behavior that high-quality code should follow. Whenever a piece of code violates one of the rules, the static analysis tool emits a warning, which typically indicates the violating piece of code and the rule which the violations refers to. A developer must assess whether the violation indeed represents a deviation from good practice, and in the case it is, must also come up with a fix that modifies the source-code to remove the warning. Previous work [5], which presents the tool AVATAR, has already explored automatic fixes for ASATs. However, AVATAR focuses exclusively on behavioral semantic bugs, which infer behavioral properties that can be used to perform program optimizations as well as performance problems.
(RQ2) Is it possible to reliably aid developers with automatic fixes for static analysis tools’ violations?
This research question aims to evaluate whether our approach (SpongeBugs) to fix
syn-tactic design flaws (identified by ASATs) is practical on three different perspectives: a)
the ratio of the identified violations, for the rules it implements, that SpongeBugs can fix; b) whether developers find the fixes generated by SpongeBugs acceptable; c) whether SpongeBugs scales reasonably in large code bases. By answering these questions, we can assess whether SpongeBugs can reliably aid developers.
Research Method
We selected and implemented fixes for 11 rules from previous studies that explored ASATs’ issues. We select 15 open-source Java projects that use SonarQube to evaluate our ap-proach. We ran SonarQube before and after applying our fixes, calculating the number of open and fixed issues. To evaluate the acceptance for our patches, we submit 38 pull-requests containing more than 920 fixes for our selected projects. After contacting developers to find out if our proposed fixes are welcome, we end with 12 projects. These
projects include the Eclipse IDE and ASATs such as SonarQube and SpotBugs (successor to FindBugs). Finally, we analyze how long SpongeBugs takes to run in projects with varying sizes.
Summary of the Results
SpongeBugs is able to fix 81% of all the violations found by SonarQube for the rules it implements. Regarding the developers’ acceptance on the generated fixes, 34 of the 38 pull-requests were accepted. Developers accepted 84% of the fixes, with 95% of them accepted without modifications. SpongeBugs approach scales on projects of realistic size, it can run in under 10 minutes on project as large as 550 thousands lines of source-code.
1.6
Contributions
This sections lists and summarizes the peer-reviewed contributions, and explains how they are mapped to the chapters in this dissertation. I was the primary author of these two publications.
A Closer Look at Realistic Usage of ASAT tools
Chapter 2 answers our RQ1 by mining SonarQube data from two large open-source foun-dations and two Brazilian Federal Government institutions. We find that a small set of rules are responsible for a large portion of the fixes.
Diego Marcilio, Rodrigo Bonifácio, Eduardo Monteiro, Edna Canedo, Welder Luz, and Gustavo Pinto. 2019. “Are static analysis violations really fixed?: a closer look at realistic usage of SonarQube”. In Proceedings of the 27th International Conference on Program Comprehension (ICPC ’19). IEEE Press, Piscataway, NJ, USA, 209-219. DOI: https://doi.org/10.1109/ICPC.2019.00040
SpongeBugs: Automatically Generating Fix for ASATs warnings
Chapter 3 answers RQ2 by proposing a tool (SpongeBugs) that automatically fixes vio-lations from ASATs. We found that our tool is practical as more than 84% of the fixes submitted to open-source projects were accepted. Moreover, 95% of them were accepted without modification. The results of this investigation was accepted for publication at SCAM 2019 (19th IEEE International Working Conference on Source Code Analysis and Manipulation).
Diego Marcilio, Carlo A. Furia, Rodrigo Bonifacio, Gustavo Pinto. “Automatically Generating Fix Suggestions in Response to Static Code Analysis Warnings”. 2019
IEEE 19th International Working Conference on Source Code Analysis and Manip-ulation (SCAM), Cleveland, 2019
Moreover, when answering RQ2 we identified that Rascal’s Java 8 grammar was lacking
Binary Literals2, which allows numbers to be expressed in the binary number system. We
contributed with Rascal’s grammar by adding support to Binary Literals in this
pull-request: https://github.com/usethesource/rascal/pull/1245
Datasets and Tools
The study detailed in Chapter 2 produced a large dataset with 421,976 issues from 246 projects. This dataset is publicly available as:
Diego Marcilio, Rodrigo Bonifácio, Eduardo Monteiro, Edna Canedo, Welder Luz, & Gustavo Pinto. (2019). Are Static Analysis Violations Really Fixed? A Closer Look at Realistic Usage of SonarQube. Dataset for OSS organizations (Version 1) [Data set]. Zenodo. http://doi.org/10.5281/zenodo.2602039
We also make available two tools developed during this research.
• SonarQube Issues Miner: The source-code for our tool used to mine SonarQube
in Chapter 2 is available at: https://github.com/dvmarcilio/sonar-issues-miner
• SpongeBugs: The source-code for our tool that fix ASATs’ issues automatically and all the data produced by Chapter 3 (e.g., questions for OSS maintainers and
sub-mitted pull-requests) are available at: https://github.com/dvmarcilio/spongebugs
1.7
Dissertation structure
As introduced in this chapter, the following two chapters answer the main research ques-tions (see Section 1.5) related to the primary goal of this dissertation: aid developers in reducing ASATs’ violations by automatically transforming offending source-code. Chap-ter 4 summarizes the conclusions of these chapChap-ters and discusses future research work.
2
Chapter 2
Are Static Analysis Violations
Really Fixed? A Closer Look at
Realistic Usage of SonarQube
The rapid growth of software development activities over the past decade has in-creased the focus on the reliability and quality of software systems, which also incurs in associated costs to ensure these characteristics [30]. The use of Automatic Static Anal-ysis Tools (ASATs) is a prominent approach to improve internal quality attributes, as they reveal recurrent code violations without having the cost of running the program [1]. By mainly leveraging heuristic pattern matching approaches to scan source/binary code, these tools can be used for a variety of purposes [26,20,31], such as automatically identify refactoring opportunities [32], detect security vulnerabilities [33], highlight performance bottlenecks [34], and bad programming practices, such as code smells [35].
One organization can leverage the benefits of using static analysis tools when they are integrated in the development pipeline—for instance, through the adoption of Continuous Integration (CI) practices [20,31,18]. An important principle of CI is continuous inspec-tion, which includes static analysis of source code, among other types of assessments, on every change of the software [18]. Even though the use of ASATs provide several benefits, developers still face challenges when using them [1, 26]. One common reason is the high number of false positive violations, which can reach the thousands as reported by Johnson et al. [1]. Another related barrier is filtering through warnings to find defects that are worth fixing, as violations are often ignored [26].
This chapter was previously published as: Diego Marcilio, Rodrigo Bonifácio, Eduardo Mon-teiro, Edna Canedo, Welder Luz, and Gustavo Pinto. 2019. Are static analysis violations really fixed?: a closer look at realistic usage of SonarQube. In Proceedings of the 27th International Con-ference on Program Comprehension (ICPC ’19). IEEE Press, Piscataway, NJ, USA, 209-219. DOI: https://doi.org/10.1109/ICPC.2019.00040
Previous works have already investigated how open-source software (OSS) projects take advantage of ASATs (e.g., [6, 21, 27]). For instance, Beller et al. [6] found that ASAT tools are widely used, with most projects relying on a single ASAT tool. Recent
studies [21, 27] have focused on what kind of violations developers tend to fix. We
challenge this perspective as researchers had to run the static analysis tools themselves on multiple revisions of the projects. As stated by Liu et al. [27], many developers do not use ASATs as part of their development tool chain. Consequently, a piece of code flagged as a fixed issue by these studies may never have been perceived as a violation, and thus fixed unintentionally. We argue that this fact has a significant impact on how developers react to violations. Furthermore, the studies restricted their analysis to OSS projects.
In this chapter we present the results of an in-depth, multi-method study that aims to increase the comprehension of how developers respond to violations reported by ASATs. To achieve this goal, we first conduct a survey with practitioners, in order to better un-derstand the relevance of using static analysis tools and the general procedures developers take to deal with the reported issues. We found that developers consider the use of static analysis tools relevant for improving software quality. Developers also use the outcomes of these tools to decide about postponing a release or accepting / rejecting source code contributions. We then curate and mine a dataset of issues reported from both OSS and industrial projects that actually use the SonarQube ASAT, the leading product for continuous code inspection, used by more than 85,000 organizations.
Our study comprehends 373,413 non-fixed violations and 36,974 fixed violations span-ning from 246 Java projects distributed in four distinct SonarQube instances, two from
Eclipse (EF) and Apache foundations (ASF)—both well-known Java ecosystems [21,29]—
and two from Brazilian government institutions, the Brazilian Federal Court of Accounts (TCU) and the Brazilian Federal Police (PF). Altogether, in this chapter we answer ques-tions related to (a) the percepques-tions of the reported issues and (b) the practices for fixing
them. Accordingly, we present the following contributions:
• We present how experienced practitioners use the reports of a static analysis tool. • We report the results of an in depth analysis of issues and fixes from four different
instances of SonarQube.
• We implement and make available an approach for mining issues from SonarQube.
• We make available an extensive dataset1 of issues from open-source Java projects.
1
2.1
Study Settings
In this section we describe the settings of our study. We first state the goal of our investigation, and then we present details about the research questions we address and the procedures we take to conduct the study and collect issues from the SonarQube instances.
2.1.1
Research Goal
The main goal of this chapter is to build a broad comprehension about how developers use the static analysis SonarQube tool, as well as to characterize how they respond to the warnings reported by these tools. Differently from previous works [21, 27], here we focus on both open-source and private organizations.
2.1.2
Research Questions
We conduct a multi-method study to investigate the following research questions: (RQ2.1) What are the practitioners’ perceptions about the use of static analysis tools? (RQ2.2) How often developers fix issues found in open-source and private SonarQube
instances?
(RQ2.3) What are the SonarQube issues that developers fix more frequently?
(RQ2.4) How is the distribution of the SonarQube issues? That is, do 20% of the issues correspond to 80% of the fixes? Do 20% of the files lead to 80% of the issues? To answer RQ2.1 we use a survey approach. We explore whether the use of ASATs is relevant to improve software quality, considering the perspective of practitioners. We also use the answers to RQ2.1 to support the discussion about the results of the second study.
To answer the remaining questions we use a mining software repository approach. The goal in this case is to comprehend the dynamics for fixing issues reported by Sonar-Qube. The last research question might help practitioners to configure static analysis tools properly, and thus avoid a huge number of false-positives. Moreover, it might also help developers plan their activities in a more effective way, reducing the efforts to improve the internal quality of the systems.
We consider different perspectives to answer these questions, including the character-istics of the systems (e.g., legacy or greenfield systems, private or open-source systems) and the type and severity of the issues. The datasets we use in the investigation include issues from four SonarQube instances, two publicly available, and two private ones.
ID Question
Q1 Do you agree that warning messages reported by ASATs are relevant for improving the design and implementation of software? Q2 How do you fix the issues reported by Automatic Static Analysis Tools?
Q3 How often do you use program transformation tools to automatically fix issues reported by Automatic Static Analysis Tools? Q4 How important is the use of program transformation tools to fix issues reported by ASATs?
Q5 How often do you reject pull-requests based on the issues reported by ASATs? Q6 How often do you postpone a release based on the issues reported by ASATs?
Table 2.1: Survey questions answered by all 18 participants
2.1.3
Research Methods
To answer the first research question, we conduct an online survey with developers from the four organizations in which we focus our study. We asked 6 closed questions (see
Table 2.1) mainly using a Likert scale [28]. For the OSS foundations we asked for
par-ticipation on mailing lists, while for the private organizations we reached our personal contacts. The survey was available for approximately one month. Participation was vol-untary and all the participants allowed the researcher to use and disclose the information provided while conducting the research. The estimated time to complete the survey was 12-15 minutes. 18 developers, from 81 unique visits (completion rate of 23%), answered all questions of our questionnaire.
The majority of the participants identified themselves, although it was not manda-tory. Among the respondents, 50% have more than ten years of experience in software development, 27.77% have between four and ten years, and 22.23% have under four years. Regarding the time using ASATs, 33.33% have more than four years, and the remaining 66.67% have under than four years.
To investigate the practices for fixing issues (RQ2.2) – (RQ2.4), we mine four
dif-ferent SonarQube repositories. We focus on projects from Eclipse Foundation (EF) and
Apache Software Foundation (ASF). This decision is based on the work of Izquierdo and
Cabot [29], which analyzes 89 software foundations in OSS development and both EF
and ASF were the largest in terms of projects they support (216 for EF and 312 for ASF). Moreover, their projects are known for high quality and wide adoption in the OSS community [21].
Our private datasets from Brazilian government institutions are selected not only due to convenience (we got permission to mine their issue databases), but also because they represent a heterogeneous context. TCU does inhouse development whereas PF mostly outsources. More important to this chapter, they both enforce conformity to SonarQube quality checks in their development processes. We restricted our analysis to the Java programming language, since it is the programming language used in the majority of projects available in the selected OSS foundations [36] and is also the primary
programming language used in the private datasets. In addition, SonarQube has a very mature analysis for Java projects, with more than 525 rules.
We leverage statistical techniques during the analysis of this chapter, including ex-ploratory data analysis (considering plots and descriptive statistics) and hypothesis testing methods. In particular, we use the non-parametric Kruskal-Wallis hypothesis testing [37] to understand whether or not the severity of a given issue influences the interval in days of the fix. We also use the Dunn test [38] to conduct a multiple comparison of the means. We chose non-parametric methods because our data does not follow a normal distribution. As such, we used the Spearman’s rank correlation test [39] to investigate the correlation between variables.
2.1.4
SonarQube Data Collection
We implement a tool2 that is able to extract several data from SonarQube instances. The
data collection is done by querying the API provided in the instance itself. One challenge hidden in this activity is to deal with distinct versions of SonarQube, as parameters and responses differ from versions with large disparities. We found that OSS projects rely on older versions of SonarQube: EF uses 4.5.7 (major version from September, 2014) and ASF uses 5.6.3 (major version from June, 2016). Interestingly, those are Long Term Support (LTS) versions. The private instances rely on newer versions (the 7.x, released after 2018). None of them is a LTS version though, although they can be queried in the same fashion. The data collection took place during the months of November / December of 2018, though we updated the datasets also in January 2019.
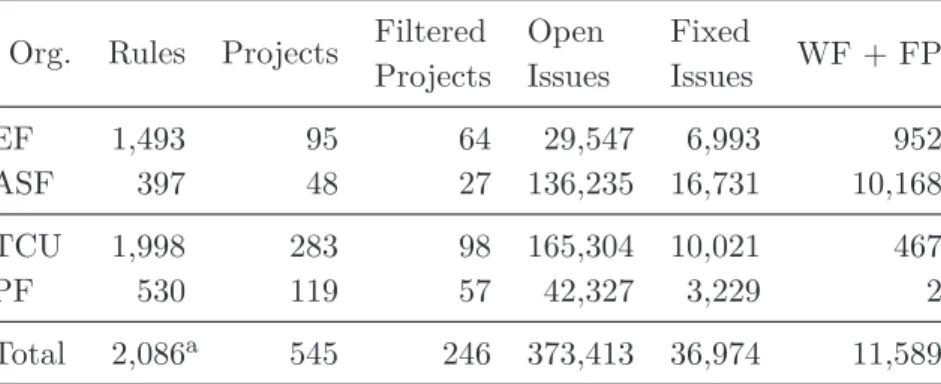
For each SonarQube instance, we gather data for rules, projects, and their issues. As aforementioned, rules indicate whether instances use customized rules or not. Even though SonarQube encompasses rules from other ASATs, such as FindBugs and CheckStyle, we found that EF and TCU use a significant number of customized rules from these ASATs. We filter out 28 projects to remove branches that are considered as projects in SonarQube, a situation particular in the TCU’s repository. The next step collects issues: open, fixed, won’t fix, and false-positives. To filter out non-desired projects, such as toy projects, inactive and demos [40], we apply a filter to consider only projects with at least one Java fixed issue. We removed 31 projects from EF, 21 from ASF, 62 from PF and 157 from TCU when applying this filter. Table 2.2 presents an overview of the whole dataset.
Overall we collected data from 246 Java software projects. Altogether, these software projects employed 4,319 rules (2,086 distinct ones). Still, these projects had reported a total of 421,976 issues (373,413 labeled as open, 36,974 as fixed, and 11,589 as won’t fix or false positive).
2
Org. Rules Projects Filtered Projects Open Issues Fixed Issues WF + FP EF 1,493 95 64 29,547 6,993 952 ASF 397 48 27 136,235 16,731 10,168 TCU 1,998 283 98 165,304 10,021 467 PF 530 119 57 42,327 3,229 2 Total 2,086a 545 246 373,413 36,974 11,589 a Distinct rules
Table 2.2: Overview of the collected data. The last column indicates quantity of (W)on’t (F)ix and (F)alse-(P)ositive issues.
2.2
Results
In this section we present the main findings of this chapter, answering the general research questions we investigate.
2.2.1
What are the practitioners’ perceptions about the use of
static analysis tools? (RQ2.1)
The findings from our survey indicate that: (a) developers consider ASATs warnings as relevant for overall software improvement (Q1), and (b) developers typically fix the issues along the implementation of bug fixes and new features (Q2), i.e., without creating specific tasks / branches for fixing the reported issues. Perhaps due to the small effort to fix part of the issues, this task does not become a first class planned activity, and thus may not require their own development branches.
6% 11% 83%
Relevance
100 50 0 50 100
Percentage
Response Strongly Disagree Disagree Undecided Agree Strongly Agree
Figure 2.1: Do you agree that warning messages reported by ASAT tools are relevant for improving the design and implementation of software? (Q1)
More than 80% of the respondents said that they agree or strongly agree that the issues reported by ASAT tools are relevant for improving the design and implementation
of software (Q1), as shown in Figure 2.1. Moreover, as Figure 2.2 shows, only 22.22% reject pull-requests based on the issues reported (Q5), and 50% never or rarely postpone a release based on the issues reported (Q6).
50% 50% 67% 22% 22% 22% 28% 28% 11%
Use transformation tools Reject pull−requests Postpone a release
100 50 0 50 100
Percentage
Response Never Rarely Sometimes Very Often Always
Figure 2.2: Survey responses on whether respondents postpone a release (Q6), reject pull-requests (Q5), or use transformation tools (Q3).
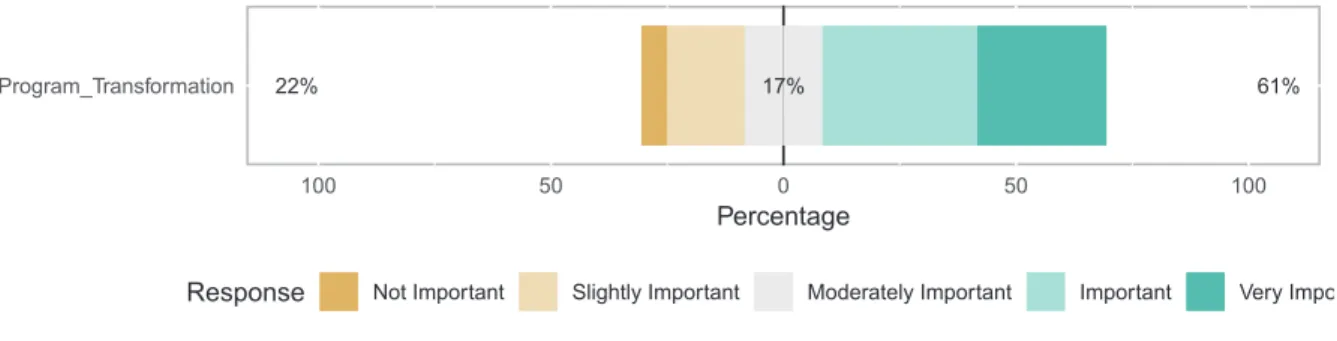
We find an apparent contradiction between the importance that developers claim ASATs and program transformation tools to automatically fix issues have (Q4), and how these tools are used by them during the software development process (Q3), we detail it in the next two paragraphs. Regarding the use of transformation tools to automatically fix issues reported by ASATs, more than 60% said that they consider them important or very important (see Figure 2.3). But, when asked about how often they actually use this type of tool for this purpose, only 22.22% answered very often, against 66.66% never or rarely, as shown in Figure 2.2. This might indicate that issues are not always solved in batch, which would benefit from the use of automatic program transformation tools. This also suggests that it would be worth to develop program transformation tools that address issues reported by static analysis tools and that could be integrated into continuous integration workflows.
22% 17% 61%
Program_Transformation
100 50 0 50 100
Percentage
Response Not Important Slightly Important Moderately Important Important Very Important
Figure 2.3: How important is the use of program transformation tools to fix issues reported by ASATs? (Q4)
ASF Eclipse PF TCU 0 5 0 0 1 0 0 0 1 5 0 0 2 0 0 0 2 5 0 0 in te rv a l in d a ys to f ix
Figure 2.4: Descriptive statistics with the interval in days to fix reported issues (grouped by organization)
2.2.2
How often developers fix issues found by SonarQube? (RQ2.2)
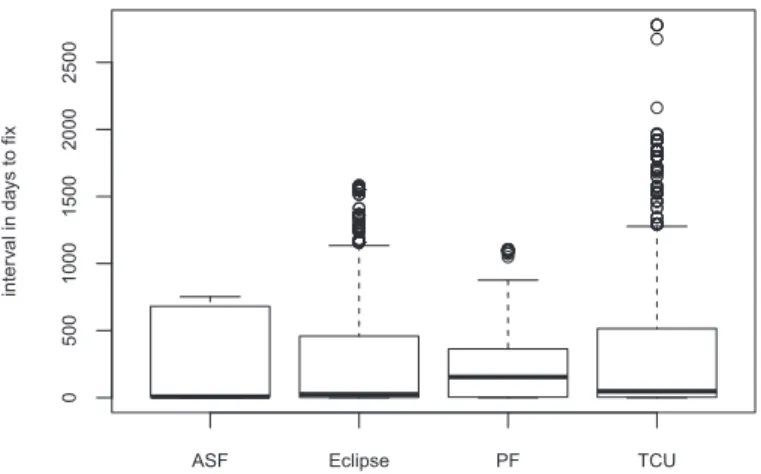
To answer this research question we first investigate the interval in days between the date a given issue was created and the date it was closed. Here we only consider the 36,974 fixed issues (8.76% of all issues). The issues that developers quickly fix might represent relevant problems that should be fixed in a short period of time or could be a potential target for automation.
Figure 2.4 presents some descriptive statistics, considering the four organizations. Considering all projects, the median interval in days for fixing an issue is 18.99 days. There is a (median) central tendency of ASF developers to fix issues in 6.67 days (more details in Table 2.3). Interestingly, the industrial projects studied take much longer to fix the SonarQube reported issues, when compared to the OSS studied projects. In a previous work, Panjer and colleagues reported that Eclipse bugs are fixed in 66.2 days
on average [41]. Here we found that developers spend on average more time to fix issues
reported by SonarQube (see Table 2.3). In addition, we found 10,749 issues (29% of them) that were fixed after one year of the report—many of them are considered major issues (see Figure 2.7). These “long to be fixed” issues were found across all four organizations (ASF: 4,760, EF: 2,310, TCU: 2,954, PF: 726). It is also important to note that almost 50% of the open issues have been reported more than one year ago.
Altogether, our first conclusion is that the number of fixes is relatively small (8.77% of the total of issues), a lower value than reported by previous research. Developers often fix the issues in a reasonable time frame (median is 18.99 days), also a shorter period than previously reported periods for both bugs and ASATs violations. In addition, we found that almost one-third of the fixes occurs after one year the issue had been reported.
Organization Median Mean Sd
EF 24.59 299.11 435.19
ASF 6.67 222.16 298.73
TCU 47.14 282.60 435.43
PF 153.81 216.60 241.31
Table 2.3: Descriptive statistics related to the number of days for fixing issues We used the approach proposed by Giger et al. [42] for classifying the resolutions time. It has only two status: Fast (fix interval ≤ median time to fix) and Slow (fix interval > median time to fix). Since the median interval for fixing an issue is 18.99 days, we used this information to characterize our dataset of fixed issues in the plot of Figure 2.5. As one could see, most fixes (55%) related to ASF projects present a Fast resolution while the PF organization presents the slowest scenario, with 66% of its resolutions being considered
Slow.
ASF Eclipse PF TCU
fast slow # issu e s 0 2 0 0 0 4 0 0 0 6 0 0 0 8 0 0 0
Figure 2.5: Speed resolutions of the organizations
To better understand why the reported issues are taking too long to be fixed at PF, we present a closer look at PF issues resolutions in Table 2.4.
Projects category Fix Class Total
Greenfielda Fast Resolutions 794 (24,6%)
Greenfield Slow Resolutions 1068 (33,1%)
Legacyb Fast Resolutions 305 (9,4%)
Legacy Slow Resolutions 1062 (32,9%)
a
26 projects
b
31 projects
In our collaboration with PF, we found out that they work on two lines of software projects: one that maintains and evolves legacy software systems (mainly developed in Java 6), and another one that develops greenfield software systems, working with newer technologies (e.g., Java 8). This particular greenfield line of work also follows agile prac-tices with monthly deliveries. Our analysis confirms the intuition that greenfield projects fix issues faster, and also have more issues fixed in total (1,862 for 26 greenfield projects
vs 1,367 for 31 legacy projects). Conversely, legacy projects have a significantly larger
number of open issues (27,599 vs 14,728 from greenfield projects).
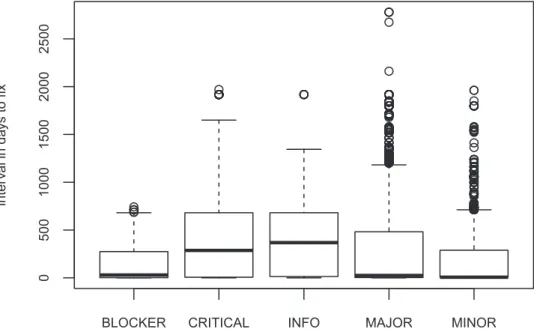
Moreover, we also investigate whether or not the “severity” of the issues influences the interval in days for fixing the reported problems (see the boxplots in Figure 2.8). To further investigate this aspect, we executed the non-parametric Kruskal-Wallis test and the Dunn test method for comparing mean differences, which (a) reveal that the severity factor influences the time for fixing issues (p–value < 2.2e−16), and (b) give
evidence that the Blocker and Minor severity categories are fixed in less time than the other categories. Figure 2.6 shows the outcomes of the Dunn test. We actually found surprising the observation that Minor issues have been fixed faster than Major and Critical issues. A possible reason might be that Minor issues are simpler to solve than the other issues.
Col Mean-|
Row Mean | BLOCKER CRITICAL INFO MAJOR
---+---CRITICAL | -10.48 | 0.0000* | INFO | -9.83 -0.32 | 0.0000* 0.3717 | MAJOR | -3.19 23.13 14.30 | 0.0007* 0.0000* 0.0000* | MINOR | -0.69 29.67 18.60 12.48 | 0.2445 0.0000* 0.0000* 0.0000* alpha = 0.05 Reject Ho if p <= alpha/2
Figure 2.6: Mean differences of the interval in days to fix issues, considering the severity of the issues
Blocker and Minor issues are solved faster than the other categories.
BLOCKER CRITICAL INFO MAJOR MINOR TCU PF Eclipse ASF # issu e s 0 1 0 0 0 2 0 0 0 3 0 0 0 4 0 0 0 5 0 0 0
Figure 2.7: Number of issues fixed after one year they had been reported
BLOCKER CRITICAL INFO MAJOR MINOR
0 5 0 0 1 0 0 0 1 5 0 0 2 0 0 0 2 5 0 0 in te rv a l in d a ys to f ix
Figure 2.8: Descriptive statistics with the interval in days to fix reported issues (grouped by severity)
In order to further investigate our first research question, we also considered the fre-quency in which developers fix the issues reported by SonarQube. To this end, we com-puted a number of metrics for each project P .
MinDate(P) The first date an issue have been reported for a project P . MaxDate(P) The last date an issue have been reported for a project P .
Interval(P) The difference between the max and min dates for a project P (computed
ODD(P) The number of distinct dates in which at least one issue has been opened in a
project P .
FDD(P) The number of distinct dates in which at least one issue has appeared as fixed
in a project P .
OpenFreq(P) The frequency in the interval where at least one issue have been opened
in a project P (computed as ODD(P ) ∗ 100/Interval(P )).
FixFreq(P) The frequency in the interval where at least one issue have been fixed in a
project P (computed as F DD(P ) ∗ 100/Interval(P )).
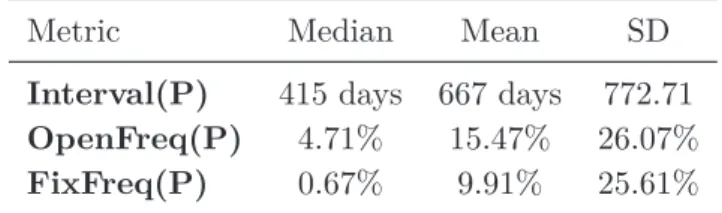
Table 2.5 summarizes some descriptive statistics related to these metrics. Based on
Interval(P), it is possible to realize that most projects in our dataset are using SonarQube
for at least one year (median of Interval(P) is 415 days). Considering the full interval in days where the projects were using SonarQube, on average, issues have been reported in 15.47% of the days. A possible explanation is that, when a project starts using a static analysis tool (like SonarQube), several issues are reported at once. After that, while the development of a system makes progress, the frequency in which new flaws are introduced and reported becomes sparse (with seasonal peaks where many flaws are reported). Surely, this might also indicates either that SonarQube is not integrated into the development processes or that there is a lack of activity.
More interesting is that issues are less frequently fixed than they are reported—that is, on average, we found fixes in 9.91% of the days between MinDate(P) and
Max-Date(P) for a given project P . We investigate the correlation (using the Spearman’s
method) between the total of distinct days the issues have been fixed (FDD(P)) and the total number of fixed issues of a project P . We find a moderate correlation within all organizations (EF with the least has 0.59, whereas ASF had the maximum of 0.69). This does not support the argument that issues are often fixed in “batch”. Batch examples in the ASF ecosystem are projects LDAP_API, with 15 distinct dates and 6,832 fixed issues, and Myfaces, with 7 distinct dates and 3,856 fixed issues.
Metric Median Mean SD
Interval(P) 415 days 667 days 772.71
OpenFreq(P) 4.71% 15.47% 26.07%
FixFreq(P) 0.67% 9.91% 25.61%
Therefore, the frequency in which new issues are either reported or fixed is relatively sparse, which might indicates that (1) SonarQube is not part of continuous integration workflows or that (2) developers do not act immediately when a new issue arises. Based on our findings, we can conclude that developers rarely fix issues reported by SonarQube.
Finally, we also investigate if there are specific days in which developers fix more issues. To this end, we collect the total number of issues fixed in each day of the week for each organization. Table 2.6 reports the results. We found many fixes of TCU appearing on Saturdays (22.5% of them) and many fixes of the Eclipse Foundation appearing on Sundays (22.8%). Overall, 12.4% of the fixes occurred during the weekends (EF: 40%, ASF: 3.3%, TCU: 25.9%, and PF: 0%). Contrasting to the other organizations whose fixes appear more frequently during the weekdays. Actually, PF does not have any issues fixed on the weekends.
Org. Sun Mon Tue Wed Thu Fri Sat
EF 1,294 1,284 605 1,132 923 1,031 699
ASF 383 724 7,470 1,520 5,515 961 158
TCU 218 1,015 1,390 1,874 2,253 1,428 1,843
PF 0 949 78 1,400 219 583 0
Total 1,895 3,972 9,543 5,926 8,910 4,003 2,700
Table 2.6: Issues fixed per day of the week
2.2.3
What are the SonarQube issues that developers fix more
frequently? (RQ2.3)
In our study we mined 36,974 fixed issues from all organizations. Even though the number of fixed violations is significantly low in comparison to the number of open violations, we still find some open issues that are worth fixing. To answer this research question, we
studied the rules associated to the reported issues. Eclipse employs a deprecated rule
by the SonarQube team which says that Cycles between packages should be removed. Since this rule is frequently fixed on EF’s dataset, we introduce the type Deprecated to classify it. We found that both EF and ASF modify configurations for rules, either activating/deactivating rules, or changing rules severities. For instance, EF deactivates the rule Useless imports shoud be removed, which is the 10th most fixed rule in our dataset. As a result, this rule is not related to any violations in EF.
Org. Code Smell Vulnerability Bug Deprecated EF 2,533 399 116 3,945 ASF 15,077 322 1,332 – TCU 8,837 677 507 – PF 2,968 60 201 – Total 29,415 (79.6%) 1,458 (3.9%) 2,156 (5.8%) 3,945 (10.7%) Table 2.7: Most frequently fixed issues by type in each organization
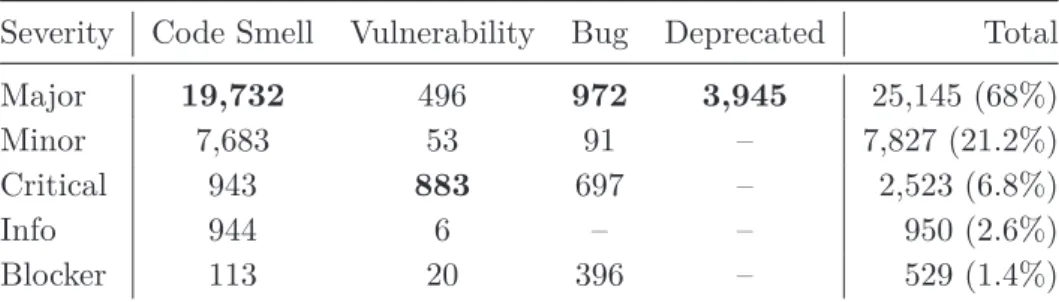
At first, we quantify all fixed issues from all organizations’ projects. We then classify them by their type, as shown in Table 2.7. It is possible to see that Code Smells are responsible for a high percentage (almost 80%) of all fixed issues. As we show in Table 2.8,
Minor issues are responsible for 21% of the fixed issues, and Info issues for 2.5%. We
also find contrasting results regarding vulnerabilities as in our study: they represent approximately 4% of the total number of fixes, when compared to 0.2% and 0.5% reported in [21] and [27], respectively.
Severity Code Smell Vulnerability Bug Deprecated Total
Major 19,732 496 972 3,945 25,145 (68%)
Minor 7,683 53 91 – 7,827 (21.2%)
Critical 943 883 697 – 2,523 (6.8%)
Info 944 6 – – 950 (2.6%)
Blocker 113 20 396 – 529 (1.4%)
Table 2.8: Most frequently fixed issues classifying severity to type
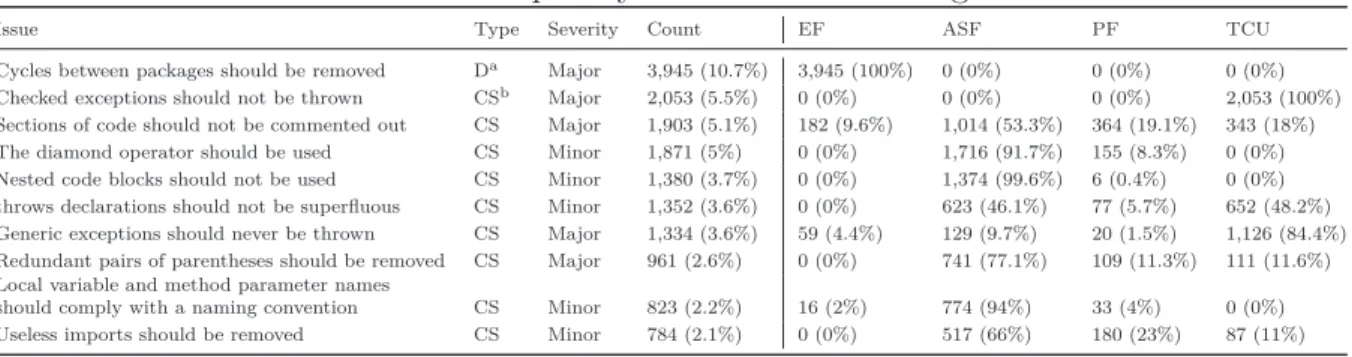
Table 2.9 presents the ten most frequently fixed issues. It is worthy noting that the five most fixed Minor issues correspond to almost 17% of the total fixed issues. Not surprisingly, Code Smells and Major issues are prevalent in the selection. Although code smells is the most fixed issues type, it is also responsible for the ten most frequent open issues, with six of them having a Major severity. Since Major issues can highly impact developers of a system (see ??) and also represent a predominantly large portion (68%) of the fixed issues, we question whether ASATs issue prioritization is as ineffective as reported in related works [27, 43].
We find that a frequently fixed issue does not incur in high fixing rate. We found that two issues, Sections of code should not be commented out and Generic exceptions should
never be thrown, are also present in the ten most common opened issues. If we consider
20 issues for both most fixed and most opened, there are 9 common issues between the two lists.
Finally, we investigate the occurrence of Won’t fix and False-positive issues. We argue that marking an issue as one of these resolutions is similar to the process of fixing a violation. The developer has to filter the specific issue among all others, assess if it truly represents a quality flaw worthy of fixing, and then she must take an action. With that in mind, developers do tend to flag issues as won’t fix and/or false-positive. Apache’s projects flagged a total of 10.168 issues with these resolutions. We encounter similar findings when comparing ASF’s ten most issues flagged as won’t fix/false-positive and the foundation’s ten most opened issues. There is a common subset of 5 issues among the two. These findings suggests that no rule is always fixed, regardless of context. Developers seem to consider other factors to decide whether to fix an issue or not.
Code smells and Major issues are highly prevalent among most of all issues’ types and severities. We found common issues among the top ten most fixed, wont’t fix / false-positive, and opened issues. This suggests that developers consider a variety of factors when deciding whether to fix an issue.
EF and TCU SonarQube instances have a large number of customized rules. When comparing those rules to rules that are available in a fresh SonarQube installation, EF has 1.163 additional rules, and TCU has 1.533. Nonetheless, we found that just a subset of these rules actually lead to issues’ reports. Overall, 122 unique rules are associated to fixed issues in EF, with 104 custom rules, which represents 7% of the total of custom rules. In TCU 250 unique rules are associated to fixed issues, with 141 custom rules, or 9% of TCU’s custom rules.
Table 2.9: Most frequently fixed issues in all organizations
Issue Type Severity Count EF ASF PF TCU
Cycles between packages should be removed Da
Major 3,945 (10.7%) 3,945 (100%) 0 (0%) 0 (0%) 0 (0%) Checked exceptions should not be thrown CSb
Major 2,053 (5.5%) 0 (0%) 0 (0%) 0 (0%) 2,053 (100%) Sections of code should not be commented out CS Major 1,903 (5.1%) 182 (9.6%) 1,014 (53.3%) 364 (19.1%) 343 (18%) The diamond operator should be used CS Minor 1,871 (5%) 0 (0%) 1,716 (91.7%) 155 (8.3%) 0 (0%) Nested code blocks should not be used CS Minor 1,380 (3.7%) 0 (0%) 1,374 (99.6%) 6 (0.4%) 0 (0%) throws declarations should not be superfluous CS Minor 1,352 (3.6%) 0 (0%) 623 (46.1%) 77 (5.7%) 652 (48.2%) Generic exceptions should never be thrown CS Major 1,334 (3.6%) 59 (4.4%) 129 (9.7%) 20 (1.5%) 1,126 (84.4%) Redundant pairs of parentheses should be removed CS Major 961 (2.6%) 0 (0%) 741 (77.1%) 109 (11.3%) 111 (11.6%) Local variable and method parameter names
should comply with a naming convention CS Minor 823 (2.2%) 16 (2%) 774 (94%) 33 (4%) 0 (0%) Useless imports should be removed CS Minor 784 (2.1%) 0 (0%) 517 (66%) 180 (23%) 87 (11%)
a
Deprecated
b
Code Smell
2.2.4
How is the distribution of the SonarQube issues? (RQ2.4)
Taking into account the results of the previous section, here we answer our fourth research question, which investigates the concentration of the rules (20% of the rules correspond
to 80% of the fixes) and the concentration of the files (20% of the files concentrate 80% of the issues). Answering to this question might help practitioners (a) to select a subset of rules that should be fixed (for instance, due to its relevance for source code improvement or easiness of fixing) or (b) to concentrate quality assurance activities in certain files of a project.
Considering all projects, we found a total of 412 rules having at least one fix. In this way, we consider the 82 most frequent fixed rules to answer RQ2.4—where 82 corresponds to 20% of the 412 rules. These 82 rules are related to 32,717 fixes. Since our dataset comprises 36,959, the 20% most frequent fixed rules correspond to 88.52% of all fixed issues. We publish this list of most frequent fixed rules in the paper’s website (omitted here due to the blind review process).
We further analyse our dataset to verify which projects follow the distribution 20% of
the rules correspond to 80% of the fixes). To avoid bias due to a small number of fixes, we
constrain our analysis to projects having at least 16 fixes and 190 files (the median number of fixes and files per project, respectively), leading to a total of 80 projects. We found 62 projects (77.5%) in the rule 20% of the rules correspond to 80% of the fixes, which suggests that it would be possible to reduce the number of reported issues (and avoid false-positives and issues that would not be fixed) by correctly configuring SonarQube to report a relatively small subset of all rules—those issues that are more likely to be fixed. Another recurrent question that arises in the literature [44, 45, 46] is whether or not 20% of the modules (files) are responsible for 80% of the issues (bugs in the existing literature). Investigating this issue might not only help managers to concentrate quality assurance activities on a subset of the modules of a project, but also might open new research directions to predict which files are more expected to present design flaws. More precisely, here we investigate if 20% of the files of each project (with at least 16 fixes and 190 files in our dataset) concentrate at least 80% of the issues. Interesting, we did not find any project satisfying this distribution. Considering the median statistic, the top 20% of files containing more issues represent 35.79% of all issues of a project (mean: 37.23 and max: 63.37). Comparing with the literature aforementioned, which suggests a higher concentration of bugs, we can conclude that static analysis issues are more widespread throughout the modules of a system than bugs.
We found that 20% of the rules correspond to 80% of the fixes, and that the issues reported by static analysis tools are not localized in a relatively small subset of the files of the projects.