Protein profile analysis of Malaysian snake venoms by two-dimensional
gel electrophoresis
Vejayan J (1), Shin Yee L (2), Ponnudurai G (2), Ambu S (2), Ibrahim I (3)
(1) Jeffrey Cheah School of Medicine and Health Sciences, Monash University, Bandar Sunway, Selangor Darul Ehsan, Malaysia; (2) International Medical University, Kuala Lumpur, Malaysia; (3) Institute of Biological Sciences, University of Malaya, Kuala Lumpur, Malaysia.
Abstract: Snake venoms comprise a highly complex mixture of proteins, which requires for their characterization the use of versatile two-dimensional electrophoresis techniques. In the present study, venoms obtained from eight snakes (Ophiophagus hannah, Naja kaouthia, Naja sumatrana, Bungarus fasciatus, Trimeresurus sumatranus, Tropidolaemus wagleri, Enhydrina schistosa and Calloselasma rhodostoma) commonly found in Malaysia were separated based on two independent properties, isoelectric point (pI) and molecular weight (MW). Many differences in snake venoms at the inter-family, inter-subfamily, inter-genus and inter-species levels were revealed. Notably, proteins from individuals of the Viperidae family – Trimeresurus sumatranus, Tropidolaemus wagleri and Calloselasma rhodostoma – were found to be numerous and scattered by the two-dimensional gel electrophoresis (2DE) specifically in regions between 37 and 100 kDa compared to the Elapidae venom proteins. The latter were clustered at the basic and lower molecular mass region (less than 20 kDa). Trains of spots were commonly observed, indicating that these proteins may be derived from post-translational modifications. Ophiophagus hannah (Elapidae) revealed a great amount of protein spots in the higher molecular mass range when compared to Enhydrina schistosa, Naja kaouthia, Naja sumatrana and Bungarus fasciatus. Overall 2DE showed large differences in the venom profile of each species, which might be employed as an ancillary tool to the identification of venomous snake species.
Key words: snake venom, protein profile analysis, two-dimensional gel electrophoresis, SDS-PAGE.
O
R
IG
IN
A
L
P
A
P
E
R
INTRODUCTION
Snake venoms comprise a source of millions of peptides and proteins that can act on a myriad of exogenous targets such as ion channels, receptors and enzymes within cells or on the cell membrane (1). Two-dimensional gel electrophoresis (2DE) is able of separating highly complex protein mixtures onto a single gel, enabling a more complete study of natural venoms. The versatility of this proteomics tool has been demonstrated in diverse applications ranging from uncovering information of novel proteins to identifying the minute differences of very closely related organisms. Recently, we have demonstrated its use in locating a-bungarotoxin in 2DE gel
of Bungarus multicinctus venom (2). We have also utilized 2DE in the study of a plant extract capable of showing in vitro neutralizing capacity by binding to the phospholipase A2 protein from Naja kaouthia venom (3).
DNA sequence analysis, amino acid sequence analysis, and toxin mass fingerprinting (4-10).
MATERIALS AND METHODS
Venoms
Venoms were extracted from eight species of Malaysian venomous snakes, namely:
Ophiophagus hannah, Naja kaouthia, Naja sumatrana, Bungarus fasciatus, Trimeresurus sumatranus, Tropidolaemus wagleri, Enhydrina schistosa and Calloselasma rhodostoma. The venoms were collected from a pool of 50 to 100 adult donor snakes in a universal sterile container, lyophilized and stored at –20°C.
SDS-PAGE
Freeze dried O. hannah venom (10 µL; 2.5 mg per milliliter of Tris-glycine buffer, pH 8.3, containing 0.01% SDS) and molecular weight markers (Precision Plus Protein® Standards, BioRad, USA) were subjected to 15% SDS-Tris-glycine electrophoresis according to a modified technique of Laemmli (11). Proteins were stained with PlusOne Coomassie Blue PhastGel R-350® (Bio-Sciences AB, Sweden).
Protein Assay
The amount of protein was estimated using the dye-binding technique of Bradford (12) with bovine serum albumin (BSA) at a concentration of 2.0 mg/mL as standard.
Two-Dimensional Gel Electrophoresis (2DE)
A 13-cm IPG strip with a linear range of pH from 3 to 10 was rehydrated overnight with 200 μL of rehydration solution. Separately, the venomous proteins were dissolved in 100 μL of rehydration solution containing 8 M urea, 2% CHAPS (w/v), 20 mM DTT (dithiothreitol), 0.5% IPG buffer (v/v), and 0.002% bromophenol blue (w/v). Then, the protein samples were applied to the IPG strip. Electrofocusing was carried out at 30 kVh using an IPGphor at 20°C according to the manufacturer’s instruction. Before the second dimension, the IPG strip was equilibrated by two steps: reduction buffer with 50 mM Tris/HCl, pH 8.8, 6 M urea, 30% glycerol (v/v), 2% SDS (w/v), bromophenol blue and 1% DTT(w/v) for ten minutes under agitation; alkylation buffer with 50 mM Tris/HCl, pH 8.8, 6 M urea, 30% glycerol (v/v), 2% SDS (w/v), bromophenol blue and 2.5%
iodoacetamide (w/v) for ten additional minutes. The equilibrated strip was loaded and run on 15% polyacrylamide Laemmli gels (m/v) (18 x 16 cm) using the SE 600 Ruby® system (Bio-Sciences AB, Sweden) with a programmable power control, initially 90 V for 40 minutes, followed by 250 V. The separated gel proteins were visualized throught Coomassie brilliant blue staining.
RESULTS
Comparison of Protein Content in Venoms of Eight Snakes
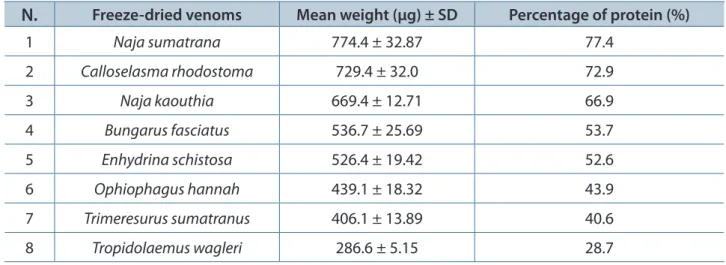
Table 1 displays the percentage of protein found in eight species of snakes. Data reveal that
Naja sumatrana and Calloselasma rhodostoma
present the highest percentage of proteins with, respectively, 77.4 and 72.9%; whereas
Tropidolaemus wagleri has the lowest percentage, 28.7%.
One-Dimensional Gel Electrophoresis
Sodium dodecyl sulfate polyacrylamide gel electrophoresis (SDS-PAGE) pattern of freeze dried O. hannah venom proteins is shown in Figure 1. Two particularly condensed bands can be observed in two sites, in the 100 kDa region and in between 15 kDa and 20 kDa.
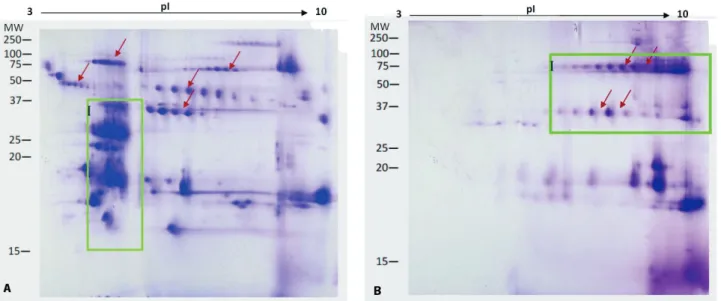
Two-Dimensional Gel Electrophoresis
Two-dimensional gel electrophoresis was performed on both fresh (Figure 2 – A) and freeze-dried venom (Figure 2 – B) of O. hannah. A comparison of the two gel images revealed that the fresh venom exhibited more spots than the freeze-dried one at similar protein load, though both were found to retain the same overall protein pattern as shown in regions between 50 and 250 kDa, as well as 15 and 20 kDa. Consequently, further 2DE on other venoms was performed on freeze-dried venoms as lyophilized conditions are found to be ideal for long-term storage of venom and maintenance of their activities.
Comparison of the 2DE images of the eight species of snakes revealed notable differences at the following levels: inter-family, inter-subfamily, inter-genus and inter-species.
Inter-family variation
Table 1. Protein content in venoms of eight species of snakes determined using Bradford assay (12) performed in triplicates in each test sample (n = 3)
N. Freeze-dried venoms Mean weight (µg) ± SD Percentage of protein (%)
1 Naja sumatrana 774.4 ± 32.87 77.4
2 Calloselasma rhodostoma 729.4 ± 32.0 72.9
3 Naja kaouthia 669.4 ± 12.71 66.9
4 Bungarus fasciatus 536.7 ± 25.69 53.7
5 Enhydrina schistosa 526.4 ± 19.42 52.6
6 Ophiophagus hannah 439.1 ± 18.32 43.9
7 Trimeresurus sumatranus 406.1 ± 13.89 40.6
8 Tropidolaemus wagleri 286.6 ± 5.15 28.7
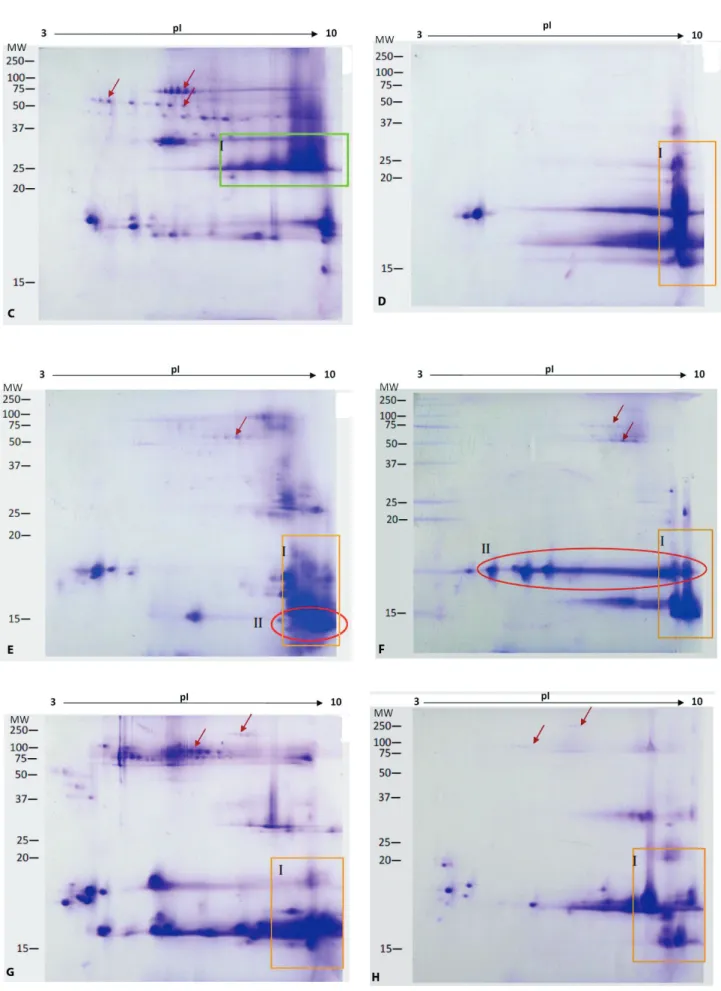
– D to H). Numerous trains of spots were present in molecular mass region of 37 to 100 kDa in the viperid venoms (arrows in Figure 3 – A to C). Such spots were absent or faintly visible in the elapid venoms (arrows in Figure 3 – D to H).
Conversely, the gel images of the Elapidae family venom revealed that most of the protein spots were clustered in the lower right region, that is, the basic and lower molecular mass proteins (< 20 kDa) (as shown in zone I, Figure 3 – D to H). Exceptions were seen with O. hannah of the Elapidae family. The trains of spots were distinct in the upper region of the gel and the cluster of spots was not merely confined to the lower right region.
Inter-subfamily and inter-genus variation
There is a marked distinction between the 2DE gel images of the sea snake, Enhydrina schistose, which represents the Hydrophiinae subfamily and the four other species that belong to the Elapinae subfamily, Naja kaouthia, Naja sumatrana, Ophiophagus hannah and Bungarus fasciatus (Figure 3 – D to H). Most protein spots of the sea snake venom are stacked together at the basic end, in pH 10 or more (Figure 3 – D). On the other hand, the 2DE images of the four other species showed complex distribution of proteins with a wide range of pI (Figure 3 – E to H).
To elucidate the venom variation at inter-genus level, comparisons were made among venoms of three genera representing the Crotalinae subfamily, namely Trimeresurus, Tropidolaemus
and Calloselasma. Despite having protein spots spreading across all parts of the gel, venoms are distinctly characteristic. The 2DE gel images of
Trimeresurus sumatranus (as displayed in zone I, Figure 3 – A) show heavy spotting of acidic proteins at molecular mass regions ranging between 15 and 37 kDa. In addition, the images of Tropidolaemus wagleri (as shown in zone I, Figure 3 – B) reveal
Figure 2. Two-dimensional gel electrophoresis images of the venom of O. hannah. (A) fresh and (B) freeze-dried venom. Two hundred micrograms of venom was subjected to isoelectric focusing (IEF) (pH 3-10) and 15% SDS-PAGE (m/v), followed by Coomassie blue staining.
Figure 3. (cont.) Two-dimensional gel electrophoresis images of 200 µg venoms subjected to IEF (pH 3-10)
greater number of spots at the basic pI range and in the molecular mass zone of approximately 70 to 80 kDa and 30 to 37 kDa; whereas the images of Calloselasma rhodostoma (zone I, Figure 3 – C) display abundant proteins crowded together at the basic pI range and in the molecular mass region of approximately 25 to 37 kDa.
Inter-species variation
The 2DE gel images of venoms from two species of the genus Naja namely, Naja kaouthia and Naja sumatrana were compared. Two differences were observed. Firstly, zone II in Figure 3 – F shows a horizontal streaking across pI 3-10 and between 15 to 20 kDa, which is not present in Figure 3 – E. In addition, Figure 3 – E displays abundant protein with basic pI and at approximately 15 kDa, as shown in zone II.
DISCUSSION
The protein content of the eight snake venoms in this study was between 30 and 80%. Generally, snake venoms are considered to contain mainly proteins, ranging from 70 to 90% (13). However, average protein estimation from 49.8 to 96.4% has been previously reported by Hill and Mackessy (14) in their study of ten colubrid venom preparations using the similar dye-binding microassay technique. In a recent work by Mackessy et al. (15) on the brown tree snake, Boiga irregularis, the protein content of four categories – neonates, juveniles, adults and large adults – showed increasing percent of protein content, respectively, 47.5, 74.9, 80.5 and 90.2%. So that the age of the snake may affect the percentage of protein content found in the venom. A fact that cannot be corroborated by the current study, since the venom collected for each species was from a pool of snakes with unknown age group consisting of both juveniles and adults. A comparison of the SDS-PAGE results with those from 2DE on O. hannah venom proved the superiority of the latter as bands at 100 kDa and between 15 and 20 kDa were clearly a combination of several proteins. Lately, 2DE has been the preferred technique used by several researchers to decipher the complexity of venoms due to its capability of separating a mixture of proteins based on two parameters, pI and MW (15-19). Owing to the close proximity of molecular weights among toxins bearing different net charges, SDS-PAGE
was not able to provide efficient differentiation (6). Other than working directly on venom, the use of 2DE has also been relevant on serum of a person bitten by rattlesnake, revealing qualitative and quantitative changes in plasma proteins which are obscure in 1D (20).
The use of freeze-dried versus fresh venom for 2DE profiling, as employed for O. hannah venom, revealed more spots in the first option, which indicates a possible denaturation upon lyophilization. This is not surprising, given that previous studies have demonstrated that freeze-drying and/or improper storage, such as exposure to light or autoproteolysis may cause protein degradation (21, 22). A study utilizing polyacrylamide gel electrophoresis on viper and cobra venoms suggested that electrophorectic differences between fresh and newly freeze-dried venoms were insignificant (23). Freeze-drying of venoms has been the choice for numerous snake venom traders and researchers as it has been proven that the overall lethality remained intact and it is possible to store the venom for many years. It is evident in this study that 2DE displayed differences that are not noticeable in SDS-PAGE electrophoresis, again expected of this technique; however, for the purpose of profiling the eight samples, freeze-dried venoms have been chosen since they permit storage for a longer period of time.
basic polypeptides, mainly neurotoxins and cardiotoxins (cytotoxin) that correspond to the lower range of molecular mass (13, 25, 26).
The aforementioned findings apply for all studied snake species, except for O. hannah that belongs to the Elapidae family. Its 2DE profile reveals a larger amount of protein spots in the higher molecular mass range compared to four other elapid snakes. This suggests that O. hannah
venom presents higher enzymatic activity. This is confirmed by reports from Ohsaka (27), who described that none of the Elapidae venoms (B. fasciatus and Naja spp.) exhibit hemorrhagic activity, apart from O. hannah venom that displays an hemorrhagic activity similar to that of Viperidae venoms.
Another obvious observation found in the 2DE profile for all eight species of snake venoms was the presence of trains of spots. This phenomenon can be due to proteins undergoing post-translational modifications, such as glycosylation and phosphorylation in order to perform their molecular function (28). These protein forms are present as trains of spots in 2DE profile as they vary slightly in their pI and molecular masses (24).
Upon comparison of the profiles of five elapid snakes, an unusual pattern was observed in the profile of E. schistosa (true sea snake) compared to the other members of the Elapidae family. The E. schistosa 2DE profile indicates that most protein spots appear to “stack up” at the basic end of pI 10. This situation suggests that its venom is composed of highly basic protein with pI of at least 10. This unexpected observation may be justified by Toom et al. (29) using isoelectric focusing where it was found that E. schistosa
venom was mostly composed of basic proteins with some amount of acidic proteins, but lacking neutral proteins. Therefore, 2DE profiles show a clear difference between the true sea snake and the terrestrial elapids. Morphologically the true sea snake displays some distinct characteristics in comparison to its terrestrial counterpart, as observed in its flattened paddle-like tail and absence of choanal process in the latter. However, it is reasonable to suggest that they belong to the same family as they share more common features both biochemically and morphologically.
In conclusion, 2DE evidently acts as the better tool in profiling proteins found in a complex mixture such as those of snake venoms in comparison to SDS-PAGE, though the
latter remains vital as a rapid and inexpensive investigating technique (30). Two-dimensional gel electrophoresis, due to its additional parameter of separation is more suitable for detecting minute differences between closely related samples. Moreover, the use of this technique on various freeze-dried snake venoms demonstrated to be an additional taxonomic tool, especially during moments when the conventional morphological keys are found to be insufficient for the task.
COPYRIGHT
© CEVAP 2010
SUBMISSION STATUS
Received: June 14, 2010.
Accepted: July 27, 2010.
Abstract published online: August 13, 2010.
Full paper published online: November 30, 2010.
CONFLICTS OF INTEREST
There is no conflict.
FINANCIAL SOURCE
The International Medical University and the Malaysian Ministry of Science and Technology (project number 02-02-10-SF0033) provided the financial grants.
CORRESPONDENCE TO
JAYA VEJAYAN, Jeffrey Cheah School of Medicine and Health Sciences, Monash University, Sunway Campus, Jalan Lagoon Selatan, 46150 Bandar Sunway, Selangor Darul Ehsan, Malaysia. Phone: +603 55145829. Fax: +603 55146323. Email: jaya. vejayan@med.monash.edu.my.
REFERENCES
1. Casarett LJ, Klaassen CD, Doull J. Casarett and Doull’s Toxicology: the basic science of poisons. 6th ed. Chicago: McGraw-Hill Professional; 2001. 2. Vejayan J, Ibrahim H, Othman I. Locating alpha-bungarotoxin in 2-DE gel of Bungarus multicinctus (many banded krait) venom. Malays J Sci. 2008;27(1):27-34.
3. Vejayan J, Ibrahim H, Othman I. The potential of Mimosa pudica (Mimosaceae) against snake envenomation. J Trop Forest Sci. 2007;19(4):189-97. 4. Mendoza CE, Bhatti, T, Bhatti, AR. Electrophorectic analysis of snake venoms. J Chromatogr. 1992;580(1-2):355-63.
1984;22(1):53-61.
6. Soares AM, Anzaloni-Pedrosa LH, Fontes MRM, Silva RJ, Giglio JR. Polyacrylamide gel electrophoresis as a tool for the taxonomic identification of snakes from the Elapidae and Viperidae families. J Venom Anim Toxins. 1998;4(2):137-41.
7. Malhotra A, Thorpe RS. A phylogeny of four mitochondrial gene regions suggests a revised taxonomy for Asian pit vipers (Trimeresurus and
Ovophis). Mol Phylogenet Evol. 2004;32(1):83-100.
8. Lawson R, Slowinski JB, Crother BI, Burbrink FT. Phylogeny of the Colubroidea (Serpentes): new evidences from mitochondrial and nuclear genes. Mol Phylogenet Evol. 2005;37(2):581-601. 9. Slowinski JB, Knight A, Rooney AR. Inferring
species trees from gene trees: a phylogenetic analysis of the Elapidae (Serpentes) based on the amino acid sequences of venom proteins. Mol Phylogenet Evol. 1997;8(3):349-62.
10. Souza GH, Catharino RR, Ifa DR, Eberlin MN, Hyslop S. Peptide fingerprinting of snake venoms by direct infusion nano-electrospray ionization mass spectrometry: potential use in venom identification and taxonomy. J Mass Spectrom. 2008;43(5):594-9.
11. Laemmli UK. Cleavage of structural proteins during the assembly of the head of bacteriophage T4. Nature. 1970;227(5259):680-5.
12. Bradford MM. A rapid and sensitive method for the quantitation of microgram quantities of protein utilizing the principle of protein-dye binding. Anal Biochem. 1976;72(1):248-54. 13. Tu AT. Venoms: chemistry and molecular biology.
New York: John Wiley & Sons; 1977. 560 p. 14. Hill RE, Mackessy SP. Venom yields from several
species of colubrid snakes and differential effects of ketamine. Toxicon. 1997;35(5):671-8.
15. Mackessy SP, Sixberry NM, Heyborne WH, Fritts T. Venom of the brown tree snake, Boiga irregularis: ontogenetic shifts and taxa-specific toxicity. Toxicon. 2006;47(5):537-48.
16. Birrell GW, Earl S, Masci PP, de Jersey J, Wallis TP, Gorman JJ, et al. Molecular diversity in venom from the Australian brown snake, Pseudonaja textilis. Mol Cell Proteomics. 2006;5(2):379 -89. 17. Liang S, Li X, Cao M, Xie J, Chen P, Huang R.
Identification of venom proteins of spider S. huwena on two-dimensional electrophoresis gel by N-terminal microsequencing and mass spectrometric peptide mapping. J Protein Chem. 2000;19(3):225-9.
18. Menezes MC, Furtado MF, Travaglia-Cardoso SR, Camargo AC, Serrano SM. Sex-based individual variation of snake venom proteome among
eighteen Bothrops jararaca siblings. Toxicon. 2006;47(3):304-12.
19. Bagley EA, Lonberg-Holm K, Pandya BV, Budzynski AZ. Two-dimensional gel electrophoretic analysis of plasma proteins from a patient bitten by a rattlesnake. Electrophoresis. 1983;4(3):238-41.
20. Pornmanee P, Perez JC, Sanchez EE, Khow O, Pakmanee N, Chulasugandha P, et al. pH gradient electrophoresis and biological activity analysis of proteins from Malayan pit viper (Calloselasma rhodostoma) venom. ScienceAsia. 2008;34(3):273-7.
21. Marsh N. Gaboon viper venom – a comparative study of the coagulant, proteolytic and toxic properties of four commercial dried preparations and freshly collected venom. Toxicon. 1975;13(3):171-5.
22. Villegas L, Aquirre E, Zavaleta A. Effects of lyophilisation on four biological activities of
Bothrops atrox (Serpentes: Viperidae). Rev Biol Trop. 1993;41(3B):851-3.
23. Willemse GT, Hattingh J. Effect of drying and storage on electrophorectic properties of venom from puff adders (Bitis arietans) and cape cobras (Naja nivea). Herpetologica. 1980;36(2):170-4 24. Li S, Wang J, Zhang X, Ren Y, Wang N, Zhao K,
et al. Proteomic characterization of two snake venoms: Naja naja atra and Agristrodon halys. Biochem J.2004;15(1):119-27.
25. Birrell GW, Earl ST, Wallis TP, Masci PP, de Jersey J, Gorman JJ, et al. The diversity of bioactive proteins in Australia snake venoms. Mol Cell Proteomics.2007;6(6):973-86.
26. Kulkeaw K, Chaicumpa W, Sakolvaree Y, Tongtawe P, Tapchaisri P. Proteome and immunome of the venom of Thai cobra, Naja kaouthia. Toxicon. 2007;49(7):1026-41.
27. Ohsaka A. Hemorrhagic, necrotizing and edema-forming effects of snake venoms. In: Lee CY, editor. Handbook of experimental pharmacology. Berlin: Springer-Verlag; 1979. p. 481-546. vol. 52. 28. Blom N, Sicheritz-Ponten T, Gupta R, Gammeltoft S, Brunak S. Prediction of post-translational glycosylation and phosphorylation of proteins from the amino acid sequence. Proteomics. 2004;4(6):1633-49.
29. Toom PM, Squire PG, Tu AT. Characterization of the enzymatic and biological activities of snake venoms by isoelectric focusing. Biochim Biophys Acta. 1969;181(1):339-41.