ABSTRACT
RESUMO
Submitted on June 18th, 2015and accepted on August 03rd, 2017.
1Part of the PhD thesis in Genetics and Improvement by the first author. Research developed with financial support of CAPES, CNPq e FAPEMIG.
2Universidade Federal de Viçosa, Departamento de Fitotecnia, Viçosa, Minas Gerais, Brasil. [email protected]; [email protected]; [email protected]; [email protected]; [email protected]
3Universidade Federal de Goiás, Unidade Acadêmica Especial de Ciências Agrárias, Goiás, Brasil. [email protected] * Corresponding author: [email protected]
Adaptability and stability of peach and nectarine cultivars
in subtropical climate
1Information on adaptability and stability of fruit production in different environments or years is crucial to increasing agricultural production potential. Therefore, the objective of this study was to evaluate whether there is interaction between cultivars and years, as well as to assess the stability of peach and nectarine cultivars regarding fruit fresh mass, SS/TA ratio, and cycle length in Viçosa –MG, Brazil. The characteristics fruit fresh mass (FM), soluble solids/titratable acidity ratio (SS/TA), and cycle length (CL) were evaluated in 28 cultivars of peach and two cultivars of nectarine from the orchard of the Universidade Federal de Viçosa, in 2011, 2012, and 2013. The methods used to determine the phenotypic stability across time were Eberhart & Russell (1966) and the Traditional. The interaction cultivars x years was significant for all traits. Cultivar ‘Josefina’ showed broad adaptability for SS/TA ratio, and cultivars ‘Flordaprince’ and ‘Tropical’ for cycle length. For favorable environments, the cultivars ‘Capdebosq’ and ‘Maciel’ are indicated regarding the characteristic fruit mass, and ‘Coral’ and ‘Talismã’ for SS/TA ratio. ‘Rubimel’ was adaptable to unfavorable environments regarding fruit mass.
Key words: Prunus persica; genotype x environment interaction; performance.
Rosana Gonçalves Pires Matias2, Claudio Horst Bruckner2, Danielle Fabíola Pereira da Silva3,
Pedro Crescêncio Souza Carneiro2, João Alison Alves de Oliveira2
10.1590/0034-737X201764050009
Adaptabilidade e estabilidade de cultivares de pessegueiro e nectarineira
sob condições de clima subtropical
O conhecimento da adaptabilidade e estabilidade da produção de frutos em diferentes locais ou anos é crucial para aumentar o potencial de produção agrícola. Por isso, o objetivo deste trabalho foi avaliar a existência de interação entre cultivares e anos, bem como avaliar a estabilidade de cultivares de pessegueiro e nectarineira quanto à massa de matéria fresca de fruto, relação SS/AT e duração de ciclo nas condições de Viçosa-MG. Para isto foram avaliadas 28 cultivares de pessegueiro e duas cultivares de nectarineira pertencentes ao pomar da Universidade Federal de Viçosa nos anos de 2011, 2012 e 2013. Foram avaliados os caracteres massa de matéria fresca de fruto, relação SS/AT e duração de ciclo e utilizados os métodos Tradicional e de Eberhart & Russell (1966) para estudo da estabilidade fenotípica no tempo. A interação cultivares x anos é significativa para todas as características. ‘Josefina’ apresenta adaptabilidade geral para relação SS/AT, e ‘Flordaprince’ e ‘Tropical’ para duração de ciclo. Para ambientes favoráveis são indicadas as cultivares ‘Capdebosq’ e ‘Maciel’ quanto à característica massa de fruto, e ‘Coral’ e ‘Talismã’ quanto à relação SS/AT. ‘Rubimel’ é indicada para ambiente desfavorável com relação à massa de fruto.
INTRODUCTION
The southern states of Brazil comprise the region with the greatest tradition of peach growing in the country. However, new cultivars, less cold demanding, and new technologies in crop management have allowed the cultivation of the crop in regions of subtropical climate and mild winters, as it occurs in the State of Minas Gerais (Leonel & Tecchio, 2011). Nevertheless, the development of cultivars with better fruit quality is still necessary. In Brazil, the characteristics associated with peach fruit quality, including fruit fresh mass, ratio of soluble solids content to titratable acidity (SS/TA), and cycle length are among the main objectives of the breeding programs.
In peach, and other species, the interaction between genotypes and environments has a fundamental role in phenotypic expression. Differential performance of genotypes in different environments, i.e., the interaction genotypes x environments, results in changes in the values of differences between genotypes from one year to another (Silva, 2008). This inconsistency of cultivar performance in response to environmental stimuli makes it difficult to identify adapted and stable cultivars (Storck et al., 2014). When significant interaction between genotypes and environments exists, we use techniques to identify genotypes adapted and stable to specific environments. Analysis of adaptability and stability are statistical procedures that allow, in some way, to identify cultivars of more stable performance and that respond predictably to environmental variations (Silva & Duarte, 2006). There are methods that allow the evaluation of the response pattern of each cultivar, considering the environmental variations. In this case, for each genotype, a simple linear regression of the dependent variable is performed in relation to the environmental index, which is defined as the average of all genotypes in the environment and whose estimates indicate the quality of the environments studied (Cruz et al., 2012).
The choice of the method of analysis depends on the experimental data, especially those related to the number of environments available, the required precision, and the kind of information desired. However, researchers often prefer those methodologies that allow easy interpretation of the results and, at the same time, allow the identification of the superior genotypes with the respective degrees of adaptability and phenotypic stability (Nascimento Filho et al., 2009).
Little is known about the performance of fruit traits and production of peach over the years, since studies on this crop have had other approaches (Matias et al., 2011; Matias et al., 2015, Matias et al., 2016). The adaptability and stability of peach genotypes were evaluated for bud sprouting (Scariotto et al., 2013), fruiting and yield (Citadin
et al., 2014) in subtropical Brazilian sites, and yield and quality stability in agroecological conditions in Belgrade, Serbia (Rakonjac & •ivanoviæ, 2008).
Information about adaptability and stability of fruit production in different locations or years is crucial to increasing agricultural production potential. The objective of this study was to evaluate whether there is interaction between cultivars and years, as well as to evaluate the stability of peach and nectarine cultivars for fresh fruit mass, ratio of soluble solids content to titratable acidity, and cycle length, in Viçosa-MG, Brazil.
MATERIAL AND METHODS
Twenty-eight cultivars of peach and two cultivars of nectarine (Josefina and Rubrosol) grown in the orchard of the Departamento de Fitotecnia (Plant Science Department) at Universidade Federal de Viçosa, Viçosa-MG (20°45’S and 42°51’W; 649 m altitude) were evaluated in this study. One year after emergence, between 25 and 30 cm in height, the seedling were grafted on ‘Okinawa’ rootstock, and planted at the spacing 5.0 m between rows and 3.5 m within rows, with three plants of each cultivar arranged side by side in an experimental area of 0.2 ha, in October 2008. The trees were pruned to the bowl shape. Cultural management practices of fertilization, pruning, dormancy breaking, fruit thinning, and irrigation were according to recommendations of Raseira et al., (2014). The average annual rainfall ranged from 1,322 to 1,400 mm, with December and January being the wettest months and July the driest month. The mean maximum temperature in the hottest month was 30.9 °C and the average minimum temperature was 9.9 °C in the coldest month (Source: Weather Station of Universidade Federal de Viçosa, Viço-sa-MG).
The fruit fresh mass and the ratio soluble solids content (SS)/titratable acidity (TA) were determined on samples of 30 fruits collected from three plants of each cultivar. The mass, in grams (g), was weighed to the nearest 0.1 kg with a digital scale. Soluble solids (SS) was analyzed in the juice hand squeezed from one equatorial face of each fruit using a digital refractometer and expressed as ºBrix. Titratable acidity (TA) was obtained by titrating 5 g of ground pulp plus 95 mL distilled water with 0.1N NaOH solution and expressed as percentage of malic acid. The soluble solids and titratable acidity (SS/TA) ratio was calculated. Cycle length was defined as the number of days between the date of the application of the chemical to break dormancy and the date of harvest.
with SS/AT ratio between 15.00 and 25.00 are classified as more acidic (Trevisan, 2003). For cycle length, early cycle cultivars (90 to 120 days) were considered as adapted, since their fruits had a more regular development cycle (Barbosa et al., 1990).
Data were examined by combined analysis of variance in simple factorial design, considering the effects of cultivars (G) as fixed and effects of years (E) as random, to test the interaction effect of cultivars x years (G x E). The presence of these interactions justifies the application of stability methods, using the methods of Eberhart & Russell (1966) and the Traditional (Yates & Cochran, 1938).
The Traditional method is a combined analysis of the experiments, considering all the years and the subsequent unfolding of the sum of squares of the effects of years and the interaction cultivars x years into effect of years within each cultivar (Cruz et al., 2012).
The method proposed by Eberhart & Russell (1966) is based on linear regression analysis in the following model: Yij = β0i + β1iIj + βij + εij
Yij: mean of ith cultivar in the jth year;
β0i: overall mean of cultivar i;
β1i: linear regression coefficient, which measures the
response of the ith cultivar to the variation in the year;
Ij: coded environmental index;
δij: regression deviation; and
εij: mean experimental error.
The analyses were performed using the GENES program (Cruz, 2016).
RESULTS AND DISCUSSION
The variance analysis showed significant effects (P < 0.01) of the factors years, cultivars, and cultivar x year interaction (G x E) on fruit fresh mass, SS/TA, and cycle length. The presence of significant GxE interaction justifies the study of adaptability and phenotypic stability. The significance of the factors cultivars and years suggests that genotypes and years had variability, and the significance of the interaction G x E indicates that the cultivars performed differently in the years evaluated (Lima et al., 2017).
We found that the environmental indices varied in the different years of peach and nectarine cultivation (Table 1). The relationship between these indices and the characteristics evaluated allowed the classification of the environments as favorable (positive indices) and unfavorable (negative indices), with means above the overall mean in the favorable environments, for fruit fresh mass and SS/TA. There was also classification of environments as favorable and unfavorable for cycle
length. However, environments classified as favorable had negative indices, since cultivars with shorter cycle length are preferable (Table 1), and those considered as unfavorable environments, with positive indices, had means higher than the overall mean.
According to Santos et al. (2015), fruit mass is an important characteristic, and in general, fruits with greater mass have larger sizes, making them more attractive to industry.
The Traditional stability analysis considers the culti-var that provides the smallest mean square (MS/Gi), in the several years, as the most stable one. Thus, we found that the cultivars ‘Argel’, ‘Biuti’ and ‘Campimas-1’ were the most stable. However, they had fruit fresh mass below the overall mean of 75.91 g (Table 2).
During fruit ripening, the SS/TA ratio tends to increase because of the decrease in acids and increase in sugars, and the absolute value depends on the cultivar (Oliveira et al., 2014). The cultivars ‘Argel’, ‘Biuti’, ‘Campinas-1’, ‘Cerrito’, ‘Elberta’, ‘Flordaprince’, ‘Maciel’, ‘Real’, ‘Rubrosol’ and ‘Tropic Beauty’ had the most stable SS/ TA, but with values below 25.00 (Table 3). This shows that the cultivars with minimum variance between the years had high stability, but, in general, they had the lowest means and, therefore, without interest for breeding aiming to increment these characteristics. Matias et al. (2014) related high values of SS/TA ratio mainly to low fruit acidity, which corroborates the findings of this study.
Cultivars with lower means for cycle length are of interest for improvement. The use of less cold demanding cultivars and, consequently, shorter cycle, in regions with mild winters allows the harvesting when fruit are scarce during the off-season (Barbosa et al., 2010) and an earlier entry to the market provides better income for farmers. In this sense, the cultivars ‘Rubrosol’ and ‘Tropical’ stand out because of their lower means, i.e., more precocious, and the relatively lower mean square MS/Gi (Table 4).
When using the Eberhart & Russell’s criteria (1966), one should consider the average performance, the linear component (β1i) and the nonlinear component (ó2di) to
evaluate the stability of a cultivar across years. A cultivar with broad adaptability was defined as having â1i = 1.0 and high stability with σ2
di = 0. Cultivars with â1i > 1.0 were
defined as adapted to favorable environments for fruit mass and SS/AT, and unfavorable environments for cycle length. Cultivars with β1i < 1.0 were defined as adapted to
unfavorable environments for fruit mass and SS/AT ratio, and to favorable environments for cycle length.
stability in guava, obtained regression coefficients varying from -0.51 to 2.64 for fruit fresh mass, from -0.81 to 2.39 for harvest length, and -0.16 to 2.20 for cycle length. Large variations in the regression coefficient reveal that the genotypes responded differently to the years (Silva, 2008).
We found that, for fresh fruit mass (Table 2), the cultivars ‘Argel’, ‘Biuti’, ‘Campinas 1’, ‘Josefina’, ‘Péro-la de Itaquera’, and ‘Rubrosol’ had broad adaptability (â1i = 1.0) and good predictability (ó2
di = 0). However,
none of them had fruit fresh mass above than the overall
Table 1: Means of 28 peach and two nectarine cultivars evaluated in three years and their respective environmental indices (Env. I.)
for the classification of environments as favorable and unfavorable for the cultivation of peach and nectarine
FFM (g) SS/TA Cycle (days) Years Mean Env. I. Mean Env. I. Mean Env. I.
2011 74.53 -1.37 19.38 -3.76 151.29 3.57
2012 74.19 -1.72 26.82 3.68 144.76 -2.97
2013 79.01 3.09 23.22 0.08 147.13 -0.60
Overall mean 75.91 0.00 23.14 0.00 147.73 0.00
FFM: fruit fresh weight; SS/TA: soluble solids/titratable acidity ratio
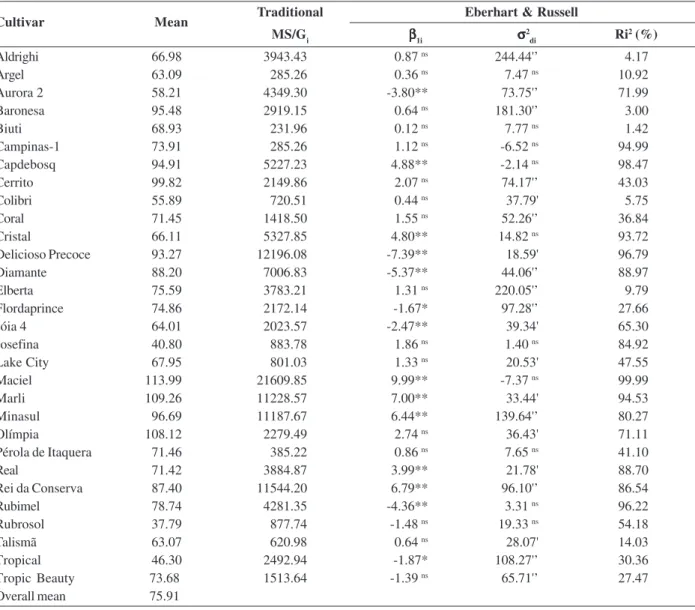
Table 2: Estimates of parameters of adaptability and phenotypic stability obtained by the methods of Eberhart & Russell (1966) and
Traditional (Yates & Cochran, 1938) for 28 peach and two nectarine cultivars evaluated in three years for fruit mass (g)
Traditional Eberhart & Russell MS/Gi βββββ1i σσσσσ2
di Ri
2 (%)
Aldrighi 66.98 3943.43 0.87 ns 244.44'’ 4.17
Argel 63.09 285.26 0.36 ns 7.47 ns 10.92
Aurora 2 58.21 4349.30 -3.80** 73.75'’ 71.99
Baronesa 95.48 2919.15 0.64 ns 181.30'’ 3.00
Biuti 68.93 231.96 0.12 ns 7.77 ns 1.42
Campinas-1 73.91 285.26 1.12 ns -6.52 ns 94.99
Capdebosq 94.91 5227.23 4.88** -2.14 ns 98.47
Cerrito 99.82 2149.86 2.07 ns 74.17'’ 43.03
Colibri 55.89 720.51 0.44 ns 37.79' 5.75
Coral 71.45 1418.50 1.55 ns 52.26'’ 36.84
Cristal 66.11 5327.85 4.80** 14.82 ns 93.72
Delicioso Precoce 93.27 12196.08 -7.39** 18.59' 96.79
Diamante 88.20 7006.83 -5.37** 44.06'’ 88.97
Elberta 75.59 3783.21 1.31 ns 220.05'’ 9.79
Flordaprince 74.86 2172.14 -1.67* 97.28'’ 27.66
Jóia 4 64.01 2023.57 -2.47** 39.34' 65.30
Josefina 40.80 883.78 1.86 ns 1.40 ns 84.92
Lake City 67.95 801.03 1.33 ns 20.53' 47.55
Maciel 113.99 21609.85 9.99** -7.37 ns 99.99
Marli 109.26 11228.57 7.00** 33.44' 94.53
Minasul 96.69 11187.67 6.44** 139.64'’ 80.27
Olímpia 108.12 2279.49 2.74 ns 36.43' 71.11
Pérola de Itaquera 71.46 385.22 0.86 ns 7.65 ns 41.10
Real 71.42 3884.87 3.99** 21.78' 88.70
Rei da Conserva 87.40 11544.20 6.79** 96.10'’ 86.54
Rubimel 78.74 4281.35 -4.36** 3.31 ns 96.22
Rubrosol 37.79 877.74 -1.48 ns 19.33 ns 54.18
Talismã 63.07 620.98 0.64 ns 28.07' 14.03
Tropical 46.30 2492.94 -1.87* 108.27'’ 30.36
Tropic Beauty 73.68 1513.64 -1.39 ns 65.71'’ 27.47
Overall mean 75.91
ns: non-significant
*,**: significantly different from 1 by the t test, at 5 and 1% probability, respectively. ‘,”: significantly different from 0 by the F test, at 5 and 1% probability, respectively.
mean (75.91 g). The cultivars ‘Capdebosq’ and ‘Maciel’ were indicated for favorable environments (rigorous winter conditions), since they presented â1i > 1.0, ó2
di = 0,
and means higher than the overall mean (94.91 and 113.99g, respectively ). Toralles et al. (2008) evaluated peach cultivars in the region of Pelotas-RS in two harvests and found mean fresh mass for ‘Maciel’ of 140.4g, whereas ‘Rubimel’ can be recommended for unfavorable environments (mild winter) for having â1i < 1.0, ó2
di = 0,
and mean fruit mass of 78.74g.
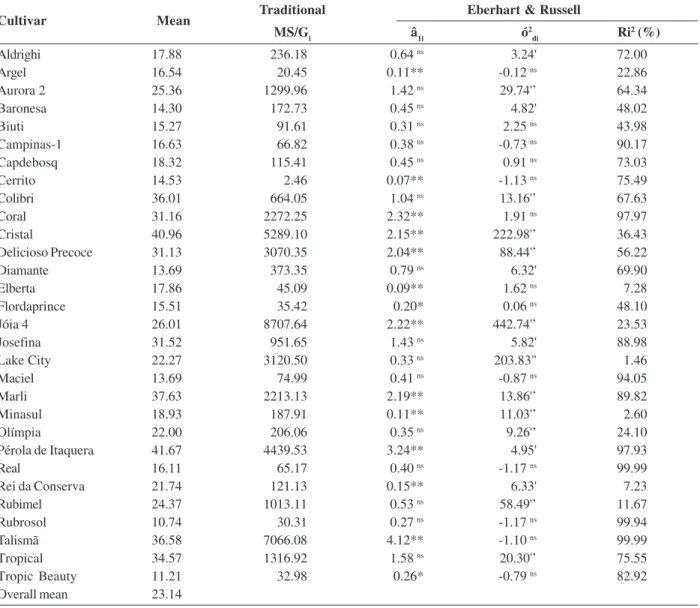
For the SS/AT ratio (Table 3), cultivars ‘Biuti’, ‘Campi-nas-1’, ‘Capdebosq’, ‘Real’, and ‘Rubrosol’ had broad adaptability (â1i = 1.0) and good predictability (ó2
di = 0),
but none of them presented SS/AT ratio above 25.00. However, in cases where ó2
di is statistically different from
zero, Pinthus (1973) recommended to use the coefficient R2 to replace ó2
di because of the high positive correlation
between these two parameters. A genotype should not be evaluated as totally undesirable if it presents a high R2,
and that a value equal to 80% should be used as a reference for the regression to satisfactorily explain the performance of the genotype as a function of the environment (Cruz et al., 2012).
Analyzing the coefficients of determination, we found that cultivar ‘Josefina’ had mean above 25.00 (31.52), broad adaptability, and R2 above 80% (88.98%), and should not
be considered as totally undesirable. We also found that cultivars ‘Coral’ and ‘Talismã’ can be indicated for favorable environments (â1i > 1.0), with SS/TA means of 31.16 and 36.58, respectively.
Table 3: Estimates of parameters of adaptability and phenotypic stability obtained by the methods of Eberhart & Russell (1966) and
Traditional (Yates & Cochran, 1938) for 28 peach and two nectarine cultivars evaluated in three years for SS/TA (soluble solids/ titratable acidity ratio) ratio
Traditional Eberhart & Russell MS/Gi â1i ó2
di Ri
2 (%)
Aldrighi 17.88 236.18 0.64 ns 3.24' 72.00
Argel 16.54 20.45 0.11** -0.12 ns 22.86
Aurora 2 25.36 1299.96 1.42 ns 29.74'’ 64.34
Baronesa 14.30 172.73 0.45 ns 4.82' 48.02
Biuti 15.27 91.61 0.31 ns 2.25 ns 43.98
Campinas-1 16.63 66.82 0.38 ns -0.73 ns 90.17
Capdebosq 18.32 115.41 0.45 ns 0.91 ns 73.03
Cerrito 14.53 2.46 0.07** -1.13 ns 75.49
Colibri 36.01 664.05 1.04 ns 13.16'’ 67.63
Coral 31.16 2272.25 2.32** 1.91 ns 97.97
Cristal 40.96 5289.10 2.15** 222.98'’ 36.43
Delicioso Precoce 31.13 3070.35 2.04** 88.44'’ 56.22
Diamante 13.69 373.35 0.79 ns 6.32' 69.90
Elberta 17.86 45.09 0.09** 1.62 ns 7.28
Flordaprince 15.51 35.42 0.20* 0.06 ns 48.10
Jóia 4 26.01 8707.64 2.22** 442.74'’ 23.53
Josefina 31.52 951.65 1.43 ns 5.82' 88.98
Lake City 22.27 3120.50 0.33 ns 203.83" 1.46
Maciel 13.69 74.99 0.41 ns -0.87 ns 94.05
Marli 37.63 2213.13 2.19** 13.86'’ 89.82
Minasul 18.93 187.91 0.11** 11.03'’ 2.60
Olímpia 22.00 206.06 0.35 ns 9.26'’ 24.10
Pérola de Itaquera 41.67 4439.53 3.24** 4.95' 97.93
Real 16.11 65.17 0.40 ns -1.17 ns 99.99
Rei da Conserva 21.74 121.13 0.15** 6.33' 7.23
Rubimel 24.37 1013.11 0.53 ns 58.49'’ 11.67
Rubrosol 10.74 30.31 0.27 ns -1.17 ns 99.94
Talismã 36.58 7066.08 4.12** -1.10 ns 99.99
Tropical 34.57 1316.92 1.58 ns 20.30'’ 75.55
Tropic Beauty 11.21 32.98 0.26* -0.79 ns 82.92
Overall mean 23.14
ns: non-significant
*,**: significantly different from 1 by the t test, at 5 and 1% probability, respectively. ‘,”: significantly different from 0 by the F test, at 5 and 1% probability, respectively.
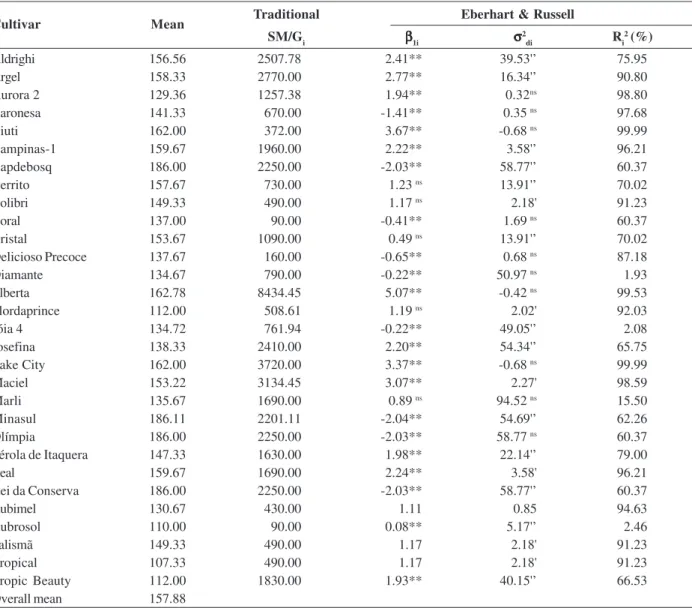
Table 4: Estimates of parameters of adaptability and phenotypic stability obtained by the methods of Eberhart & Russell (1966) and Traditional (Yates & Cochran, 1938) for 28 peach and two nectarine cultivars evaluated in three years for cycle length (days)
Traditional Eberhart & Russell SM/Gi βββββ1i σσσσσ2
di Ri
2 (%)
Aldrighi 156.56 2507.78 2.41** 39.53'’ 75.95
Argel 158.33 2770.00 2.77** 16.34'’ 90.80
Aurora 2 129.36 1257.38 1.94** 0.32ns 98.80
Baronesa 141.33 670.00 -1.41** 0.35 ns 97.68
Biuti 162.00 372.00 3.67** -0.68 ns 99.99
Campinas-1 159.67 1960.00 2.22** 3.58'’ 96.21
Capdebosq 186.00 2250.00 -2.03** 58.77'’ 60.37
Cerrito 157.67 730.00 1.23 ns 13.91'’ 70.02
Colibri 149.33 490.00 1.17 ns 2.18' 91.23
Coral 137.00 90.00 -0.41** 1.69 ns 60.37
Cristal 153.67 1090.00 0.49 ns 13.91'’ 70.02
Delicioso Precoce 137.67 160.00 -0.65** 0.68 ns 87.18
Diamante 134.67 790.00 -0.22** 50.97 ns 1.93
Elberta 162.78 8434.45 5.07** -0.42 ns 99.53
Flordaprince 112.00 508.61 1.19 ns 2.02' 92.03
Jóia 4 134.72 761.94 -0.22** 49.05'’ 2.08
Josefina 138.33 2410.00 2.20** 54.34'’ 65.75
Lake City 162.00 3720.00 3.37** -0.68 ns 99.99
Maciel 153.22 3134.45 3.07** 2.27' 98.59
Marli 135.67 1690.00 0.89 ns 94.52 ns 15.50
Minasul 186.11 2201.11 -2.04** 54.69'’ 62.26
Olímpia 186.00 2250.00 -2.03** 58.77 ns 60.37
Pérola de Itaquera 147.33 1630.00 1.98** 22.14'’ 79.00
Real 159.67 1690.00 2.24** 3.58' 96.21
Rei da Conserva 186.00 2250.00 -2.03** 58.77'’ 60.37
Rubimel 130.67 430.00 1.11 0.85 94.63
Rubrosol 110.00 90.00 0.08** 5.17'’ 2.46
Talismã 149.33 490.00 1.17 2.18' 91.23
Tropical 107.33 490.00 1.17 2.18' 91.23
Tropic Beauty 112.00 1830.00 1.93** 40.15'’ 66.53
Overall mean 157.88
ns: non-significant
*,**: significantly different from 1 by the t test, at 5 and 1% probability, respectively. ‘,”: significantly different from 0 by the F test, at 5 and 1% probability, respectively.
Cultivar Mean
Regarding the cycle length, no cultivar stood out for the desirable stability (σ2
di = 0) and broad adaptability (β1i
= 1.0), with a mean cycle between 91 and 120 days. However, ‘Flordaprince’ and ‘Tropical’, although presenting low predictability, should not be considered as totally undesirable, since they showed R2 above 80% and mean
cycle of 112.00 and 107.33 days, respectively, and may be indicated as cultivars of broad adaptability. In this study, no cultivar of early cycle and predictable performance can be considered as adapted to favorable or unfavorable environments. In addition to the genetic factors, the temperature also influences the fruit cycle (Bruna & Moreto, 2011), since it interferes in the formation of flower and vegetative buds, in dormancy break, and in pheno-logical and productive performance.
There was little similarity between the results obtained by the Traditional and Eberhart & Russell (1966) methods regarding the identification of superior genotypes, particularly for the cultivar ‘Tropical’, which stood out for the stability of cycle length in both methods. The evaluation of the adaptability and stability of guaraná clones using different methods showed that, except for the Traditional method, all had similar results regarding the identification of superior genotypes (Nascimento Filho et al., 2009).
CONCLUSIONS
Cultivar ‘Josefina’ shows broad stability for SS/TA ratio, while cultivars ‘Flordaprince’ and ‘Tropical’ show broad stability for cycle length.
Cultivars ‘Capdebosq’ and ‘Maciel’ are indicated for favorable environments regarding fruit fresh mass, and cultivars ‘Coral’ and ‘Talisman’ for SS/TA ratio.
Cultivar ‘Rubimel’ is indicated for unfavorable environment regarding fruit fresh mass.
ACKNOWLEDGEMENTS
The authors want to thank the National Council of Scientific and Technological Development - CNPq, the Coordination of Improvement of Higher Education Personnel – CAPES, and the Foundation of Support to Research of the State of Minas Gerais - FAPEMIG for the financial support.
REFERENCES
Barbosa W, Chagas EA, Pommer CV & Pio R (2010) Advances in low-chilling peach breeding at Instituto Agronômico, São Paulo State, Brazil. Acta Horticulturae, 872:147-150.
Barbosa W, Ojima M, Dall’orto FAC & Martins FP (1990) Época e ciclo de maturação de pêssegos e nectarinas no estado de São Paulo. Bragantia, 9:221-226.
Bruna ED & Moreto AL (2011) Desenvolvimento dos frutos de pêssego ‘Aurora’ e nectarina ‘Sunraycer’ no Sul de Santa Catarina. Revista Brasileira de Fruticultura, 33:485-492.
Citadin I, Scariotto S, Sachet MR, Rosa FJ, Raseira MCR & Wagner Júnior A (2014) Adaptability and stability of fruit set and production of peach trees in a subtropical climate. Scientia Agricola, 71:133-138.
Cruz CD (2016) Genes Software - extended and integrated with the R, Matlab and Selegen. Acta Scientiarum. Agronomy, 38:547-552.
Cruz CD, Regazzi AJ & Carneiro PCS (2012) Modelos biométricos aplicados ao melhoramento genético. 4ª ed. Viçosa, Editora UFV. 514p.
Eberhart SA & Russell WA (1996) Stability parameters for comparing varieties. Crop Science, 6:36-40.
Leonel S & Tecchio MA (2011) Produção e sazonalidade de pesse-gueiro e nectarineira sob florescimento espontâneo e com cianamida hidrogenada e óleo mineral. Revista Brasileira de Fruticultura, 33:227-234.
Leonel S, Pierozzi CG & Techio MA (2011) Produção e qualidade dos frutos de pessegueiro e nectarineira em clima subtropical do estado de São Paulo. Revista Brasileira de Fruticultura, 33:118-128.
Lima LHS, Braccini AL, Scapim CA, Piccinin GG & Ponce RM (2017) Adaptability and stability of canola hybrids in different sowing dates. Revista Ciência Agronômica, 48:374-380.
Matias RGP, Silva DFP, Silva JOC, Oliveira SP, Ribeiro MR & Bruckner CH (2013) Caracterização de frutos de pessegueiro na Zona da Mata mineira. Revista Brasileira de Ciências Agrárias, 8:416-420.
Matias RGP, Silva DFP, Silva JOC, Oliveira JAA, Cremasco JPG & Bruckner CH (2015) Qualidade de nectarinas produzidas em região de clima subtropical. Revista Ceres, 62:621-626.
Matias GPM, Silva DFP, Miranda PMD, Oliveira JAA, Pimentel LD & Bruckner CH (2016) Relationship between fruits traits and contentes of ascorbic acid and carotenoids in peach. Crop Breeding and Applied Biotechnology, 16:348-354.
Matias RGP, Silva DFP, Ribeiro MR, Silva JOCE, Oliveira SP & Bruckner CH (2014) Características de frutos de pessegueiros cultivados na Zona da Mata de Minas Gerais. Ciência Rural, 44:971-974.
Nascimento Filho FJ, Atroch AL, Cruz CD & Carneiro PCS (2009) Repetibilidade da produção de sementes em clones de guaraná. Pesquisa Agropecuária Brasileira, 44:605 612.
Oliveira DL, Alvarenga AA, Gonçalves ED & Malta MR (2014) Características físico-químicas de cultivares de macieiras pouco exigentes em frio. Revista Ceres, 61:284-287.
Pinthus MJ (1973) Estimate of genotipic value: a proposed method. Euphytica, 22:121-123.
Rakonjac V & •ivanoviæ T (2008) Estability of yield and fruit quality in promising peach cultivars. Journal Central European Agriculture, 9:177-184.
Raseira MCB, Pereira JFM & Carvalho FLC (2014) Pessegueiro. Brasília, Embrapa. 776p.
Scariotto S, Citadin I, Rasiera MCR, Sachet MR & Penso GA (2013) Adaptability and stability of 34 peach genotypes for leafing under Brazilian subtropical conditions. Scientia Horticuturae, 155:111-117.
Santos JA, Nasser FACM & Nasser MD (2015) Qualidade dos frutos de goiabeiras submetidas à poda e aplicação de nitrato de potássio. Cultura Agronômica, 24:271-280.
Silva MA (2008) Interação genótipo x ambiente e estabilidade fenotípica de cana-de-açúcar em ciclo de cana de ano. Bragantia, 67:109-117.
Silva WCJ & Duarte JB (2006) Métodos estatísticos para estudo de adaptabilidade e estabilidade fenotípica em soja. Pesquisa Agropecuária Brasileira, 41:23-30.
Souza Júnior EE, Duarte JB & Chaves LJ (2002) Estabilidade fenotípica em goiabeira (Psidium guajava L.) com ênfase em
peso de fruto, precocidade e período de colheita. Pesquisa Agropecuária Tropical, 32:97-103.
Storck L, Cagnelutti Filho A & Guadagnin JP (2014) Análise con-junta de ensaios de cultivares de milho por classes de interação genótipo x ambiente. Pesquisa Agropecuária Brasileira, 49:163-172.
Toralles RT, Vendruscolo JL, Malgarim BM, Cantilhano RF, Schunemann APP & Antunes PL (2008) Características físicas e químicas de cultivares brasileiras de pêssegos em duas safras. Revista Brasileira de Agrociência, 14:327-338.
Trevisan R (2003) Avaliação da qualidade de pêssegos cv. Maciel, em função do manejo fitotécnico. Tese de Doutorado. Univer-sidade Federal de Pelotas, Pelotas. 105p.