ABSTRACT:Brazilian peach breeding programs have been established to improve peach [Prunus persica (L.) Batsch] production, yield consistency, quality, and disease resistance. Every year several genotypes are selected and their traits must be assessed. This study aimed to evaluate adaptability and stability of fruit set and production of peach genotypes in a subtropical climate, using the GGE biplot methodology. The experimental design was completely randomized with three replicates (trees) in a factorial arrangement of 29 × 3 for genotype and growing season, respectively. The genotypes ‘Conserva 1129’, ‘Rubimel’, ‘Kampai’, ‘Tropic Beauty’, and ‘Cascata 967’ had the greatest adaptability and stability for fruit set. The genotypes ‘Conserva 681’, ‘Santa Áurea’, ‘Atenas’, ‘Kampai’, ‘Cascata 962’, ‘Tropic Beauty’ and ‘Cascata 967’ had the great-est production adaptability and stability. The GGE-biplot methodology classifi ed the peach tree genotypes with regard to adaptability and stability of fruit set and production.
Introduction
The spread of commercial peaches [Prunus persica (L.) Batsch] to subtropical and tropical regions has in-creased rapidly in recent years. This increase is espe-cially noticeable in Brazil, where climatic conditions are highly variable. Subtropical humid zones, located in Southern Brazil, have hot, humid, rainy summers that favor disease development. Furthermore, inconsistent winter dormancy conditions, caused by confl icting air masses of tropical and polar origins, result in both insuf-fi cient chill accumulation in some years or sites and a late frost risk during bloom. Temperatures above 20 °C during the endodormancy period, considered undesir-able (Erez et al., 1979), are also frequent. The cultivars better adapted to Brazil have low chilling requirements (0 to 400 chilling hours below 7.2 °C) (Byrne et al., 2000; Topp et al., 2008). Therefore, Brazilian peach breeding programs have been introduced designed to improve peach production, yield consistency, quality, and disease resistance (Raseira et al., 2003; Medeiros et al., 2011; Sachet et al., 2013).
Mild winters with a wider range of temperature conditions during dormancy have been related to sev-eral physiological and biological disturbances leading to the appearance of a high level of fl oral anomalies and fl ower bud drops, which compromise blooming (Lamp et al., 2001; Bassi et al., 2006; Oukabli and Mahhou, 2007; Nava et al., 2009; Couto et al., 2010). Chilling, when insuffi cient, poses problems for trees that have to over-come endodormancy and can consequently result in low fruit set and yield for genotypes not suitably adapted.
The study of genotype × environment interaction is important for success in temperate fruit cultivation (Gil, 1997). In this sense, knowledge of the adaptability and stability of fruit set and production in different loca-tions or years is crucial when the objective is to increase
crop production potential. Thus, the aim of this work was to evaluate adaptability and stability for fruit set and production of peach genotypes in a subtropical cli-mate using the GGE biplot methodology.
Materials and Methods
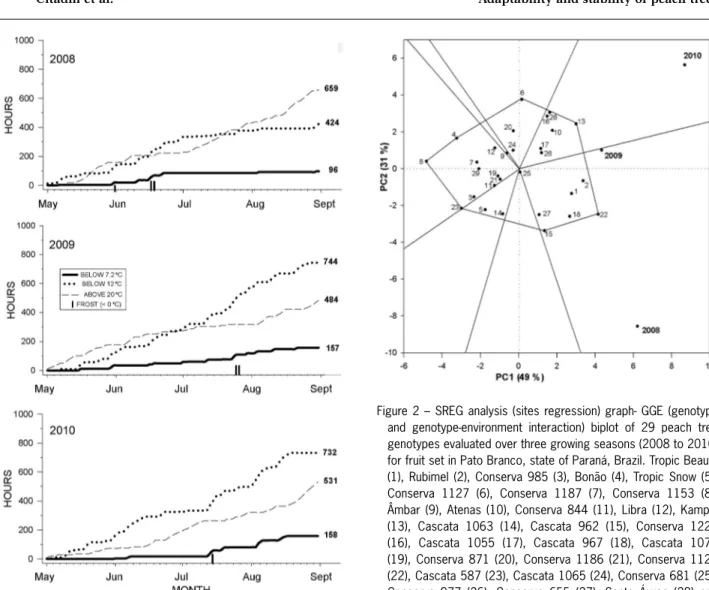
The evaluations were made from 2008 to 2010 in Pato Branco, in the state of Paraná, Brazil (26°10’ S; 52°41’ W, 764 m a.s.l.). The local climate is classifi ed as subtropical humid (Cfa – by Köeppen Classifi cation). The number of hours with temperatures below 12 °C or 7.2 °C or above 20 °C was recorded from May to Aug (Figure 1). Temperatures below 7.2 °C are traditionally used to determine chilling accumulation (Weinberger, 1950). However, nowadays temperatures below 12 °C are also effective for chilling accumulation (Erez and Couvillion, 1987; Citadin et al., 2002; Chavarria et al., 2009), especially for low chilling genotypes. Tempera-tures above 20 °C are undesirable during the dormant period, as they work against the accumulation of chilling (Erez et al., 1979).
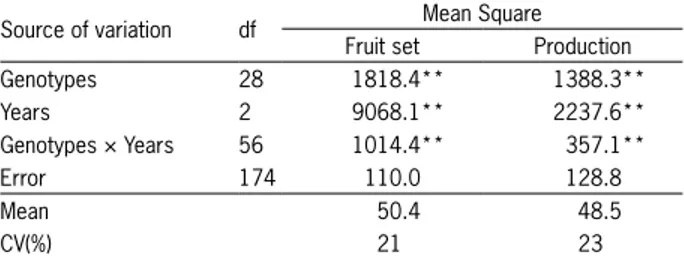
Twenty-nine peach genotypes (Figure 2), most of which originated in Pelotas, in the state of Rio Grande do Sul, Brazil (31°52' S; 52°21' W; 13 m a.s.l.), were eval-uated during the 2008/2009, 2009/2010 and 2010/2011 growing seasons. Each genotype was represented by three plants. Trees were grown in a 4 m × 5 m spac-ing and pruned twice a year (winter and summer). The experiment used a completely randomized design. Five one-year-old shoots, 25 to 30 cm long, per plant were randomly selected from around the canopy for fruit set. The trees were fi ve years old in 2008. The orchard re-ceived standard fungicide and insecticide sprays, prun-ing and fertilization, similar to the treatments used in commercial orchards. No chemical means were used to break dormancy.
Received June 12, 2013 Accepted October 31, 2013
1Federal University of Technology-Paraná – Dept. of Agronomy, Via do Conhecimento, km 01 – 85503-390 – Pato Branco, Paraná – Brazil.
2Embrapa Temperate Agriculture, BR 392, km 78 – 96010-971 – Pelotas, RS – Brazil.
*Corresponding author <[email protected]>
Edited by: Antonio Costa de Oliveira
Adaptability and stability of fruit set and production of peach trees in a subtropical
Idemir Citadin1*, Silvia Scariotto1, Marcos Robson Sachet1, Fábio José Rosa1, Maria do Carmo Bassols Raseira2, Américo
Wagner Junior1
The evaluation of fruit set was carried out between 30 and 35 days after full bloom. The evaluation of tree production was made by multiplying the total number of fruits by the average fruit weight of each genotype and the results were expressed in kg per tree. For fruit numbering, all fruits in three trees of each genotype were counted close to harvest. The weight average was measured collecting 30 fruits at the beginning, at full and at the end of harvest totaling 90 fruits per genotype per year.
To analyze the adaptability and stability of fruit set and tree production, the GGE (genotype main effect plus genotype by environment interaction effect) biplot methodology (Yan and Rajcan, 2002) was used, based on the following model:
where Yijrepresents the average of genotype i in the year
j;
y
j is the mean of all genotypes in the year j; l1xi1hj1the fi rst principal component (PC1); l2xi2hj2 the second principal component (PC2); l
1 and l2 are the self values
associated with PC1 and PC2, respectively; xi1 and xi2 the scores of PC1 and PC2, respectively, for genotype i; h
j1
and hj2 the self values associated with PC1 and PC2, re-spectively, for the year j; and e
ijis the error ij associated with the model (Yan and Kang, 2003). In the GGE biplot method, only the genetic effect and the genotype × en-vironment interaction are considered to be relevant, and both must be considered simultaneously in the evalua-tion of the cultivars. The two main axes represent most of the variation in the data, considering the environment effect as fi xed, i.e., the variation in fruit set or tree pro-duction would be due only to genotype and the genotype × environment interaction (Yan and Rajcan, 2002).
In each graph, a polygon was constructed to join the points that represent the most distant genotypes in relation to the origin of the axes. Later, perpendicu-lar lines were designed for each polygon edge passing Figure 1 – Temperatures below 7.2 °C or 12 °C or above 20 °C from
May to Aug from 2008 to 2010 in Pato Branco, state of Paraná, Brazil.
through the origin, separating it into sections. The geno-types in each sector showed the best performance in en-vironments/years included in that sector (Yan and Kang, 2003).
A PC1 value near the origin indicates that the genotypes have means close to the general mean (repre-sented by the origin of the lines). As the value becomes more distant and to the right of the origin, the greater the value of the variable can be considered and the more adapted the genotypes (in this case, for fruit set or tree production). A PC2 value near zero indicates more sta-ble genotypes. The graphical biplot may also identify the ideal environment (year), indicated by a year that has a high value for PC1 and a value near zero for PC2 (Yan and Kang, 2003).
The normality and homogeneity of the data were checked by Shapiro-Wilk and Bartlett's tests, respec-tively. Then, an analysis of variance (ANOVA) was con-ducted, with genotypes grouped by Scott-Knott’s group-ing test (p £0.05) using GENES Program Software for PC (Cruz, 2006). The graphs were generated using R Pro-gram Software for PC (R Development Core Team, 2010 package "GGEBiplotGUI").
Results and Discussion
In 2008, chilling accumulation was 424 h below 12 °C and 96 h below 7.2 °C, while the temperatures above 20 °C amounted to 659 h. This year was the one with the highest accumulation of temperatures above 20 °C among the years studied. May was mild, with night temperatures below 12 °C and short periods with di-urnal temperatures above 20 °C. Chilling accumulation was observed from the end of May until mid-June, when frost occurred. After this, a tendency towards heat ac-cumulation was observed. Of the years studied, this was the year with the greatest sum of temperatures above 20 °C compared with temperatures below 12 °C (Figure 1). In 2009, chilling accumulation was 744 h below 12 °C and 157 h below 7.2 °C, while the temperatures above 20 °C amounted to 484 h. No long period of heat, with temperatures above 20 °C, was observed, partic-ularly in June. Although not intense, the chilling was continuous, without abrupt temperature fl uctuations (no periods of heat). Dangerous frosts were observed at the end of July (Figure 1). In 2010, chilling accumulation was 732 h below 12 °C and 158 h below 7.2 °C, while temperatures above 20 °C amounted to 531 h. In this year, chilling accumulation was observed only from mid-July, with the occurrence of no dangerous frost (Figure 1).
Genotypes, growing season and the interaction of genotype × growing season were signifi cant for fruit set and production (Table 1). During the three growing sea-sons, the response of fruit set and production differed among genotypes, which indicates the existence of a genotype-environment interaction. This interaction is expressed by the GGE biplot model.
The SREG (sites regression) obtained by genotype and genotype-environment interaction (GGE biplot) was performed to provide an easy visualization of the plete data set in a reduced dimension plot. Principal com-ponents analyses performed in this work showed that 81 % and 84 % of the total variability observed for fruit set and tree production, respectively, could be explained by the fi rst two components: PC1 and PC2. Thus, PC1 and PC2 are expressive and can explain the genotype and genotype-environment interaction (Gauch Jr., 1988). In the GGE biplot model the effects of genotype and geno-type-environment interaction are multiplicative.
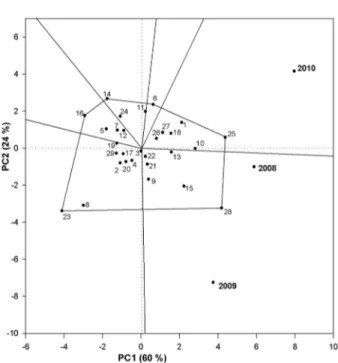
The PC1 was directly connected to the genotypic effect allowing for almost perfect correlation between the variable analyzed and the PC1 score. Therefore, the PC1 represented 49 % and 60 % of the original data vari-ability in the experiment for fruit set (Figure 2) and tree production (Figure 3), respectively. The difference (51 %, for fruit set, and 40 %, for tree production) is related to interaction genotypes × growing seasons (PC2: 31 %, for fruit set, and 24 %, for tree production) and error (20 %, for fruit set, and 16 %, for tree production).
For fruit set, the year 2009 was the environment that could be considered the closest to the ideal because it was the most stable (near the PC2 axis origin) and pro-moted good fruit set (Table 2). The years 2008 and 2010 were the most unstable (far from the PC2 axis origin) with poor fruit set (Table 2), which allowed for better discrimination among the genotypes (Figure 2).
The SREG-GGE biplot graph for fruit set was di-vided into seven sectors. The principal sectors grouped the years 2008 and 2009, and the following genotypes: ‘Conserva 1129’ (22), ‘Cascata 967’(18), ‘Rubimel’(2), ‘Tropic Beauty’ (1), ‘Cascata 962’ (15); ‘Conserva 655’ (27), ‘Conserva 681’ (25) and especially ‘Conserva 1129’ (22) with the greatest fruit set. The other sector grouped the year 2010 and the genotypes ‘Kampai’ (13), ‘Santa Áurea’ (28), ‘Atenas’ (10), ‘Conserva 1223’ (16), ‘Cascata 1055’ (17), ‘Conserva 977’ (26), with ‘Kampai’ being the genotype with the greatest fruit set for this year.
Genotypes ‘Conserva 681’ (25), ‘Cascata 1065’ (4) and ‘Âmbar’ (9) had fruit set near the general average (50 %) and remained stable during the three years of
Table 1 – Source of variation, degree of freedom (df), and mean squares for fruit set and production for twenty nine peach tree genotypes in three growing seasons, from 2008 to 2010.
Source of variation df Mean Square Fruit set Production
Genotypes 28 1818.4** 1388.3**
Years 2 9068.1** 2237.6**
Genotypes × Years 56 1014.4** 357.1**
Error 174 110.0 128.8
Mean 50.4 48.5
CV(%) 21 23
evaluation. The genotypes ‘Conserva 1153’ (8) ‘Bonão’ (4) and ‘Cascata 587’ (23) had the lowest fruit set (Figure 2 and Table 2).
For tree production, the year 2008 was the most stable (near the PC2 axis origin) and promoted reason-able production for most of the genotypes, with an aver-age of 45.6 kg per tree. The years 2009 and 2010 were the most unstable (far from the PC2 axis origin), which allowed for better discrimination among the genotypes, 2010 being the year with the greatest average production in the years studied (Figure 3 and Table 2).
The SREG-GGE biplot graph for tree production (Figure 3) was divided into six sectors. The principal sec-tors grouped the years 2008 and 2009, and the following genotypes: ‘Santa Áurea’ (28), ‘Cascata 962’ (15), ‘Âm-bar’ (9), ‘Conserva 1186’ (21), ‘Conserva 1129’ (22) and ‘Kampai’ (13). The other sector grouped the year 2010 and the genotypes ‘Conserva 681’ (25), ‘Atenas’ (10), ‘Tropic Beauty’ (1), ‘Cascata 967’ (18), ‘Conserva 655’ (27) and ‘Conserva 977’ (26).
The genotypes ‘Rubimel’ (2), ‘Bonão’ (4), ‘Con-serva 871’ (20), ‘Cascata 1055’ (17), ‘Con‘Con-serva 688’ (29), ‘Cascata 1070’ (19), ‘Libra’ (12), ‘Conserva 1187’ (7) and ‘Tropic Snow’ (5) had a similar level of production when compared with each other, but were below the overall average (48.5 kg per tree). ‘Cascata 587’ (23) and ‘Con-serva 1153’ were the most unstable (Figure 3). The fi rst had the greatest chilling requirement among the geno-types studied, and the second had serious problems with fl oral bud abortion (data not shown).
Temperatures above 20 °C during the endodorman-cy period and temperatures above 24 °C near the bloom period, as observed in 2008 (Figure 1), may explain the low fruit set and production in that year (Table 2). Dan-gerous frosts after fruit set, as observed in 2009 (Figure 1), were the cause of instability and low production ob-served in this year (Figure 3 and Table 2). In Southern Table 2 – Mean grouping test for fruit set and production for twenty nine peach tree genotypes in three growing seasons, from 2008 to 2010.
Genotypes Fruit set Production
% kg per tree
Tropic Beauty (1) 65.7 a* 56.0 b
Rubimel (2) 70.1 a 40.2 c
Conserva 985 (3) 34.3 d 48.8 c
Bonão (4) 26.7 e 44.6 c
Tropic Snow (5) 38.0 d 37.6 d
Conserva 1127 (6) 44.2 c 49.1 c
Conserva 1187 (7) 34.3 d 45.3 c
Conserva 1153 (8) 17.6 e 27.8 e
Âmbar (9) 48.9 c 51.1 c
Atenas (10) 61.1 b 65.0 b
Conserva 844 (11) 45.8 c 48.1 c
Libra (12) 42.1 c 44.7 c
Kampai (13) 68.8 a 60.8 b
Cascata 1063 (14) 49.1 c 35.7 d
Cascata 962 (15) 62.1 b 64.3 b
Conserva 1223 (16) 58.1 b 33.1 d
Cascata 1055 (17) 56.6 b 42.2 c
Cascata 967 (18) 69.2 a 54.0 b
Cascata 1070 (19) 46.5 c 45.9 c
Conserva 871 (20) 47.5 c 44.4 c
Conserva 1186 (21) 42.7 c 54.1 b
Conserva 1129 (22) 77.0 a 50.7 c
Cascata 587 (23) 33.7 d 20.2 e
Cascata 1065 (24) 49.0 c 44.6 c
Conserva 681 (25) 56.0 b 75.1 a
Conserva 977 (26) 59.3 b 54.4 b
Conserva 655 (27) 58.7 b 51.3 c
Santa Áurea (28) 61.5 b 76.3 a
Conserva 688 (29) 37.0 d 41.1 c
Years
2008 40.8 C 45.6 B
2009 61.1 A 45.6 B
2010 49.3 B 54.4 A
*Means followed by same lower case letter, by genotypes, and capital letter, by years, in the column, does not differ (Scott-Knott test, p £ 0.05).
Brazil, the occurrence of frost usually coincides with the period of fl owering and fruit development (Raseira et al., 1992) and is one of the serious problems found in peach cultivation. On the other hand, chilling negation by high temperatures is a cause of low budbreak in peach (Rich-ardson et al., 1974; Erez et al. 1979). Temperatures above
24 °C during pre-blooming and blooming are related to abnormal development of pollen and ovules (Nava et al., 2009; Couto et al., 2010), leading to low fl ower fertiliza-tion and, consequently, low fruit set.
In 2010, despite having the same chill accumula-tion as in 2009 (Figure 1), it occurred later, and was not as effective in overcoming dormancy of fl ower buds, with heat accumulation during pre-blooming period, from the beginning of to mid July (Figure 1), causing lower fruit set than in 2009, but more than in 2008 (Table 2). Frost in late July was not dangerous, but caused fruit drop in a few genotypes that had already reached full bloom. The heat, during pre-blooming, and the frost, after blooming, were responsible for instability observed in both fruit set and production in 2010 (Figure 2 and Figure 3).
Rodrigo and Herrero (2002) observed that an in-crease in temperature accelerated fl ower bud develop-ment causing a hastening in fl owering time and follow-ing hand-pollination, reduced fruit set in apricot. At anthesis, fl owers that had developed in warmer condi-tions weighed less and showed less development of the pistil than control fl owers. ‘Tropic Beauty’ (1), ‘Kampai’ (13), ‘Cascata 967’ (18), ‘Santa Áurea’ (28), ‘Atenas’ and ‘Conserva 681’ (25) appear to tolerate higher tempera-tures during the dormancy period, thus maintaining good fruit set (Figure 2) and production (Figure 3) even in years with low chill and high heat accumulation, as in 2008.
The development of varieties with low chilling requirement with good tolerance to high temperatures during fl owering, make production more consistent (Sherman and Lyrene, 1984), especially in subtropical regions in low latitudes, in which temperatures above 20 °C often occur. ‘Conserva 1153’ (8) and ‘Cascata 587’ (23) had low fruit set (Figure 2) and tree production (Fig-ure 3) in the years studied. Ensuring good fruit set is im-portant, but this alone is not suffi cient for good produc-tion. Production is a function of orchard density, fl ower density, index of fruit set and fruit size for all species, varieties and climatic conditions (Dennis Jr., 1981).
Excellent yields were obtained when there is good fruit set and fruit size. However, after fruit set, the num-ber of fruits per plant is generally standardized by thin-ning practices; a fact that occurred in this experiment, therefore, from the thinning, production will be defi ned by fruit size of each genotype. Yamaguchi et al. (2002) found both cell number and cell size differences were signifi cantly correlated with peach fruit size, although the correlation coeffi cients between cell number and fruit weight were consistently higher.
In sweet cherry, differences in mesocarp thick-ness were correlated with both cell number and cell size
(Yamaguchi et al., 2004). Mesocarp cell number was remarkably stable and virtually unaffected by the en-vironment as neither growing location nor physiologi-cal factors that reduced fi nal fruit size altered the cell numbers. Cell length was also different among the cul-tivars (p < 0.05), but failed to contribute to the overall difference in fruit size. Cell length was infl uenced by the environment, indicating that cultural practices that maximize mesocarp cell size should be used to achieve a fruit size potential of the cultivar (Olmstead et al., 2007).
Other related genotype-dependent fl oral biology factors affect fruiting in temperate fruit species, such as fl ower bud production, fl ower production, fl ower bud drop, fl owering time, percentage pollen germination, height difference between the stigma and the superior plane of the anthers, percentage of aborted pistils, autog-amy level, fruit set and fruit production (Ruiz and Egea, 2008). Some of these characteristics may have contrib-uted to the reduction of the average fruit set and pro-duction in the genotypes studied, even those genotypes that had suffi cient chilling accumulation. These causes should be elucidated in future work.
In conclusion, genotypes ‘Conserva 1129’, ‘Rubi-mel’, ‘Kampai’, ‘Tropic Beauty’ and ‘Cascata 967’dem-onstrated the greatest adaptability and stability for fruit set. The genotypes ‘Conserva 681’, ‘Santa Áurea’, ‘At-enas’, ‘Kampai’, ‘Cascata 962’, ‘Tropic Beauty’ and ‘Cas-cata 967’ demonstrated the greatest adaptability and stability of production (kg per tree). The GGE-biplot methodology was successful in classifying peach tree genotypes with regard to adaptability and stability of fruit set and production.
Acknowledgments
This research was supported in part by, CNPq (Brazilian National Council for Scientifi c and Technologi-cal Development), the Araucária Foundation, Embrapa Temperate Agriculture and CAPES (Coordination for the Improvement of Higher Level Personnel).
References
Bassi, D.; Bartolini, S.; Viti, R. 2006. Recent advances on environmental and physiological challenges in apricot growing. Acta Horticulturae 717: 23-31.
Byrne, D.H.; Wayne, B.; Bacon, T.A. 2000. Stone fruit genetic pool and its exploitation for growing under warm winter conditions.
p. 157-230. In: Erez, A., ed. Temperate fruit crops in warm climate. Kluwer Academic, Dordrecht, The Netherlands. Chavarria, G.; Herter, F.G.; Raseira, M.C.B.; Rodrigues, A.C.;
Reisser, C.; Silva, J.B. 2009. Mild temperatures on bud breaking dormancy in peaches.Ciência Rural 39: 2016-2021.
Couto, M.; Raseira, M.C.B.; Herter, F.G.; Silva, J.B. 2010. Infl uence of high temperatures at blooming time on pollen production and fruit set of peach cvs. Maciel and Granada. Acta Horticulturae 872: 225-230.
Cruz, C.D. 2006. Genes Program: Biometry = Programa Genes: Biometria. Editora UFV, Viçosa, MG, Brazil (in Portuguese). Dennis Jr., F.G. 1981. Limiting factors in fruit set of ‘Delicious’
apple. Acta Horticulturae 120: 119-124.
Erez, A.; Couvillon, G.A. 1987. Characterization of the infl uence of moderate temperatures on rest completion in peach. Journal of the American Society for Horticultural Science 112: 677-680. Erez, A.; Couvillon, G.A.; Hendershott, C.H. 1979. Quantitative
chilling enhancement and negation in peach buds by high temperatures in a daily cycle. Journal of the American Society for Horticultural Science 104: 536-540.
Gauch Jr., H.G. 1988. Model selection and validation for yield trials with interaction. Biometrics 44: 705-715.
Gil, G. 1997. Fruticulture: The Productive Potential = Fruticultura: El Potencial Productivo. Ediciones Universidad Católica de Chile, Santiago, Chile (in Spanish).
Lamp, B.M.; Connell, J.H.; Duncan, R.A.; Viveros, M.; Polito, V.S. 2001. Almond fl ower development: fl oral initiation and organogenesis. Journal of the American Society for Horticultural Science 126: 689-696.
Medeiros, J.G.S.; Citadin, I.; Santos, I.; Assmann, A.P. 2011. Reaction of peach tree genotypes to bacterial leaf spot caused by Xanthomonas arboricola pv. pruni. Scientia Agricola 68: 57-61.
Nava, G.A.; Dalmago, G.A.; Bergamaschi, H.; Paniz, R.; Santos, R.P.; Marodin, G.A.B. 2009. Effect of high temperatures in the pre-blooming and blooming periods on ovule formation, pollen grains and yield of 'Granada' peach. Scientia Horticulturae 122: 37-44.
Olmstead, J.W.; Iezzoni, M.F.; Whiting, M.D. 2007. Genotypic differences in sweet cherry fruit size are primarily a function of cell number. Journal of the American Society for Horticultural Science 132: 697-703.
Oukabli, A.; Mahhou, A. 2007. Dormancy in sweet cherry (Prunus avium L.) under Mediterranean climatic conditions. Biotechnology, Agronomy, Society and Environment 11: 133-139.
Raseira, M.C.B.; Herter, F.; Silveira, C.A.P. 2003. The Embrapa Clima Temperado peach breeding program and adaptation to subtropical regions. Acta Horticulturae 606: 45-50.
Raseira, M.C.B.; Baptista, J.S.; Herter, F.G.; Peters, J.A. 1992. Peach tree, Prunus persica L. Batsch, fl ower buds cold sensibility. Revista Brasileira de Fruticultura 14: 167-172 (in Portuguese, with abstract in English).
Richardson, E.A.; Seeley, Sd.; Walker, D.R. 1974. A model for estimating the completion of rest for ‘Redhaven’ and ‘Elberta’ peach trees. HortScience 1: 331-332.
Rodrigo, J.E.; Herrero, M. 2002. Effects of pre-blossom temperatures on fl ower development and fruit set in apricot. Scientia Horticulturae 92: 125-135.
Ruiz, D.; Egea, J. 2008. Analysis of the variability and correlations of fl oral biology factors affecting fruit set in apricot in a Mediterranean climate. Scientia Horticulturae 115: 154-163. Sachet, M.R.; Citadin, I.; Scariotto, S.; Santos, I.; Zydek, P.H.;
Raseira, M.C.B. 2013. Reaction of peach genotypes to bacterial leaf spot: correlations with environmental conditions, leaf phenology and morphology. HortScience 48: 28-33.
Sherman, W.B.; Lyrene, P.M. 1984. Biannual peaches in the tropics. Fruit Varieties Journal 38: 37-39.
Topp, B.L.; Sherman, W.B.; Raseira, M.C.B. 2008. Low-chill cultivar development. p. 106-138. In: Layne, D.R.; Bassi, D., eds. The peach: botany, production and uses. CAB international, Wallingford, UK.
Weinberger, J.H. 1950. Chilling requirements of peach varieties. Proceedings of the American Society for Horticultural Science 56: 122-128.
Yamaguchi, M.; Haji, T.; Miyake, M.; Yaegaki, H. 2002. Studies on the varietal differences and yearly deviation of mesocarp cell numbers and lengths and fruit weight among commercial peach [Prunus persica (L.) Batsch] cultivars and selections, wild types, and their hybrids. Journal of the Japanese Society for Horticultural Science 71: 459-466.
Yamaguchi, M.; Sato, I.; Takase, K.; Watanabe, A.; Ishiguro, M. 2004. Differences and yearly variation in number and size of mesocarp cells in sweet cherry (Prunus avium L.) cultivars and related species. Journal of the Japanese Society for Horticultural Science 73: 12-18.
Yan, W.; Kang, M.S. 2003. GGE Biplot analysis: a graphical tool for breeders, geneticists, and agronomists. CRC Press LLC, Boca Raton. FL, USA.