Aedes aegypti – SPACE DISTRIBUTION AND TEMPORAL VARIATION
BREEDING SITES IN THE WEST OF SANTA CATARINA STATE
Aedes aegypti – Distribuição espacial e variação temporal de criadouros no Oeste catarinense https://doi.org/10.18593/eba.24487
Recebido em 26 de outubro de 2019 | Aceito em 18 de junho de 2020
Julia Fritsch Silva* Bruna Kruczewski† Fernanda Maurer D’Agostini‡
* Graduanda no Curso de Medicina da Universidade do Oeste de Santa Catarina.
† Mestra em Enfermagem pela Universidade Federal do Paraná; Especialista em Saúde da Família pela Universidade Federal do Paraná;
Professora na Universidade do Oeste de Santa Catarina.
‡ Doutora em Ciências Biológicas pela Pontifícia Universidade Católica do Rio Grande do Sul; Mestra em Biociências (Zoologia) pela Pontifícia
Universidade Católica do Rio Grande do Sul; Professora na Universidade do Oeste de Santa Catarina.
Abstract: This article is a retrospective ecological study, of descriptive analysis, that evaluates the spatial distribution of
Aedes aegypti breeding sites and its correlation with environmental and climate characteristics of the western region of Santa Catarina. Its objective was to analyze the spatial distribution of breeding sites by mapping and correlating with climatic and environmental variables in the period between 2009 and 2017, by mapping breeding sites with Ae. Aegypti larvae by the use of Google Maps, correlating the temperature and precipitation averages. It was found a positive relation between temperature increase and the number of outbreaks, and it also established that the high rainfall averages in this region may influence the spread of the mosquito, but this information could not be confirmed in the present study. It was concluded that the temperature was a determining factor in the dissemination of the vector, being higher than the precipitation variable in the analyzed region.
Keywords: Aedes aegypti. Dengue. Arbovirus. Disease vectors.
Resumo: Este artigo é um estudo ecológico retrospectivo, de análise descritiva, que avalia a distribuição espacial de criadouros do vetor Aedes aegypti e a sua correlação com características ambientais e climáticas da região Oeste de Santa Catarina. Seu objetivo foi analisar a distribuição espacial dos criadouros por meio do mapeamento e correlação com variáveis climáticas e ambientais no intervalo de tempo entre 2009 e 2017, por meio do mapeamento de criadouros com larvas de Ae. Aegypti pelo programa Google Maps, correlacionando as médias de temperatura e de precipitação. Foi constatada uma relação positiva entre o aumento da temperatura e o número de focos, além de estabelecer que nessa região as altas médias pluviométricas podem influenciar a disseminação do mosquito, mas isso não pôde ser confirmado no presente estudo. Concluiu-se que a temperatura foi um fator determinante na disseminação do vetor, sendo superior à variável precipitação na região analisada.
Palavras-chave: Aedes aegypti. Dengue. Arbovirose. Vetores de doenças.
@ Corresponding author: Graduanda no Curso de Medicina da Universidade do Oeste de Santa Catarina. Rua Roberto Trompowski, 275, Centro, 89600-000, Joaçaba, Santa Catarina, Brasil.
1 INTRODUCTION
Dengue is caused by an arbovirus of the genus Flavivirus and of the family Flaviviridae, of which there are four serotypes.¹ In South America circulate the serotypes DENV-1, 2 and 3,² characterized by muscle and joint pains,² common in tropical areas.¹ In Brazil there are two species of mosquitoes that present vector competence for this virus, Aedes aegypti – the one with domestic habits,³ and Aedes albopictus – with rural habits being considered a potential vector, naturally infected by Dengue virus for the first time in
America in 1995, during an epidemic in Mexico.4
During the 90’s and 2000’s, the incidence of dengue in the Americas showed increasing results, even with the applicability of eradication and control programs that were implemented. The exception occurred in 2009, when there was a 25% decrease in dengue cases in Brazil, compared
to the same period in 2008.5 This decrease in cases
may have occurred due to several factors, such as the population’s previous immunity – since the previous infection confers lasting immunity to
that serotype,3,6 its cyclic transmission character,6
the weather conditions of each perio,6 the rural
– urban migratory flows and the increase in population density, with an inversely proportional relation to basic sanitation, especially water and garbage quality.³
The western region of Santa Catarina is located between the states of Paraná and Rio Grande do Sul, presenting a high flow of people and loads throughout the year, thus facilitating the dissemination of the vector Ae. Aegypti.7 Considering the problem of the increasing number of the vector breeding sites – such as climate, density, urbanization and industrialization, the incorporation of the spatial
distribution dimension of the outbreaks would make it easier to control the increase of them, defining the spatial diffusion pattern of the vector and diseases permitting the identification of potential risk areas. The objective of this study, thus, was to analyze the spatial distribution of Ae. aegypti breeding sites by mapping them, linking this pattern with environmental and climate variables in the western region of Santa Catarina State, determining the interrelationships between the patterns and behavior curves of the studied phenomenon.
2 MATERIALS AND METHODS
This is a quantitative, retrospective, descriptive analysis study based on spatial epidemiology and health geography, using the health western region of Santa Catarina as its aggregated observation unit, and the analysis unit, the municipalities that comprise this area. Data were collected through secondary databases obtained from DIVE/SC, referring to the period from 2009 to 2017, regarding information about the vector and its outbreaks and between 2009 and 2014 regarding the number of confirmed and suspected dengue cases.
The variables used regarding temperature, precipitation, altitude and population density were provided by IBGE (Instituto Brasileiro de Geografia e Estatística – Brazilian Institute of Geography and Statistics), by INMET (Instituto Nacional de Meteorologia – National Institute of Meteorology) and Epagri, SC (Empresa de Pesquisa Agropecuária e Extensão Rural de Santa Catarina – Agricultural Research and Rural Extension Company of Santa Catarina). Regarding the precipitation, it was considered the total monthly amount, and then the
arithmetic average was carried out, per year studied, of the values obtained every month on the website of INMET (Estação Convencional de Chapecó, SC – Conventional Station of Chapecó, SC). The temperature was obtained from the recording of the temperatures at the beginning of each month – day 01, also taken from INMET (Estação Convencional de Chapecó, SC), being also performed its arithmetic average per year. Because it is fully related to weather conditions, the information was collected from a single conventional station, extending its information throughout the analyzed region. The information regarding the vector was collected by the Vigilantus Information System from DIVE/SC, the data pertaining to confirmed and suspected cases of Dengue are public information obtained from the DIVE/SC website. The data provided by LIRAa (Levantamento Rápido de Índices de Infestação pelo Aedes aegypti – Quick Survey of Aedes aegypti Infestation Indexes) were not considered in the analysis due to the absence of well – defined time periods for the reliable capture of this information. The maps were provided by Google Maps© and adapted by the authors.
As for Santa Catarina, the state is located south of the Tropic of Capricorn, and its west
mesoregion is the largest in its territory.8 The
proposed study considered 25 municipalities, which comprise the western region of the state according to DIVE/SC (Diretoria de Vigilância Epidemiológica do Estado de Santa Catarina – Directorate of Epidemiological Surveillance of the State of Santa Catarina), composing the 4th Regional Health Department of the State of Santa Catarina of Chapecó. According to IBGE, this coverage area has an estimated population of 353,969 inhabitants, with an area of territorial unit
equivalent to 3,950.72 km2.
Regarding the climatic, geographical and environmental characteristics of the western region of Santa Catarina State, it is known that it encompasses two agroecological zones, Santa
Catarina Northwest and the Uruguay River Valley.9
The climate of the region ranges from subtropical to humid temperate, without dry season, with hot to cool summer, with annual average temperature between 16.3 °C to 19.8 °C, total annual precipitation between 1.430 to 2.280 mm, with
the highest rainfall index of the State.9 Regarding
the geomorphology there is a predominance of a dissected relief, with deep valleys and slopes at altitudes between 300 and 1,000m. The current vegetation consists of Mixed Ombrophilous Forest
and agriculture with cyclic crops.9
Data relating to Ae. Aegypti breeding sites were first tabulated in Microsoft Excel© and then mapped by Google Maps©. The other data used in this research paper were tabulated and added to charts by Microsoft Excel©. In this first stage of the study, deposits without larvae at the time of collection and those that could not be mapped were excluded. In the second stage, using the public data provided by DIVE/SC, the data referring to the number of monthly and annual outbreaks in the period from 2009 to 2017, as well as the number of confirmed cases of dengue in the period from 2009 to 2014 were tabulated.
3 ETHICAL APPROVAL
The study was authorized by DIVE/ SC, approved by CEP/Unoesc (Research Ethics Committee of the University of Western Santa Catarina) – with Certificate of Presentation for Ethical Appreciation – CAAE number 95804918.3.0000.5367.
4 RESULTS
From 2009 to 2017, in the western region of Santa Catarina, 6.429 larvae outbreaks of the vector Ae. Aegypti were mapped by Google Maps©, distributed in 20 municipalities among the 25 integrators of the analyzed geographic extension. Between 2009 and 2012 the number of mosquito outbreaks was restricted to a maximum of four municipalities. From 2013 on, there was an increase in the number of municipalities with vector outbreaks compared to previous years, and the largest number of outbreaks of Ae aegypti during the study period was identified in 2014 – totaling 1,853 mapped outbreaks diffused in 4 municipalities (Figure 1).
Figure 1 – Map of the 2014 outbreaks of the western region of Santa Catarina10
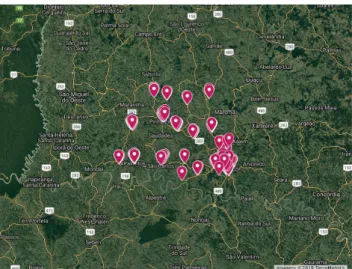
In 2016, on the other hand, was the year with the largest number of cities with mosquito outbreaks – totaling 18 affected jurisdictions (Figure 2). In addition, most outbreaks of the period were found in larvae trap deposits.
Figure 2 – Map of the 2016 outbreaks of the western region of Santa Catarina10
Regarding the locations of outbreaks, they predominate in urban region, in occupied lands and in the most populated areas. The region has an average territorial area per city of 258.02 km² and a population average of 14,158.76 inhabitants per municipality (Table 1), being Chapecó the most populated area and the one with the largest cluster of outbreaks. Regarding the terrain, there is a predominance of outbreaks in plain topographies, with greater concentration of larval outbreaks in areas close to different industries, such as cooperatives, silos, metallurgists and feed factories.
Table 1 – Demographic data of municipalities in the western region of Santa Catarina.11
Municipality Estimated Population
Population Density – inhabitants/ km² Territorial Unit Área – Km² Águas de Chapecó 6.445 43,7 139,832 Águas Frias 2.387 31,84 76,14 Caibi 6.213 35,57 174,839 Caxambu do Sul 3.850 31,35 140,709
Municipality Estimated Population Population Density – inhabitants/ km² Territorial Unit Área – Km² Chapecó 213.279 293,15 626,06 Cordilheira Alta 4.321 45,46 82,858 Coronel Freitas 10.130 43,65 233,964 Cunha Porã 11.057 48,7 217,915 Cunhataí 1.955 33,75 55,768 Formosa do Sul 2.549 25,98 100,105 Guatambú 4.733 22,73 205,875 Irati 1.984 26,78 78,276 Jardinópolis 1.625 26,09 67,683 Nova Erechim 4.879 65,88 64,892 Nova Itaberaba 4.339 31,02 137,547 Palmitos 16.253 45,45 352,504 Pinhalzinho 19.511 127,44 128,159 Planalto Alegre 2.844 42,49 62,461 Quilombo 10.044 36,57 280,258 Riqueza 4.670 25,2 191,907 Santiago do Sul 1.317 19,84 73,836 São Carlos 11.132 63,8 161,292 Serra Alta 3.301 35,57 92,348 Sul Brasil 2.551 24,51 112,872 União do Oeste 2.600 31,42 92,617
In the second stage of the study, all outbreaks from 2009 to 2017were considered, including those that were not mapped in the first stage due to the non-localization of the respective addresses in the mapping program used, as these are mostly in locations of sparsely populated districts. During this period, 10,053 vector water forms outbreaks were obtained, distributed among 24 of the 25 municipalities in the region, with the largest number of outbreaks found in 2014, with 2,851 outbreaks. Correlating the data
from 2014, it can be observed that it was the second year with the highest rainfall index – with
an annual total corresponding to 2,590mm3, just
behind the year 2015 - with 2,840mm3, and still in
2014, obtained the average of annual temperature equivalent to 20.2 °C – the fourth highest average in the determined period. For the analysis of the seasonality of the outbreaks, it was summed the months in the studied period, showing that the largest number of outbreaks was evidenced in March, totaling 1,774 outbreaks, followed by April, with 1,610 outbreaks. The months with the lowest number of vector outbreaks were July – with 55 outbreaks, and August – with 76 outbreaks.
Regarding the rainfall and the frequency of outbreaks, it was noted that there was an increase in the number of outbreaks of Ae. Aegypti in periods with the lowest rainfall in the year (Figure 3), since the months with the highest monthly average rainfall in the studied period were June (215.7 mm) and September (238.9 mm) – periods with a decrease in the number of outbreaks, and the months with the lowest monthly average rainfall were January (134.1 mm) and May (123.1 mm) – when there was an increase in the number of outbreaks of mosquito larvae. However, it should be considered that despite these results, the regional rainfall average is high throughout the analyzed period.
Figure 3 – Average Monthly Precipitation and Frequency of Aedes aegypti outbreaks between 2009 and 2017 in the western region – SC.12
Regarding temperature and its correlation with the frequency of mosquito outbreaks, a directly proportional relation was observed between temperature increase and the increase of vector outbreaks, since in the period with higher temperatures – as evidenced in February (25.3 °C) and March (23.4 °C) – were the periods in which a large number of mosquito outbreaks were accounted for, with a total of 1566 outbreaks in February and 1774 in March (Figure 4).
Figure 4 – Average Monthly Temperature and Frequency of
Aedes aegypti outbreaks between 2009 and 2017 in
the western region – SC.12
It should also be noted that although this period is a transition between two seasons of the year – summer and autumn – high temperatures still occur throughout the region, thus explaining
the detection of high number of outbreaks in a season considered mild in terms of temperature.
Regarding Dengue cases, only the confirmed cases between 2009 and 2014 were evaluated, with values much lower than those obtained throughout the State of Santa Catarina – while the western region of Santa Catarina presented 48 cases – despite its high incidence of outbreaks of such pathology vector, the State as a whole presented 779 – among imported and autochthonous cases.
5 DISCUSSION
Ae. Aegypti is the arbovirus transmitting mosquito that triggers pathologies with clinical similarities, such as urban yellow fever, dengue, Zika and Chikungunya – epidemic diseases in the country. The Ae. Aegypti is originally from Egypt, and spread to tropical regions through the Great
Navigations during the slave trade.11 In Brazil,
the first suspected cases of dengue occurred in Curitiba, PR and Niterói, RJ, between the late 19th and early 20th centuries. In Santa Catarina the first indigenous cases occurred in 2011 in Joinville and São João do Oeste, in 2013 there were two epidemics of dengue in Chapecó and Itapema, and in 2015 the state faced the first epidemic of the
disease.12
The Ministry of Health states that Ae. Aegypti is domestic, common in tropical and subtropical regions, urban and found predominantly between the latitudes 35º North and 35° South, at an approximate altitude of 1,000
m.12 And although its transmission is already
ubiquitous in all tropics, Asia and America are the
continents with the highest ris.6 Such information
confirms the discoveries of this study, where most of the outbreaks found were in lowland areas, with
low altitudes and in urban regions, predominantly – that if defined by the method of economic occupation of the population, secondary and tertiary activities prevail in urban areas, whereas
in rural areas the primary activities predominate.13
For Tauil3 and Gubler14 the demographic
changes that occurred since the 1960s culminated in a deficiency in sanitation due to unplanned urbanization – Inadequate waste collection and industry development – leading to a higher production of disposable materials improperly discarded, creating favorable environments for the development of Ae. Aegypti. This confirms the discoveries of this research, where the largest numbers of breeding sites were found near urban and industrial areas.
In the western region of Santa Catarina, a directly proportional relation was observed between the increase in temperatures – most evident in the summer months, and the largest number of Ae. Aegypti breeding sites, even with mild temperature averages that the western region of the state usually presents. This relation can be explained by the higher efficiency of the vector under these conditions, accelerating the end of
the extrinsic incubation period of the virus,15
corroborating the findings of the studies by Bhatt et al.,6 Koopman et al.15 and Tuladhar et al.,16 and in agreement with Costa, Santos, Mendonça,
Cavalcanti and Ribeiro17 – who noted reduction in
females spawning exposed to higher temperatures. In this study, it was observed that the number of mosquito breeding sites did not increase during periods of higher precipitation, corroborating with other studies related to
precipitation and number of breeding sites,6,16
however, the studied region showed high levels of rainfall, well distributed throughout the
evaluated period. Therefore, this finding should not be considered as a sensitizer to the vector development because it is a deficiency found in its results. Moreover, because it is a domestic mosquito, factors such as places with stored water and inappropriate waste discard can also be considered as factors that influence the number of
breeding sites, as well as precipitation.16
When relating the monthly temperature averages and precipitation, the largest number of outbreaks is concentrated in the early periods of the year – with higher temperature levels and lower rainfall index. The temperature in this region is shown to be the predominant factor in determining mosquito proliferation in relation to precipitation. According to a study conducted in different regions of Brazil, a significant variation was identified in the correlation between climate,
precipitation and epidemics in different regions,18
thus, this pattern observed in the western region of Santa Catarina fits in as a result of these remarkable variations patterns of vector development, not extending to the rest of the country.
Considering the factors that encompass the biological characteristics of the mosquito, plentiful policies have already been made by the Ministry of Health. The LIRAa, which comprises
a simplified sampling method,19 emerged from the
intention to better evaluate the Ae. aegypti indexes in the country. The most used indicators by LIRAa are the Building Infestation Index (IIP) and the Breteau Index (IB). The Building Index allows the obtainment of the percentage of positive buildings, and is therefore used to measure the population level of the vector, whereas the most used index is currently Breteau, which evaluates the relation between the number of positive containers and
Deposits can then be classified into groups. Group A contains water storage, group B corresponds to mobile deposits and group C to fixed deposits. Group D refers to deposits that can be removed; finally, group E comprises natural
deposits.19 The study described here did not use the
indicators described by LIRAa due to problems in obtaining sufficient data for the analysis, however, there was a predominance of ARM Trap outbreaks – containers with water placed in strategic locations – or with low infestation and thus unable to detect ovitraps and larvitraps in order to control potential infestation.¹
Ong et al. while in his research evaluating the entomological BP (Breeding Percentage), noticed a striking relation between its annual median and the total annual population, suggesting that the dissemination of the vector may
be related to population growth,20 corroborating
the results found in this study, that the highest concentrations of vector breeding sites – when compared to the total mapped breeding sites – are in the regions with the highest concentration and potential for population growth. It should be considered, however, that the cities studied here have low population density – with a median of
25.57 inhabitants/km2 compared to world averages
of approximately 50.79 inhabitants/km2,21
requiring further analysis to consider urbanization a definite cause for increased vector spread.
The situation of Dengue and Ae. Aegypti in the State of Santa Catarina, has been drawing the government agencies attention because of the increase in recent years, not only in the number of outbreaks and breeding sites, but also in the notification of cases. In 2015, 11,263 cases of dengue were reported in Santa Catarina, of which 3,605 were confirmed, of which 91% came from
indigenous transmission. A follow-up of the cases showed that the period with the largest record of confirmed autochthonous cases was between March 15 and March 21. In 2015, 7,244 Ae. Aegypti outbreaks were identified in the State, existing at the time 28 infested municipalities, among them Chapecó, Coronel Freitas, Cunha Porã, Nova Itaberaba, Palmitos, Pinhalzinho, Planalto Alegre, Serra Alta and União do Oeste, municipalities included in this study and belonging to the
western region of the state.22
In 2016, the State notified 13,966 suspected cases of dengue, of which 31% were confirmed, comprising 4,378 cases. In that year, Pinhalzinho was the municipality that presented the most autochthonous cases, corresponding to an incidence rate of 13,120.5 cases per 100,000 inhabitants, corresponding in absolute numbers
to 2,453 cases.23 In 2017, 11,567 mosquito outbreaks
were identified, and in relation to dengue cases in the same period, 2,498 were reported, but only 16 were confirmed by laboratory criteria. If compared to the values obtained in the same period in 2016, there was a decline of 82% in the cases reported in
2017.24 It is observed, than, that the region studied
tends to follow the same fundamentals pointed out in the state – with an increase in the number of mosquito outbreaks in the last decade. Likewise, it is possible to evidence that despite the increase in the number of outbreaks, the confirmed cases did not increase in the same proportion, thus it is clear that there is no positive relation between the increase in the number of vectors and dengue in the region – since for the transmission of the disease the mosquito must presents with the virus – and even if there are numerous outbreaks, there is no disease spread if the mosquito is not infected.
Through this study, the environmental and climatic characteristics of the evaluated territory may be pointed as the cause of the scanty spread of Dengue in the West of Santa Catarina – with mild temperatures and subtropical to temperate
climate,9 limiting the spread of arbovirus. However,
since Brazil is a country of continental dimensions, risk mapping becomes a necessary purpose for the regional analysis of the vector situation and for the definition of weaknesses in inspections, as well as for the adoption of measures to control the transmission of associated pathologies, since the increase in the number of dengue cases in the country in recent years – In contrast to data obtained in the state of Santa Catarina – reflects the ineffectiveness of the actions announced by the PNCD (Plano Nacional de Controle da Dengue – National Dengue Control Plan), established in
the country in 2002.25
Regarding Santa Catarina, the lack of actions to curb the spread of the mosquito will culminate in a greater economic cost for the state once the number of Dengue cases accompanies the growth of breeding sites. This will become true when the biological preferences of the vector or arbovirus are no longer limiting their spread due to genetic mutations. Mukherjee studied the mosquito’s immune system and its relation to
DENV26 (Dengue Virus), showing that molecular
changes can modify the mosquito preferences. In a study conducted in Indonesia, it was estimated that the direct cost of dengue fever for this country could be estimated at approximately US
$ 381.15 million27 – thus highlighting the economic
impact of such pathology, and emphasizing the importance of conducting measures for effective prevention – more cost-effective. It is well known that investments in treatment are greater than those required for the implementation of
preventive policies – policies that if ineffective or irregularly supervised, could eventually result in exorbitant spending and poor control of Dengue transmission.
6 CONCLUSION
The mapping of Ae. Aegypti outbreaks in the western region of Santa Catarina, showed the temperature as a determining factor in the vector dissemination process, however the presence of large numbers of mosquito breeding sites does not necessarily represent arbovirus infestation – demonstrating a future possibility if control measures are not taken. It can be concluded that in the studied region the precipitation cannot be evaluated as to its influence on the life cycle of the vector, since it presents high rates of rain regularly distributed – demonstrating superiority in the temperature factor in relation to the precipitation. In addition, consideration should be given to other factors that alter mosquito proliferation beyond precipitation – such as inadvertent water storage and inappropriate waste discard, not particularly studied in this manuscript.
CONFLICTS OF INTEREST
The research was conducted with resources from UNIEDU (Programa de Bolsas Universitárias de Santa Catarina) showing no conflicts of interest.
REFERENCES
1. Ministério da Saúde. Dengue – Instruções para Pessoal de Combate ao Vetor: Manual de Normas Técnicas. Assessoria de Comunicação e Educação em Saúde – Ascom/Pre/FUNASA [Internet]. 2001 abr [acesso em 2018 jul 12]. Disponível em: http://bvsms.saude.gov.br/bvs/publicacoes/fu-nasa/man_dengue.pdf
2. World Health Organization. Dengue: Guidelines for Diagnosis, Treatment, Prevention and Control. [Internet]. 2009 [cited 2019 July 2]. Available from: https://www.who.int/tdr/publications/docu-ments/dengue-diagnosis.pdf
3. Tauil PL. Urbanização e Ecologia do Dengue. Cad. Saúde Pública [Internet]. 2001;Supl: [acesso em 2019 jul 2];99-102. Disponível em: https://www.scielosp.org/pdf/csp/2001.v17suppl0/S99-S102/pt 4. Ibanez-Bernal S, Briseño B, Mutebi JP, Argot E, Rodriguez G, Martinez-Campos C, et al. Firstrecord
in America of Aedesalbopictus naturally infected with dengue vírus during the 1995 out break at Reynosa, Mexico. Med Vet Entomol. [Internet]. 1997 [cited 2019 July 2];11:305-9. Available from: https://onlinelibrary.wiley.com/doi/abs/10.1111/j.1365-2915.1997.tb00413.x
5. Ministério da Saúde, Secretaria de Vigilância Epidemiológica. Diretrizes Nacionais para a Prevenção e Controle de Epidemias de Dengue [Internet]. 2009 [acesso em 2018 jul 12]. Disponível em: ht-tp://bvsms.saude.gov.br/bvs/publicacoes/diretrizes_nacionais_prevencao_controle_dengue.pdf 6. Bhatt S, Gething PW, Brady OJ, Messina JP, Farlow AW. The global distribution and burden of
den-gue. Nature [Internet]. 2013 [cited 2019 July 2];496:504-7. Available from: https://www.nature. com/articles/nature12060.pdf
7. Dal Magro L, Bonifácio BH, Barancelli GLS, Schmidt CL, Schabat FM, Lutinski JA. Incidence of Dengue fever in the city of Chapecó, west of Santa Catarina state, Brazil. Periódico Científico do Núcleo de Biociências – NBC [Internet]. 2017 [cited 2019 Oct 2]; 7(14):98-108. Available from: https://www.metodista.br/revistas-izabela/index.php/bio/article/viewFile/1471/890
8. Welter L. O espaço geográfico do oeste catarinense e sua cartografia ambiental [dissertação] [Inter-net]. São Paulo: Universidade de São Paulo; 2006. [acesso em 2018 jul 9]. Disponível em: http:// www.teses.usp.br/teses/disponiveis/8/8136/tde-20062007-145400/pt-br.php
9. Empresa de Pesquisa Agropecuária e Extensão Rural de Santa Catarina. Zoneamento agroecológico e socioeconômico do Estado de Santa Catarina [Internet]. 1999 [acesso em 2018 jul 12]. Disponí-vel em: http://ciram.epagri.sc.gov.br/images/documentos/ZonAgroecoMapas.pdf
10. Google Maps [Internet]. [acesso em 2018 jul 12]. Disponível em: https://www.google.com/maps/ d/u/0/edit?hl=pt-BR&mid=1k-a7rwL5ug90T6azjOW6ukdb6zIinwsG&ll=-27.094203495700633%-2C-52.9206134623862&z=11
11. Instituto Brasileiro de Geografia e Estatística. Classificação e Caracterização dos Espaços Rurais e Urbanos do Brasil – Uma Primeira Aproximação [Internet]. 2017 [acesso em 2019 jul 2];(11). Dis-ponível em: https://biblioteca.ibge.gov.br/visualizacao/livros/liv100643.pdf
12. Diretoria de Vigilância Epidemiológica de Santa Catarina – DIVE/SC. Boletim Epidemiológico – Vigilância entomológica do Aedes aegypti e situação epidemiológica da dengue, febre de chi-kungunya e zika vírus em Santa Catarina [Internet]. 2017 [acesso em 2018 jul 21]. Disponível em: http://www.dive.sc.gov.br/conteudos/boletim2017/boletimDengue26/boletimDengue26.pdf 13. Instituto Oswaldo Cruz. Dengue – Vírus e Vetor [Internet]. [acesso em 2019 fev 26]. Disponível em:
http://www.ioc.fiocruz.br/dengue/
14. Gubler, DJ. Dengue and Dengue Hemorrhagic Fever. Clin. Microbiol. Rev. [Internet]. 1998 [ci-ted 2019 July 2];11(3):480-96. Available from: https://www.ncbi.nlm.nih.gov/pmc/articles/ PMC88892/
15. Koopman SJ, Prevots RD, Mann MAV, Dantes HG, Aquino MLZ, Longini Junior IM, et al. De-terminants and Predictors of Dengue Infection in Mexico. Am. J. Epidemiol. [Internet]. 1991 [cited 2019 July 2];133(11):1168-78. Available from: https://academic.oup.com/aje/arti-cle-abstract/133/11/1168/165838?redirectedFrom=fulltext
16. Tuladhar R, Singh A, Banjara MR, Gautam I, Dhimal M, Varma A, et al. Effect of meteorological factors on the seasonal prevalence of dengue vectors in upland hilly and lowland Terai regions of Nepal. Parasites &Vectors [Internet]. 2019 [cited 2019 Jan 21];12(42). Available from: https://para-sitesandvectors.biomedcentral.com/track/pdf/10.1186/s13071-019-3304-3
17. Costa EAPA, Santos EMM, Correia JC, Albuquerque CMR. Impact of small variations in tempera-ture and humidity on de reproductive activity and survival of Aedesaegypti (Diptera, Culicidae). Rev. Bras. Entomol. [Internet]. 2010 [cited 2019 July 3];54(3):488-93. Available from: http://www. scielo.br/scielo.php?script=sci_arttext&pid=S0085-56262010000300021
18. Stolerman LM, Maia PD, Kutz N. Forecasting dengue fever in Brazil: Anassessmentofclimatecondi-tions. PLoS ONE [Internet]. 2019 [cited 2019 Oct 2];14(8). Available from: https://www.ncbi.nlm. nih.gov/pmc/articles/PMC6687106/
19. Ministério da Saúde. Levantamento Rápido de Índices para Aedes aegypti (LIRAa) para vigilância entomológica do Aedes aegypti no Brasil: Metodologia para avaliação dos índices de Breteau e predial e tipos de recipientes [Internet]. 2013 [acesso em 2018 jul 8]. Disponível em: http://bvs-ms.saude.gov.br/bvs/publicacoes/levantamento_rapido_indices_aedes_aegypti.pdf
20. Ong J, Liu X, Rajarethinam J, Yap G, Ho D, Ng LC. A novel entomological index, Aedesaegypti Bre-eding Percentage, reveals the geographical spread of the dengue vector in Singapore and serves as a spatial risk indicator for dengue. Parasites Vectors [Internet]. 2019 [cited 2019 Jan 21];12(17):1-10. Available from: https://parasitesandvectors.biomedcentral.com/track/pdf/21];12(17):1-10.1186/s13071-018- https://parasitesandvectors.biomedcentral.com/track/pdf/10.1186/s13071-018-3281-y
21. Bezerra J. Densidade Demográfica. Toda Matéria – Conteúdos Escolares [Internet]. 2018 jul [acesso em 2019 fev 26]. Disponível em: https://www.todamateria.com.br/densidade-demografica/ 22. Diretoria de Vigilância Epidemiológica de Santa Catarina – DIVE/ SC. Boletim sobre situação da
dengue, febre de chikungunya e febre do zika vírus em Santa Catarina [Internet]. 2016 [acesso em 2017 jul 21]. Disponível em: http://www.dive.sc.gov.br/index.php/arquivo-noticias/250-boletim- -sobre-situacao-da-dengue-febre-de-chikungunya-e-febre-do-zika-virus-em-santa-catarina-a-tualizado-em-06-01-2016
23. Diretoria de Vigilância Epidemiológica de Santa Catarina – DIVE/SC. Boletim Epidemiológico – Situação da dengue, febre do chicungunya e zika vírus em Santa Catarina [Internet]. 2016 [acesso em 2018 jul 21]. Disponível em: http://www.dive.sc.gov.br/index.php/arquivo-noticias/493-bole-tim-epidemiologico-n-37-2016-situacao-da-dengue-febre-do-chikungunya-e-zika-virus-em- santa-catarina-atualizado-em-05-04-2017-se-01-a-52-2016
24. Diretoria de Vigilância Epidemiológica. Vigilância e Controle do Aedes aegypti: orientações técni-cas para pessoal de campo. Gerência de Vigilância de Zoonoses e Entomologia – GEZOO [Inter-net]. 2007 [acesso em 2018 jul 21]. Disponível em: http://www.dive.sc.gov.br/conteudos/publica-coes/ManualDengue2018.pdf
25. Figueiró AC, Sóter AP, Braga C, Hartz ZMA, Samico I. Análise da lógica de intervenção do Progra-ma Nacional de Controle da Dengue. Rev. Bras. Saúde Mater. Infant. [Internet]. 2010 [acesso em 2019 jul 3];10(1):S93-S106. Disponível em: http://www.scielo.br/scielo.php?script=sci_arttext&pi-d=S1519-38292010000500009
26. Mukherjee D, Das S, Begum F, Mal S, Ray U. The Mosquito Immune System and the Life of Dengue Virus: What We Know and Do Not Know. Pathogens [Internet]. 2019 [cited 2019 July 3];8(77):1-16. Available from: https://www.mdpi.com/2076-0817/8/2/77/htm
27. Nadjib M, Setiawan E, Putri S, Nealon J, Beucher S, Hadinegoro SR, et al. Economic burden of dengue in Indonesia. PLoS Negl Trop Dis. [Internet]. 2019 [cited 2019 Jan 23]; 13(1). Available from: https://journals.plos.org/plosntds/article?id=10.1371/journal.pntd.0007038