Department of Animal Sciences Aquaculture and Fisheries Group Marijkeweg 40, Postbus 338 6700 AH Wageningen The Netherlands Tel: +31 (0) 317 483307 Fax: +31 (0) 317 483937
AQUACULTURE AND FISHERIES GROUP
LEERSTOELGROEP AQUACULTUUR EN
VISSERIJ
Name: Ana Catarina Silva Reg.nr. 861130543130
MSc Thesis nr. T 1831 THESIS October 2010
Effect of salinity and feed sterilization in interactions
between gut and water microbial communities in Nile
Ana Catarina Silva Página 2 Niets uit dit verslag mag worden verveelvoudigd en/of openbaar gemaakt door middel van druk, fotokopie, microfilm of welke andere wijze ook, zonder voorafgaande schriftelijke toestemming van de hoogleraar van de leerstoelgroep Aquacultuur & Visserij van Wageningen Universiteit.
No part of this publication may be reproduced or published in any form or by any means, electronic, mechanical, photocopying, recording or otherwise, without prior written permission of the head of the Aquaculture & Fisheries Group of Wageningen University, The Netherlands.
Ana Catarina Silva Página 3
Effect of salinity and feed sterilization in
interactions between gut and water microbial
communities in Nile tilapia (Oreochromis
niloticus) larvae
ANA CATARINA MARCELINO COSTA SILVA
October 2010 Promotor: Johan Verreth
Supervisors: Marc Verdegem Christos Giatsis
Ana Catarina Silva Página 4 Silva, A.C.
Effect of salinity and feed sterilization in interactions between gut and water microbial communities in Nile tilapia (Oreochromis niloticus) larvae
Ana Catarina Silva Página 5
To my wonderful family,
To my niece, Matilde
Ana Catarina Silva Página 6
TABLE OF CONTAINTS
List of Figures: ... 8 List of Tables ... 9 Abstract ... 11 Resumo ... 12 1. Introduction ... 14 2. Literature Review ... 162.1 Active Suspension System (AST) ... 16
2.1.1 Principle ... 16
2.1.2 AST and Microbial Control ... 17
2.1.3 AST Limitations ... 18
2.2 Importance of Tilapia Culture in Aquaculture ... 18
2.3 Tilapia: A General Overview ... 19
2.3.1 Taxonomy and Distribution ... 19
2.3.2 Feeding Relationships ... 20
2.3.3 Larvae History ... 21
2.4 Environment Factors ... 21
2.4.1 Salinity ... 22
2.5 Fish Performance Parameters ... 24
2.5.1 Growth ... 24
2.5.2 Growth and Salinity ... 24
2.6 Feed Sterilization ... 25
2.7 Microbial Diversity ... 25
2.7.1 The Larval Microbiota ... 25
2.7.2 Gut Colonization ... 26
2.7.3 Gut Microbial Communities vs Feed and Water Quality ... 27
2.7.4 Gut Microbial Communities Diversity vs Salinity ... 28
2.7.5 Microbiota Manipulation in Aquaculture – Probiotics ... 29
2.8 Molecular Methods Describing Microbial Diversity ... 30
3. Study aims and Hypothesis ... 32
3.1 Main Objective ... 32
3.2 Research Questions and Hypothesis ... 32
4. Material and Methods ... 33
4.1 General Overview of the Experiment ... 33
4.2 Pre-Experimental Period ... 33
4.2.1 Water Quality: ... 34
4.3 Experimental Animals: Tilapia Larvae ... 35
4.4 Experimental Period ... 35
4.4.1 Accommodation ... 35
4.4.2 Environmental Conditions: ... 36
4.4.3 Feeding Method and Regime: ... 37
4.4.4 Sampling Days ... 38
4.5 Sampling and Storage ... 38
4.5.1 Feed Sampling and Storage ... 38
4.5.2 Water Sampling and Storage ... 38
Ana Catarina Silva Página 7
4.6 Samples Analysis ... 39
4.6.1 DNA Extraction ... 39
4.6.2 Polymerase Chain Reaction (PCR) ... 39
4.6.3 Denaturing Gradient Gel Electrophoresis (DGGE) ... 40
4.7 Calculations ... 40 4.7.1 Growth: ... 40 4.7.2 Feed: ... 41 4.7.3 Growth Efficiency: ... 41 4.8 Statistical Analysis ... 41 5. Results ... 42 5.1 Water Quality ... 42 5.2 Growth Parameters ... 45 5.3 Proximate Analysis ... 46 Factor ... 46 5.4 Microbial Communities ... 47
5.4.1 Microbial Communities in the gut: ... 47
5.4.2 Microbial Communities in Water ... 49
5.4.3. Relation Between Gut and Water Over time ... 50
5.4.4 Relation Between Gut and Feed Over time ... 51
5.4.5 Relation Between Water with Feed Over time ... 52
6. Discussion ... 53
6.1 Microbial Communities in Fish Gut ... 53
6.1.1 Gut Over time ... 53
6.1.2 Effect of Salinity ... 53
6.1.3 Effect of Feed Sterilization ... 56
6.2 Growth ... 57
6.2.1 Effect of Salinity ... 57
6.2.2 Effect of Feed Sterilization ... 58
7. Conclusions ... 60
References ... 62
Ana Catarina Silva Página 8
List of Figures:
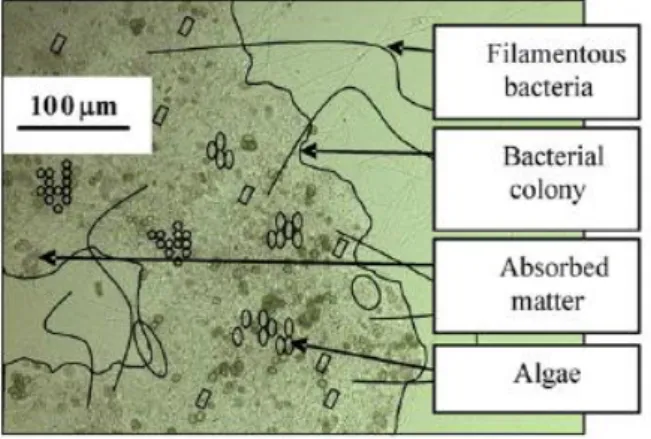
Figure 1- Floc structure within a ASP system and its composition.
Figure 2- Percentage of Nile tilapia production of the total Cichlids group between 1950 and
2008.
Figure 3- World production of Nile tilapia over time.
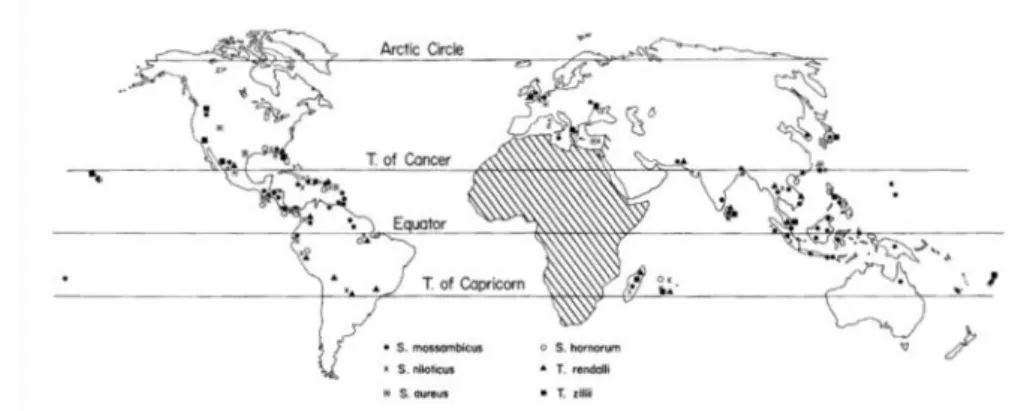
Figure 4- Introduction of tilapia (6 species) outside of Africa. Figure 5- Mozambique Tilapia (a); Nile Tilapia (b).
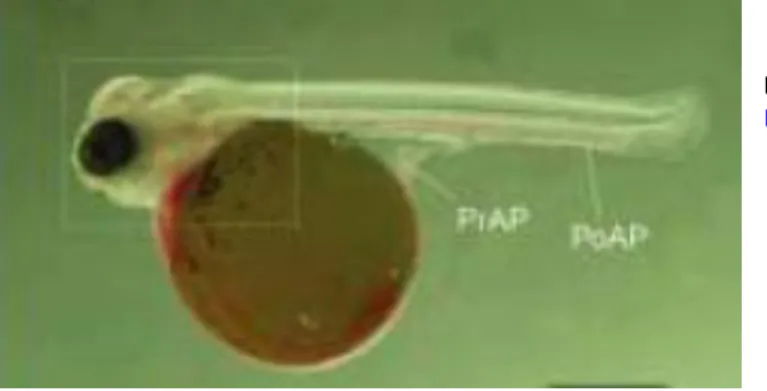
Figure 6- Newly hatched Nile tilapia larvae.
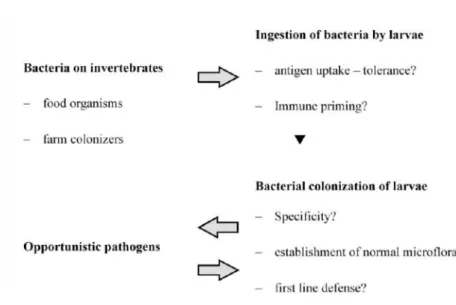
Figure 7- Steps and interactions between bacteria colonization and fish larvae.
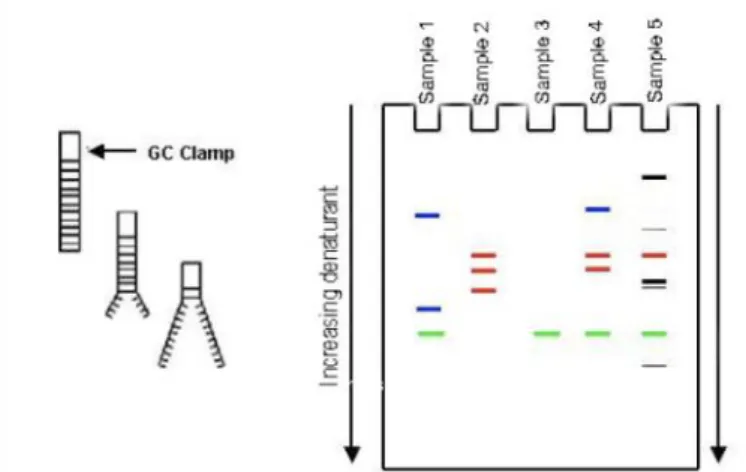
Figure 8 - The principle of denaturing gradient gel electrophoresis (DGGE).
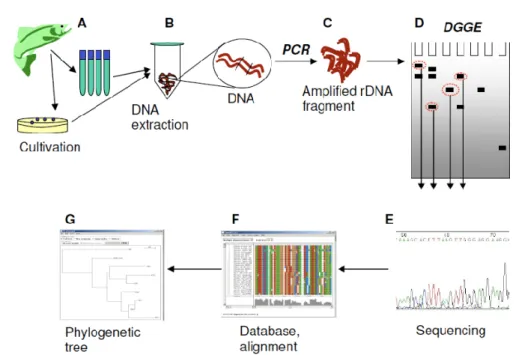
Figure 9 - Flow sheet of the process form fish sampling to bacterial detection and identification.
Samples from the fish are taken directly for DNA extraction (A). In B, bacterial DNA is extracted using standard procedures, or kits, before the DNA is amplified using PCR (C). The PCR products are separated on a denaturing gradient gel (D), and bands of interest are excided and sequenced (E). For further comparison of the bands, the sequences can be aligned in suitable programs, such as ClustalX (F), and a phylogenetic tree can be made to display similarities graphically (G).
Figure 10- System design. Six tanks running with fresh water (top system). Six tanks running with salt
water, 25 ppt, (bottom system). The arrows indicate the water flow from the pump (blue circle) in the bottom tank until the fish tank (top) and vice-versa.
Figure 11- Similarities inside and outside systems, based on Pearson correlation similarity values
Means followed with different subscript letter/number are statistically different (p<0.05). a. Fresh water non-sterile feed system (FN); b. Fresh water sterile feed system (FS); c. Salt water non-sterile feed system (SN); d. Salt water sterile feed system (SS).
Figure 12- DGGE profiles of water in 3 tanks per systems over time, based on Pearson correlation
matrixes. a. Fresh water non-sterile feed system (FN); b. Fresh water sterile feed system (FS); c. Salt water non-sterile feed system(SN); d. Salt water sterile feed system (SS).
Ana Catarina Silva Página 9
List of Tables
Table I - World Aquaculture major production (in tons) of fresh water fish. Table II- Optimal environmental conditions for Nile Tilapia culture.
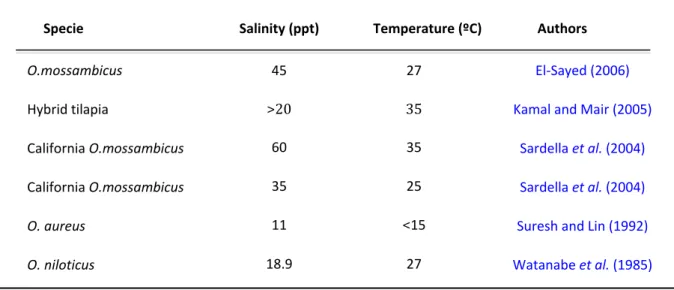
Table III- Comparison of various salinity tolerance levels in some tilapia species.
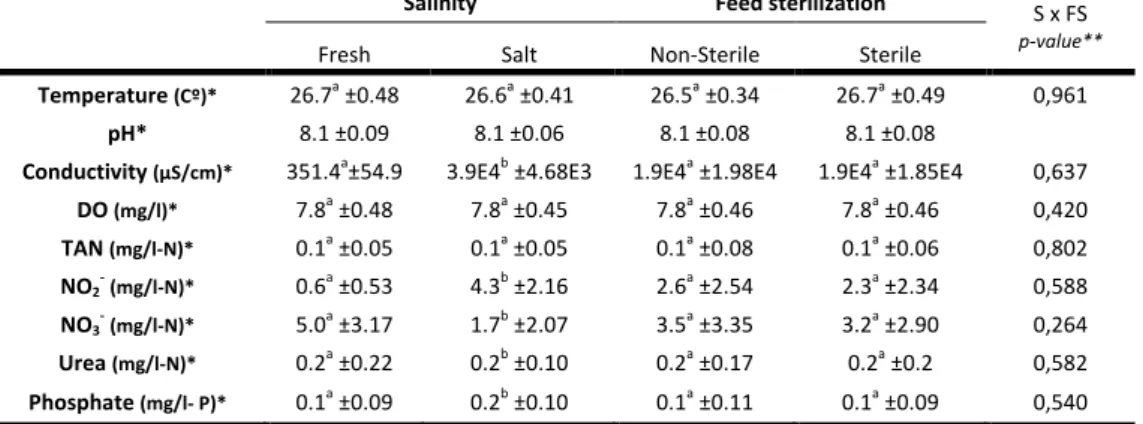
Table IV- Values of water parameters, Temperature, pH, dissolved oxygen (DO), total amount of
nitrogen (TAN-N), nitrite (NO2--N), nitrate (NO3--N), urea-N and phosphate, during the
experimental period in the treatment salinity (S) and feed sterilization (FS).
Table V- Calculated means of water parameters, Temperature, pH, dissolved oxygen (DO), total
amount of nitrogen (TAN-N), nitrite (NO2--N), nitrate (NO3--N), urea-N and phosphate, during the
six experimental weeks
Table VI- Measured values of inorganic carbon (IC), non-purgeable organic carbon (NPOC), total
carbon (TC), total ammonia nitrogen (TAN-N), nitrite (NO2--N) + nitrate (NO3--N), total nitrogen
(TN) and Carbon Nitrogen ratio in three different weeks in the two treatments: Salinity (fresh and salt) and feed sterilization (non-sterile feed and sterile feed).
Table VII- Calculated means for fish performance, feed intake, metabolic ration (Rm), feed
conversion ratio (FCR) and metabolic growth ratio (MGR) in each treatment (salinity (S) and feed sterilization (FS)).
Table VIII- Calculated means for fish performance: feed intake, metabolic ration (Rm), feed
conversion ratio (FCR) and metabolic growth ratio (MGR) for the four growth periods
Table IX- Values of dry matter content (DM), ash, crude protein, energy and fat in fish larvae
from the different treatments: Salinity (S) and feed sterilization (FS).
Table X Values of dry matter content, ash, crude protein, energy and fat in non-sterile feed and
sterile feed
Table XI-Calculated means of Pearson correlation similarities of fish gut overtime in the
treatments salinity (fresh and salt water) and feed sterilization (non-sterile and sterile feed). Each mean represents the average of gut similarity in the different treatments per different sampling days
Table XII- Calculated means of Pearson correlation similarities, between fish gut and water
system over time in the different treatments: salinity (fresh and salt water) and feed sterilization (non-sterile and sterile feed). Each mean represents the average of gut similarity with water system in the different treatments per different sampling days
Table XIII- Calculated means of Pearson correlation similarities, between fish gut and feed
overtime in the different treatments: salinity (fresh and salt water) and feed sterilization (non-sterile and (non-sterile feed). Each mean represents the average of gut similarity with feed in the different treatments per different sampling days
Ana Catarina Silva Página 10
Table XIV- Calculated means of Pearson correlation similarities, between system water and feed
overtime in the different treatments: salinity (fresh and salt water) and feed sterilization (non-sterile and (non-sterile feed). Each mean represents the average of water system similarity with feed in the different treatments per different sampling days.
Ana Catarina Silva Página 11
Abstract
Some tilapia species, including Oreochromis niloticus, are good candidates for brackish water culture due to salinity tolerance and good growth performances. In this report, the effect of salinity on the bacterial dominance in fish gut, as well as their relation with water and feed microbial communities, were tested. The effect of a regular diet versus a sterile diet on the microbial community composition in the fish gut was also evaluated. This resulted in 4 treatments, randomly assigned to 12 aquaria active suspension systems. The experiment was had the duration of 42 days, from the moment of first feeding. The effects of these two factors (salinity (fresh water and salt water) and feed sterilization (non-sterile feed and sterile feed)) on the microbial composition in water and fish guts were evaluated in a 2x2 factorial design. Ten fish guts per aquaria and 1 water sample per aquarium were sampled on days 0, 7, 14, 28 and 42. Bacterial DNA was extracted and amplified by Polymerase Chain Reaction. Bacterial DNA profiles were obtained through Denaturing Gradient Gel Electrophoresis. All the samples were clustered based on band position and intensity (Pearson correlation) and the similarity values among sample profiles were obtained. The gut microbial communities were different between fishes from fresh and salt water systems on day 7 (88.2±9.52% vs 63.7±28.14%) and 28 (76.9±8.28% vs 70.2±17.58%). A significant increase of similarity between system water bacterial communities and fish gut over the different sampling days was observed. Feed also had a significant increase of similarity with fish gut over time, starting with 0.4±10.2% for fresh water and 3.5±2.94% for salt water, and ending with a significantly higher value of 21.7±11.09% for fresh water and 30.4±14.12% for salt water. On the other hand, feed sterilization presented significant differences in all sampling days between fresh and saltwater bacteria populations. However, gut microbiota from fish fed with sterile feed suffered less the effect of water and feed than the fish fed with regular feed. Clearly, this study is a starting point for the complete understanding of how microbial communities are established and what the goals of future research should be.
Keywords: Microbial communities; Tilapia; Oreochromis niloticus; Salinity; Feed
Ana Catarina Silva Página 12
Resumo
Algumas espécies de Tilápia, como Oreochromis niloticus, são consideradas boas candidatas à cultura em água salobra devido à sua tolerância à salinidade e às suas boas performances de crescimento. Neste relatório, foi testado o efeito da salinidade na dominância bacteriana no intestino de peixe, assim como a sua relação com as comunidades microbiológicas presentes na água e no alimento. O efeito de uma dieta livre de bactérias foi comparado ao de uma dieta regular, com objectivo de verificar a influência da esterilização do alimento nas populações bacterianas no intestino. Para atingir o objectivo principal, foi montado um conjunto de doze tanques de active suspension. A experiência teve a duração de 42 dias. Puderam ser distintos dois factores, salinidade (água doce e salgada) e esterilização de alimento (alimento não-estéril e alimento estéril). Foi amostrada água por aquário, assim como 10 intestinos de peixe por aquário em 5 pontos de amostragem distintos (dia 0, 7, 14, 28 e 42). O DNA bacteriano foi extraído e amplificado por Polymerase Chain Reaction. Os perfis de DNA bacteriano foram obtidos por Denaturing Gradient Gel Electrophoresis. Todas as amostras foram agrupadas com base na intensidade de banda (Pearson correlation) e assim os valores de similaridade entre estes perfis foram obtidos. A dominância bacteriana no intestino de peixe de água doce e salgada é significativamente diferente no ponto de amostragem 7 (88.2±9.52% vs 63.7±28.14%) e 28 (76.9±8.28% vs 70.2±17.58%). Observou-se um aumento significativo de similaridade entre as comunidades bacterianas da água do sistema e os intestinos de peixe, ao longo dos diferentes pontos de amostragem. O alimento também teve um aumento significativo de similaridade com o intestino de peixe ao longo do tempo, começando com 0.4±10.2% para a água doce e 3.5±2.94% para água salgada e acabando com um valor significativamente alto 21.7±11.09% para água doce e 30.4±14.12% para água salgada. Por outro lado, a esterilização de alimento apresentou diferenças significativas em todos os pontos de amostragem, entre populações bacterianas de água doce e salgada. No entanto, a microflora dos peixes alimentados com alimento estéril sofreu um efeito da água reduzido, quando comparado com os peixes alimentados com alimento regular. Claramente, este estudo revela-se um ponto de partida para o conhecimento completo de como as
Ana Catarina Silva Página 13 comunidade bacterianas são estabelecidas e quais serão os objectivos para futuras investigações.
Palavras-chave: Comunidades microbiológicas; Tilápia; Oreochromis niloticus;
Ana Catarina Silva Página 14
1. Introduction
Gut microbial communities in animals are considered a complex and diverse system with importance in animal nutrition, physiology and pathology (Rastall, 2004). The research of microbial communities in gut started with the discovery of
Escherichia coli in the human gut, and consequently this finding lead to more
research and to the discovery of microbial communities in other groups of animals, such as in fish (Rastall, 2004).
A wide range of microorganisms colonizes the intestinal tract, coming from the surrounding environment (e.g water), sediment and feed (Ringø et al., 1995; Grisez et al., 1997; Ringø and Gatesoupe, 1998, Nayak, 2010). The major group of bacteria that colonize the gut are aerobic, facultative anaerobic and obligatory anaerobic bacteria (Sugita, 1991).
Gut microbiota of freshwater and saltwater organisms are distinct, an aspect related to the differential functioning of the intestine in these two environments
(Ringø and Gatesoupe, 1998). While Aeromonas spp., Pseudomonas spp., and
members of the Flavobacterium family are the most common group of microorganisms in the gut of freshwater fish, Vibrio, Acinetobacter and
Enterobacteriaceae are the most common bacteria in marine fish (Ringø et al., 1995). During the last decades much work has been done to identify and characterize the microbial communities in the gastrointestinal tract in different fish species (Limsuwan and Lovel, 1981; Ringø et al., 1995; Grisez et al., 1997; Ringø and Gatesoupe, 1998; Spanggaard et al., 2000; Ringø et al., 2003; Al-Harbi and Uddin, 2005; Hovda et al., 2007); nevertheless, these studies focused on the relations between bacteria and environmental conditions, (Limsuwan and Lovel, 1981; Sugita, 1991; Ringø et al., 1995; Grisez et al., 1997; Ringø and Gatesoupe, 1998; Olafsen, 2001; Reitan et al., 2001;) nutrition studies, (Moriaty, 1999; Al-Harbi and Uddin,
2005) improvement of systems such as active suspension ponds with microbial
manipulation (Avnimelech, 2003, 2006, 2007; Avnimelech et al., 2008; Azim and Little, 2008; Schryver et al., 2008) and promotion of beneficial bacteria (probiotics) as a substitute of antibiotics (Gatesoupe, 1999; Moriaty, 1999; Olafsen, 2001).
Ana Catarina Silva Página 15 The presence of gut microbiota in fish has long been recognized, but less is known about the stabilization and diversity of these communities and their role in fish health (Nayak, 2010).
The genus Tilapia belongs to the successful Cychlidae family (Nelson, 2006). These fish are the second most farmed species in the word, only surpassed by carps
(Merrifiel et al., 2010).
The availability of freshwater is a major bottleneck to future fish production; subsequently, there has been an increase in competition for this resource between agricultural and urban activities (Verdegem et al., 2009).Aquaculture industries have been forced to develop culture systems in brackish and seawater (Watanabe et al., 1985 (b); Watanabe et al., 1985 (a); El-Sayed et al., 2005; El-Sayed, 2006; Rengmark and Lingaas, 2007). Tilapia was the first candidate for brackish water aquaculture, due to the low investment required when compared to other species such as turbot, sea bass and sea bream (Al-Harbi and Uddin, 2005; Rengmark et al., 2007).
The main objective of this experiment is to compare the composition of the gut microbial communities of tilapia raised at different salinities and feed sterilized or non-sterilized feed.
Ana Catarina Silva Página 16
2. Literature Review
2.1 Active Suspension System (AST)
During the last decades, much work has been done to improve the efficiency in water treatment, energy consumption and oxygen uptake in aquaculture systems. One example of merging water treatment with feed recycling in intensive ponds is the active suspension pond, ASP, also called Bio floc technology (BFT) (Avnimelech, 2006; Avnimelech, 2007). For that reason, in recent years, active suspension intensive ponds have been developed, as a mean to produce fish or shrimp at high densities (Milstein et al., 2001; Avnimelech, 2007).
2.1.1 Principle
The basic principle of the active suspension technology (AST) is the retention of waste and its conversion to Biofloc as natural food within the culture system. This is achieved through constant aeration and agitation of the water column to keep particles suspended, while maintaining a low water exchange rate (to about 10% per day).Theaddition of carbon sources as organic matter substrate, raise the C:N ratio, which favors microbial floc formation (Milstein et al., 2001; Avnimelech, 2006; Avnimelech et al., 2008; Azim and Little, 2008; Schryver et al., 2008; Crab et al., 2009). This floating floc (Figure 1), capable of reaching more than 1000µm in size
(Schryver et al., 2008), consists of phytoplankton, bacteria, aggregates of living and dead particulate organic matter, as well as grazers (Avnimelech, 1999). If carbon and nitrogen are well balanced, nitrogen will be immobilized into bacterial protein
biomass (Avnimelech, 1999).
Figure 1- Floc structure within a ASP system and its composition (Schryver et al., 2008).
Ana Catarina Silva Página 17 2.1.2 AST and Microbial Control
Controlling aquaculture systems, like ASP, through manipulation of microbial activity, has become an important and regularly discussed technology arising from the efforts of improving intensive aquaculture (Avnimelech, 2003).
Microbial communities found in ASP contain algae, blue-green algae, bacteria, protists, zooplankton and fungi implanted in an extracellular polysaccharide matrix that develops in submerged surfaces (Avnimelech, 2007). Inside these communities, autotrophic or heterotrophic biomass dominate, depending on light, dissolved oxygen, and nutrient availability (Avnimelech et al., 2008).
One serious problem in intensive ponds culture is the nitrogen disorder. Inorganic nitrogen accumulates in the pond for various reasons. For example, fish metabolize proteins as an energy source and feed residues have a long hydraulic retention in ASP (Avnimelech, 2006).
Proper manipulation of the microbial biomass enables the control of water quality, mostly through the conversion of the potentially toxic inorganic nitrogen forms to microbial protein. In turn, microbial protein may be utilized as a source of feed for the fish (Avnimelech, 2003; Avnimelech, 2006; Azim and Little, 2008; Schryver et al., 2008). The major driving force is the intensive growth of heterotrophic bacteria that is dependent of the C/N ratio. They consume organic carbon (1.0 g of carbohydrate-C yields about 0.4 g of bacterial cell dry weight-C) and, depending on the bacterial C/N-ratio, they can also immobilize mineral nitrogen
(Schryver et al., 2008). Avnimelech (1999) calculated a carbohydrate requirement of 20 g to immobilize 1.0 g of NH4-N, based on a microbial C:N-ratio of 4 and 50% C in
dry carbohydrate. A proper C:N, as >10:1, is optimal for the biofloc production while regeneration of NH4+ is minimized (Avnimelech, 2006).
In conclusion, microbially managed ponds provide stable control over the processes occurring in the ponds. This technology does not depend on light intensity and is not sensitive to population crashes. Also, microbial control leads to efficient degradation of waste materials, efficient nitrification and, through the manipulation
Ana Catarina Silva Página 18 of C:N ratio, assists the control and recycling of nitrogen, thus doubling protein utilization.
2.1.3 AST Limitations
There are some limitations in the use of AST. Excessive turbidity may, however, have a negative effect on different fish species. Although for tilapia turbidity is not a problem, (Avnimelech 2006) it is not certain that all cultured fish species will easily adapt to growing in turbid water. Another problem is that above fish or shrimp densities of 10-20 kg m-3 the system becomes unstable.
2.2 Importance of Tilapia Culture in Aquaculture
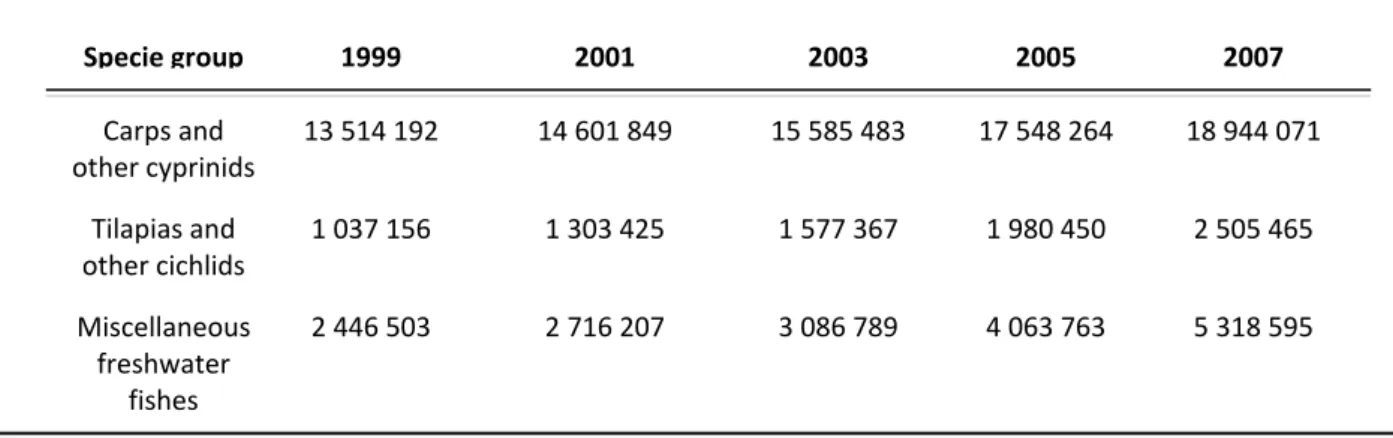
Tilapia is one of the most farmed species in the world, (Merrifiel et al., 2010), with cultures occurring in more than 100 countries (El-Sayed et al., 2005). World production of cultured tilapia has increased from 28.260 metric tons in 1970 to 2.5 million metric tons in 2007 (Table I)(FAO, 2009).
Table I - World Aquaculture major production (in tons) of fresh water fish. (Adapted from FAO, 2009)
Characteristics such as fast growth, tolerance to a wide range of environmental conditions, resistance to stress and diseases, ability to reproduce in captivity, short generation time, feeding at low trophic levels and acceptance of artificial feeds immediately after yolk-absorption make tilapia an ideal candidate for aquaculture, particularly in developing countries (El-Sayed, 2006).
Specie group 1999 2001 2003 2005 2007 Carps and other cyprinids 13 514 192 14 601 849 15 585 483 17 548 264 18 944 071 Tilapias and other cichlids 1 037 156 1 303 425 1 577 367 1 980 450 2 505 465 Miscellaneous freshwater fishes 2 446 503 2 716 207 3 086 789 4 063 763 5 318 595
Ana Catarina Silva Página 19 All tilapia species, including red tilapia, are cultured worldwide in tanks, ponds or cages (El-Sayed, 2006; He et al., 2009), but O. niloticus is the most cultured species in this family (Figure 2 & 3) (Nelson, 2006).
2.3 Tilapia: A General Overview
2.3.1 Taxonomy and Distribution
Tilapia belongs to the Cichlidae family, representing a large number of freshwater species and considered the most successful fish family among teleosts (Nelson, 2006). Native to Africa (excluding Madagascar) and Palestine (Trewavas, 1982; Nelson, 2006), during the second half of the 20th century they were introduced (Figure 4) into several environments in tropical, subtropical and temperate regions
(Pillary, 1990). 79% 21%
Nile Tilapia Other tilapia and cichlids species 0 500.000 1.000.000 1.500.000 2.000.000 2.500.000 3.000.000 1950 1960 1970 1980 1990 2000 2002 2004 2006 2008 Produ ction (t) Time (years) Tilapia and cichlids Nile Tilapia
Figure 2- Percentage of Nile tilapia production of the total Cichlids group between 1950 and 2008. (Adapted from
FAO, 2010) Figure 3- Word production of Nile tilapia
over time. (Adapted from FAO, 2010)
Ana Catarina Silva Página 20 Due to the similarity among species (Figure 5) and overlapping of their morphological characteristics, taxonomic classification of tilapia is still confusing and a subject of discussion (El-Sayed, 2006; Nelson, 2006). Another confounding factor results from the free hybridization of these species in the natural environment (El-Sayed, 2006).
Figure 5- Mozambique Tilapia (a); Nile Tilapia (b). (FAO, 2010)
The development of hybrids like the red tilapia between stocks of
Oreochromis niloticus and Oreochromis mossambicus, has the potential to combine
the higher growth potential of the former with the salinity tolerance of the latter, therefore representing a potential commercial application for hybridisation in brackish water aquaculture (Kamal and Mair, 2005) that is of great interest to fish farmers.
2.3.2 Feeding Relationships
Tilapias are herbivorous/omnivorous fish with adaptable feeding habits
(Fujimura and Okada, 2007) able to feed at a low level in the aquatic food chain
(Philippart and Ruwet, 1982; El-Sayed, 2006). During larval stages, tilapia feed on zooplankton, especially crustaceans (copepods), while older stages feed on aquatic vegetation, phytoplankton, zooplankton, periplankton and detritus from plants
(El-Sayed, 2006). The morphology of the feeding apparatus, including jaw and teeth, is
amazingly diverse and therefore suitable for adaptation to their feeding behaviour
(Fujimura and Okada, 2007).
b a
Ana Catarina Silva Página 21 2.3.3 Larvae History
Tilapia larvae can have various sizes according to the size of the egg that is related to the amount of yolk stored. The yolk sac is spherical and reasonably large for warm water fish such as Nile tilapia (Figure 6). At hatching, pigmented eyes and some chromatophores on the surface of the yolk sac are visible.
Floatability control is achieved through the absorption of the yolk sac 8-12 days post hatch (dph) and the development of the swimming bladder. The mouth becomes visible 4-5 dph but feeding behaviour can be observed between 8 to 10 dph
(Shelton and Popma, 2006).
Tilapia larvae can have several sizes, but usually cultured tilapia has similar sizes to those of natural populations. Size is about 5 mm for newly hatched and 8 mm for 12 dph individuals (Shelton and Popma, 2006).
2.4 Environment Factors
Tilapia is more tolerant than most commonly cultured fish to various “adverse” environmental factors such as salinity, high ammonia levels and water temperature and low dissolved oxygen (Shelton and Popma, 2006). The optimal environmental parameters for tilapia culture, described in Shelton and Popma,
(2006) can be checked in Table II. Salinity tolerance and its effects on this group of fish will be analysed in more detail in sub-chapter 2.4.1.
Figure 6- Newly hatched Nile tilapia larvae (Adapted from Fujimura and Okada, 2007)
Ana Catarina Silva Página 22 Table II- Optimal environmental conditions for Nile tilapia culture (Adapted from Shelton andPopma, 2006)
2.4.1 Salinity
Tilapias are euryhaline fish that can live and prosper in a large range of salinities, from freshwater to seawater, although some species tolerate a wider range of salinity when compared to others (Philippart and Ruwet, 1982). For instance, Nile tilapia can tolerate salinities up to 18 ppt, while Mozambique tilapia grows and reproduces in environments with salinities above 30 ppt (Chervinski, 1982(a), Watanabe et al., 1985 (a).
For aquatic organisms like tilapia, salinity is considered one of the major environmental parameters exerting selective pressure. This fact can be illustrated observing the effect of salinity on tolerance to environmental parameters for different stages (Varsamos et al., 2005). According to Breves et al. (2010), salinity tolerance in tilapia species is related to divergence in their native geographical distribution. For instance, the continental O. niloticus is less tolerant to high salinity than the coastal O. mossambicus. Nevertheless, the major factor that regulates the salinity tolerance is the ability of fish to osmoregulate, which starts in early embryonic stages and is related to the presence and ion pumping activity of numerous integumental ionocytes: fish that adopt hypo-osmotic conditions face a permanent osmotic gain of water. Fish exposed to hyper-osmotic conditions face dehydration they release divalent and monovalent ions through kidneys and intestinal and brachial via respectively (Varsamos et al., 2005).
Parameter Level Temperature Salinity pH DO 29ºC- 31ºC <10 ppt 7-8 >5 mg.l-1 NH3 -NH4+ NO2 -<0.14 mg.l-1 <1.5 mg.l-1 <0.5 mg.l-1
Ana Catarina Silva Página 23
Table III compares different levels of salinity for different species of tilapia
described by several authors. Chervinski (1982 (a)) demonstrated that, even though some species of tilapia tolerate high salinities but may not survive abrupt changes to it, they will respond well to gradual changes in salinity. On the other hand, it was verified that “California” O. mossambicus would successfully endure an abrupt change in salinity from 35 ppt to 60 ppt at 25ºC and 35ºC (Sardella et al., 2004).
Research has also shown that salinity tolerance in fish is influenced by genetic factors, size, sex and several environmental factors, with particular emphasis on temperature (Suresh and Lin, 1992; Likongwe et al., 1996; El-Sayed, 2006). Sardella
et al. (2004) observed high survivability with both high salinity and temperature, which contrasted with increased mortality at low temperature (15ºC) and high salinity (35-60 ppt), leading to the conclusion that temperature and salinity act interdependently to have an effect on fish. Nevertheless, in a review by Suresh and Lin (1992) a high rate of survival to high salinities (for a fresh water fish) was attributed to low temperatures as some tilapia species exhibited better survivability at 11.5 ppt and low temperature (<15ºC). These different results, demonstrate that there is still work to do to find a common conclusion about this topic.
Table III- Comparison of various salinity tolerance levels in some tilapia species.
Several studies have revealed that salinity seems to affect reproduction in tilapia by seriously compromising female spawning (Watanabe and Kuo, 1985;
Watanabe et al., 1985 (b); Likongwe et al., 1996; Shelton and Popma, 2006). In these
Specie Salinity (ppt) Temperature (ºC) Authors
O.mossambicus Hybrid tilapia California O.mossambicus California O.mossambicus O. aureus O. niloticus 45 >20 60 35 11 18.9 27 35 35 25 <15 27 El-Sayed (2006) Kamal and Mair (2005)
Sardella et al. (2004) Sardella et al. (2004) Suresh and Lin (1992) Watanabe et al. (1985)
Ana Catarina Silva Página 24 same studies it is also mentioned that eggs or larvae acclimatized to increased salinity are more tolerance and have consequently more chance of surviving to the same or higher salinities in later stages of development. It is however worth noting that, despite the increase in survival rate, growth and reproduction remain below the values observed in fresh water.
2.5 Fish Performance Parameters
2.5.1 Growth
Growth is a straightforward concept to understand, as it can be easily determined by weighing or measuring fish (Sumpter, 1992). At cellular level, growth can be described as the deposition of mainly proteins and lipids (Van Weerd and
Komen, 1998). Growth hormone (GH) plays a major role in growth regulation, which
is under endocrine control (Bonga, 1997). Cortisol and catecholamines are key factors in the inhibition of somatic growth by stimulating energy consumption, gluconeogenis and lipolysis (Bonga, 1997).
Many factors can affect growth. Among these are included temperature, pH, salinity, pollutants and handling (Sumpter, 1992; Bonga, 1997). The reduction of growth under stress is linked with the relocation of metabolic energy from growth to other activities that require more energy to restore homeostasis (Bonga, 1997). 2.5.2 Growth and Salinity
Growth is significantly affected by salinity. Likongne et al. (1996) tested four different levels of salinity (0, 8, 12 and 16 ppt) and temperature (24, 28, 30 and 32ºC) in Mozambique tilapia. For the same temperature, different values of salinity were compared. Levels of salinity above the 8 ppt negatively affected growth. The effect of a stressor like salinity in fresh water fish destabilizes the osmoregulatory mechanisms. It increases the energy budget to ionic regulation (to keep homeostasis), which consequently affects growth (Likongne et al. 1996).The effects of salinity on growth can be changed by the ions concentrations, Ca2+and Mg 2+, as by the non-osmoregulatory (e.g behavior) effects on metabolism (Watanabe et al. 1993).
Ana Catarina Silva Página 25
2.6 Feed Sterilization
The use of gamma irradiation as a method of sterilizing feed is considered to be effective. This technique extends the storage life of certain feeds by controlling the microbial and parasitic activity (Ogbato, 1988). One important factor that must be taken into consideration is the penetrability of radiation into the feed. Thus, for sterilized feed, all parts of it must absorb sufficient radiation to kill all present spoilage microorganisms. Penetration of gamma rays is a function of their energy levels. The maximum energy limit of 5 MeV for these rays provides adequate penetration for practical applications. The maximum of 10 MeV for electrons, however, restricts applications tofeeds less than 5 cm thick (Urbain, 1978).
For gamma ray sources,two radionuclides have been used in food irradiation: Cobalt- 60 (60Co) or Cesium- 137 (137Cs) (Urbain, 1984; Farkas, 1994).
The problems of food irradiation lies in changing smell and flavor of the products as well as the destruction of vitamin E, a natural antioxidant of lipids
(Urbain, 1984; Farkas, 1994; Armstrong et al., 1994).
2.7 Microbial Diversity
For some time now, researchers have been characterizing the existing differences in microbial composition through various environments. The knowledge about bacterial diversity is useful for understanding the nature of the sample being studied. Important questions were and still are raised when studying bacterial flora of environmental samples; e.g. in which way do bacterial communities respond to environmental changes? How does the microbiota interact and depend on the species? (Hovda, 2007)
2.7.1 The Larval Microbiota
Unlike fresh water fish, marine fish starts drinking water before the complete absorption of the yolk sac, so the bacterium enters in the digestive tract before the first feeding. This behavior can also be seen in more advanced larval stages, where
Ana Catarina Silva Página 26 bacteria are ingested through grazing of suspended particles and eggs debris
(Olafsen 2001).As a consequence, the microbiota of eggs and other organisms in the
system will affect the primary microbiota of fish larvae (Hansen and Olafsen, 1999). Studies done in Atlantic halibut, concluded that mucus change from a predominantly neutral mixture to a more sulphated one, shifts the adhesion sites for bacteria during larval development, having implications in the changes of microbiota during larval stages (Olafsen 2001). Intestinal mucosa contains specific intestinal microbiota consisting of aerobic, facultative anaerobic and obligatory anaerobic bacteria. The composition may change with age, environmental conditions and nutritional status
(Sugita et al., 1991). 2.7.2 Gut Colonization
As the intestine of fish larvae is virtually sterile, the bacteria present in the water and initial feed are the first gut colonizers (Ringø et al., 1995; Grisez et al.,
1997; Ringø and Gatesoupe, 1998). For this reason, gut environment can be
influenced during the hatching process by the water in the incubators, which often contains a heavy bacterial load. In marine species, the drinking behavior may also contribute towards bacteria ingestion (Ringø et al., 1995).
According to Ringø et al., (2003) there are several factors that can influence Figure 7- Steps and interactions between bacteria colonization and fish larvae (Adapted from Olafsen, 2001).
Ana Catarina Silva Página 27 adhesion and colonization of the microbiota in the digestive tract (Figure 7). These include: (a) peristalsis, (b) bile salts, (c) gastric acidity, (d) immune response, (e) digestive enzymes and (f) indigenous bacteria and the antibacterial compounds which they produce. These microbiota can be classified as autochthonous/indigenous (term used in endothermic animals to classify “normal” flora) or as allochthonous/ transient (incidental visitors of the gastrointestinal tract that are rejected after some time) (Ringø et al., 1995).
There are two phases of bacteria colonization in several marine species, such as turbot, Scophthalmus maximus, described by Ringø et al. (1995). Approximately 5x10² CFU. larvae-1 are established at day 1 after hatching, before introduction of live feed, corresponding to the first level of colonization. The second level is achieved between days 5 and 16 after hatching, with approximately 5 x l04 CFU. Larvae-1. According to the same author, the increase in bacterial load and the differences in the intestinal microbiota during the first few days after hatching may be due to better capacity of bacteria to attach into the larval gut, as a result of the histological and functional development of larvae.
After colonization of the gut, bacteria present in the intestine of fish may either be beneficial in nutritional terms or in the prevention of colonization by pathogenic bacteria, may have no significant effect (neither beneficial nor harmful -commensalism process) or cause mass mortalities, depending on the species (Grisez
et al., 1997).
2.7.3 Gut Microbial Communities vs Feed and Water Quality
Gut microbiota in fish has been regarded as fulfilling numerous functions
(Spanggaard et al., 2000). It is accepted that aquatic microorganisms not only influence water quality but also are also associated with the physiological status of fish, disease incidence and post-harvest quality (Ringø et al., 2003; Al-Harbi and
Uddin, 2005). Several authors (Ringø and Gatesoupe, 1998; Spanggaard et al., 2000;
Ringø et al., 2003) suggested that these bacteria have, not only a nutritional role due to the way they break down ingested foods to individual components such as vitamins, (Limsuwan and Lovel, 1981) lipids or amino acids, but also act as a
Ana Catarina Silva Página 28 protection barrier against diseases and pathogens. Owing to this nutritional function, fish with a diverse and abundant diversity in gut microbiota have a good capability of adapting to different nutritional substrates and incorporating food better, thus enhancing their adaptive potential (Al-Harbi and Uddin, 2005).
Olafsen (2001) found out that bacteria ingested by fish larvae by drinking water are primed with antigens before active feeding commences. This may result in the formation of an indigenous larval microbiota. Appropriate and cellular uptake of intact bacterial antigens by newly hatched larvae may affect the development of their immune system. The same author also affirmed that, as the aquatic invertebrates are natural food sources for fish larvae and are also co-inhabitants of larval ecosystems. The relationship between feed and fish imply that the establishment of a larval microbiota will also be influenced by the indigenous microbiota of invertebrates.
Some gastrointestinal bacteria have been demonstrated to enhance growth of catfish and, while this might be possible to extrapolate to other species (Limsuwan and Lovel, 1981), there is still some disagreement regarding this matter.
2.7.4 Gut Microbial Communities Diversity vs Salinity
Gut microbiota of organisms of freshwater and saltwater is distinct, an aspect related to the differential functioning of the intestine between these two environments (Ringø and Gatesoupe, 1998). While Aeromonas spp., Pseudomonas
spp., and members of the Flavobacterium family are the most common group of
organisms in the gut of freshwater fish, Vibrio, Acinetobacter and the
Enterobacteriaceae are the most common bacteria groups in marine fish (Sakata et
al., 1980; Ringø et al., 1995).
The different bacterial communities may also be related with the drinking behavior (Ringø et al., 1995).Marine larvae must drink more water than fresh water fish to maintain their water balance, consequently the larvae due to the drinking process may take up dissolved and particulate compounds passively (Reitan et al., 1998).
Ana Catarina Silva Página 29 The predominant bacterial genera/species isolated from most fish gut have been aerobes or facultative anaerobes, (Ringø et al., 1995). Previous studies in salmonids demonstrated that even though Gram-negative bacteria appear to be dominant in fish gut, Gram-positive bacteria have also been found in the intestine, including different species of lactic acid bacteria (Ringø et al., 1995 Ringø and Gatesoupe, 1998). Some of the bacteria have been implicated in fish diseases and may be a problem for human health (Al-Harbi and Uddin, 2004).
2.7.5 Microbiota Manipulation in Aquaculture – Probiotics
The use of probiotics, also named microbial manipulation in aquaculture may have a profound impact in health management. This is based on the positive results with using probiotics rather then antibiotics in domestic animals (Moriarty, 1998; Olafsen, 2001). The term probiotic describes the beneficial health effects of living cells in the host, by improving the microbial balance of the indigenous microbiota
(Gatesoupe, 1999).In aquaculture industries, beneficial bacteria are added to tanks
and ponds because of their ability to change the microbiota composition of the water and sediment (Moriarty, 1998). These characteristics may be considered antagonistic or anti-colonization by pathogens, natural defenses stimulation or even health benefits from released factors (Olafsen 2001).
There are several reasons to use probiotics (such as Bacillus species) instead of antibiotics to control the growth of unwanted bacteria (e.g Vibrio). Bacillus
species can naturally secrete several antibiotic compounds and enzymes that can penetrate and degrade the biofilms. Also, this group of bacteria competes for nutrients and space (e.g. gut hall) avoiding the fast growth and reproduction of resistant bacteria. The antibiotics are used to kill bacteria, although several pathogens are carrying resistant genes that can be transmitted to future generations. More, unwanted bacteria can reenter the tanks through biofilms on water pipes, air lines or even in contaminated fish guts, exchange genetic information with the resistant bacteria and consequently survive further doses of antibiotics (Moriarty, 1998). Nevertheless, the risk to select probiotic resistant pathogens must not be underestimated (Gatesoupe, 1999). The bacteria used must
Ana Catarina Silva Página 30 be carefully chosen for specific functions that are amenable to bioremediation, introduced in high enough densities and in the right environmental conditions
(Moriarty, 1998). Diversified antagonistic properties must be investigated, in a way
that can decrease the possibility of multi-resistance. For example, antagonistic behavior can be caused by competition for nutrients that favors the intensification of probiotics, or the expression of their inhibitory effects (Gatesoupe, 1999).
2.8 Molecular Methods Describing Microbial Diversity
Nowadays, molecular techniques can provide an exceptional tool for identification and characterization of microorganisms found in the environment, food and other complex ecosystems (Ercolini, 2004; Hovda, 2007).
Traditionally, the analyses of the microbial communities in fish were carried out using conventional culture-based techniques followed by isolation and phenotypic characterization. With the advances in molecular technology these culture-based methods are slowly been surpassed by molecular methods based on Polymerase Chain Reaction (PCR), 16S rRNA gene sequencing and Denaturing Gradient Gel Electrophoresis (DGGE) (Figure 8)(Hovda et al., 2007; Nayak, 2010). The
Figure 8 - The principle of denaturing gradient gel electrophoresis (DGGE) (Hovda, 2007).
major reason for the use of culture-independent methods relates to the required knowledge about the conditions under which most bacteria develop in their natural habitat and the complexity of developing media for cultivation resembling these exact conditions (Ercolini, 2004).
Ana Catarina Silva Página 31 Polymerase Chain Reaction-Denaturing Gradient Gel Electrophoresis (PCR-DGGE) is a technique that combines two methods in one: the amplification of DNA by PCR and electrophoresis in acrylamide gel in denaturing conditions (Tatsadjieu et
al., 2010). Separation of PCR products in DGGE is based on the decrease of the
electrophoretic mobility of partially melted doubled stranded DNA molecules in polyacrylamide gels containing a linear gradient of DNA denaturants like formamide and urea at 60 ºC. Molecules with different sequences will have a different melting performance and will cease migration at a singular position in the gel (Muyzer et al.,
1993). The 16S rRNA gene can describe both cultivable and uncultivable bacteria by
phylogenetic relationship (Pond et al., 2006; Hovda et al., 2007).
PCR and DGGE are frequently used in environmental microbial ecology assessments (Figure 9) (Ercolini, 2004), in studying food and in analyses of gut microbiota (Muyzer et al., 1993). These two genetic fingerprinting methods can be used to identify the genetic diversity of dominant populations from amplified DNA products (Muyzer et al., 1993).
Figure 9 - Flowsheet of the process form fish sampling to bacterial detection and identification. Samples from the fish are taken
directly for DNA extraction (A). In B, bacterial DNA is extracted using standard procedures, or kits, before the DNA is amplified using PCR (C). The PCR products are separated on a denaturing gradient gel (D), and bands of interest are excided and sequenced (E). For further comparison of the bands, the sequences can be aligned in suitable programs, such as ClustalX (F), and a phylogenetic tree can be made to display similarities graphically (G). (Hovda, 2007)
Ana Catarina Silva Página 32
3. Study aims and Hypothesis
3.1 Main Objective
The aim of the present experiment is to study the influence of water and feed microbial communities on gut of Nile tilapia larvae. The present study also aimed to evaluate the influence of sea and freshwater systems and non-sterilized and sterilized feed on the gut biota.
3.2 Research Questions and Hypothesis
Question 1: Does salinity affect the microbial communities in Nile tilapia (O. niloticus) gut?
H0: Salinity does not affect the microbial communities in Nile tilapia (O.
niloticus) gut.
Question 2: Does feed sterilization affect the microbial communities in Nile tilapia (O. niloticus) gut?
H0: Feed sterilization does not affect the microbial communities in Nile tilapia (O. niloticus) gut.
Question 3: Are the microbial communities of water and feed related?
Ana Catarina Silva Página 33
4. Material and Methods
This experiment was approved by the Ethical Committee for Animal Experiments (DEC), Wageningen University with the following protocol number: 2010032.b.
4.1 General Overview of the Experiment
4.2 Pre-Experimental Period
In order to establish microbial communities in both treatments, fresh, saltwater (water maturation), and 3 active suspension tanks (one of 500l and two of
Pre-experimental Period
Time: 3 weeks
System build up: Two 1000 l tanks, one with fresh water and other with salt water.
0.5 of body weigh per cubic meter (tilapia) in each tank.
System setup:
6 active suspension pair tanks with fresh water
6 active suspension pair tanks with salt water
Experimental Period
Time: 42 days
Feeding time – 3x day;
Daily control of water quality;
Sampling points: 0, 7, 14, 28, 42
Ten guts per tank were removed aseptically and
stored in – 80ºC. On day 42 the remain fish were killed, weighed and
stored for further analysis
Experiment Analysis
DNA extraction;
PCR and Agarose Gel;
DGGE;
Input data in
Bionumerics software;
Growth, FCR, SGR and feed intake analysis;
Ana Catarina Silva Página 34 1000l of capacity) were arranged for this experiment. The maturation period (pre-experimental period) had the duration of 3 weeks.
Bacterial load was achieved with the introduction of feed (0.5% of 5 kg of body weight per cubic meter) and fish (5 kg/m3) until the end of the pre-experimental period.
For the saltwater tank, four fishes were introduced (± 400/500 g per fish) and the salinity was gradually increased 5 ppt every two days, until it reached 25 ppt. For each freshwater tank, nine fishes with the similar body weight were introduced in order to have a density of 5 kg/m3.
Fish were fed 0.5% of their body weight (15 g) and were maintained at a constant temperature of 28ºC.
The water quality parameters (pH, temperature, O2, NH+4, NO-3 and NO-2)
were monitored daily. 4.2.1 Water Quality: pH: 6.5-8.0 TAN-N: < 2 mg/l NO2--N: < 1.5 mg/l NO3--N: < 113mg/l Temperature: 26-28 ºC
Dissolved Oxygen (DO): > 6.5 mg/l
Salinity: 0 and 25ppt
When the readings of any of the parameters were abnormal, 10% of the total water volume of the tank was exchanged to avoid potential fish stress and not compromise water maturation. Hydrochloric acid (HCl) was also added as a way of quickly lowering pH.
Every two days, three samples of water were collected and analyzed in the spectrophotometer to measure absorbance, with the objective of checking the optimal density of bacterial communities in each tank.
Ana Catarina Silva Página 35
4.3 Experimental Animals: Tilapia Larvae
Tilapia 6-8 days old larvae were acquired from the company Til-Aqua©. Two different batches of tilapia larvae were received, one acclimated in fresh water and the other acclimated in salt water (25 ppt), both during the incubation period.
The tilapia larvae were immediately transferred into 12 aquaria in order to achieve full acclimation to system conditions avoiding stress. This period lasted for 2 days, time at which the experiment begun (Day 0). With the mouth open (Day 0), gut samples were taken for microbial analysis (10 larvae x 12 tanks).
4.4 Experimental Period
4.4.1 Accommodation
For this experiment, 20-l tanks were arranged and each one was individually connected to a 120l active suspension tank. Good mixing and aeration of the water was provided within the active suspension tanks, thus ensuring efficient swimming and feed uptake by the larvae in the 20l aquaria.
Six of these paired tanks were filled and worked as a salt water system (25 ppt) while the other six worked as a fresh water system (0 ppt).
For the global design (Figure 10) of the experiment there are three couples representing two variables within two variables:
3 tanks with fresh water and fed with non-sterilized feed (FN),
3 tanks with fresh water and fed with sterilized feed (FS),
3 tanks with salt water and fed with non-sterilized feed (SN),
3 tanks with salt water and fed with sterilized feed (SS).
In each aquarium, 120 swim-up fry of Nile tilapia (before first feeding) were stocked (total: 1440 larvae). From these 1440 larvae, 120 were sampled for initial weight determination at the beginning of the experiment. The remaining 1200 larvae were considered as the experimental animals for the main experimental period. This experimental period lasted 42 days.
Ana Catarina Silva Página 36
Figure 10- System design. Six tanks running with fresh water (top system). Six tanks running with salt
water, 25 ppt, (bottom system). The arrows indicate the water flow from the pump (blue circle) in the bottom tank until the fish tank (top) and vice-versa.
4.4.2 Environmental Conditions: Photoperiod – 12L: 12D Water quality: pH: 6.5-8.0 TAN-N: < 2 mg/l NO2--N: < 1.5 mg/l NO3--N: < 113mg/l Temperature: 26-28 ºC
Dissolved Oxygen (DO): > 6.5 mg/l
Salinity: 0 and 25ppt
Daily water quality parameters were checked in order to maintain the levels mentioned above. In case of higher levels of nitrogen compounds, water was exchanged (10% of total volume). For that reason a 1000l tank filled with freshwater was prepared and maintained, and a 300l tank filled with seawater (seawater was prepared by mixing freshwater with InstantOcean sea salt) throughout the experiment. Water was treated with ozone produced by 2 ozone generators Aqua Forte KOIZO3 Ozone Cell (three cells), producing O3 through water electrolysis and
Ana Catarina Silva Página 37 with UV.
Also from the third week until the end of the experiment, four water samples from each system were taken to analyze the carbon/nitrogen ratio.
On a daily basis, while the routines were being executed, the ozone devices were disconnected and the UV generator was connected. Redox potential was also measured every day in order to control the level of ozonation; above 700 mV the water was considered sterile.
4.4.3 Feeding Method and Regime:
The feed was sent to be sterilized (Isotron©, Netherlands) before starting the experiment and was sealed in plastic containers in daily portions per tank. Non-sterilized feed was also sealed in containers. Each day the left-overs of feed given to the larvae were stored for further analyses. Two types of feed were given: In half the salt water and fresh water tanks, larvae were fed with non-sterilized feed, while in the remaining six tanks they were fed with gamma irradiated, sterilized feed. Samples of feed were randomly collected in order to analyze microbial community composition from every sampling point of the experimental period.
A commercial starter, sterilized and non-sterilized feed (F-0.5 GR Pro
Aquabrut- Trow Nutrition©, Germany) and was fed ad libitum from first feeding (7-11 days post fertilization) to juvenile (42 days). Fish were fed 3 times a day (9.00, 12.30 and 16.00) by hand, during a maximum of 30 minutes each time. Fish growth and feed utilization was also monitored.
Feed recipe Fishmeal - 67.6% Starch – 6.8% Fish oil – 6.3% Fish soluble – 6.7% Gluten – 5%
Ana Catarina Silva Página 38 4.4.4 Sampling Days
Days 0, 7, 14, 28, and 42 were scheduled as sampling points. Ten individuals per tank were sampled on each sampling day, (50 individuals in total). The remaining 50 individuals were collected at the end of the experiment for proximate analysis (approximately 60g) (Protocols in Appendix 1, 2, 3, 4 and 5).
4.5 Sampling and Storage
4.5.1 Feed Sampling and Storage
Feed microbial communities were analyzed during the pre-experimental period and experimental period, to assess if the feed-MC varied over time (in both sterilized and non-sterilized feed). Samples were stored at -80ºC until further microbial analyses.
4.5.2 Water Sampling and Storage
Homogeneous 250 ml water samples from each tank were analyzed. These samples were collected at the beginning of the experiment and in every sampling point. The water samples were filtered using 0.45 and 0.22 μm filters through a vacuum apparatus. The filters were stored at -80ºC for further microbial analyses. 4.5.3 Gut Sampling and Storage
At each sampling point, larvae were euthanatized by anaesthetic overdose (MS222). Only 10 individuals per tank (12* 10=120 larvae) per sampling were euthanatized (no dead larvae were maintained in the water or in the refrigerator/freezer until the time of sampling). Each larva was washed (held downwards) first with 70% ethanol and then with 18M-Ohm Milli Q water. Under the microscope, larvae were dissected by holding the abdominal cavity upwards and by aseptically removing the gut. All micro-dissecting tools and surfaces were sterilized. These tools were also rinsed with 70% ethanol and held over a Bunsen burner flame before sampling procedure, as well as between different gut extractions. Gut samples were transferred into 2.5ml cryopreservation tubes and were snapped
Ana Catarina Silva Página 39 freeze in dry ice before storage at -800C until further microbial analyses.
4.6 Samples Analysis
Feed, water and gut microbial communities were analyzed by DNA extraction, PCR and DGGE and selected identified samples were sequenced, to profile the composition of the microbial communities.
4.6.1 DNA Extraction
Gut samples’ DNA was extracted according to “WUR-modified Norwegian University of Science and Technology (NTNU) protocols”. DNA from water and feed samples were set based on “FastDNA SPIN kit” for soil and the kit protocol was followed.
4.6.2 Polymerase Chain Reaction (PCR)
For this step, the primers were chosen in order to amplify only bacterial DNA. As so, the primers used were 968GC (forward) and 1401 (reverse).
In a UV chamber, the Eppendorf tubes and PCR water were sterilized and the entire master mixes and dilutions were prepared, to avoid contaminations. Each master mix had the following components, with the following concentrations:
dNTP: 1 μL 968GC: 2 μL 1401: 2 μL Phire: 1 μL Phire Buffer: 10 μL PCR Water: 33 μL
Total Reaction Volume - 50 μL: 49.0 μl + 1 μl DNA of sample
The DNA concentration in each sample was different according to the value obtained in the Nanodrop analysis (nucleic acid concentration). For this experiment the range of DNA concentrations was from 20 to 100 ng/μl.
Ana Catarina Silva Página 40 The PCR program used in this work was completed in 35 cycles. Each cycle consisted of the following steps:
Pre-denaturation - 2 minutes at 95ºC Denaturation - 30 seconds at 95ºC Hybridization - 40 seconds at 56ºC Elongation - 1 minute at 72ºC Cool down - 4ºC Storage temperature - 12 ºC
In order to visualize the PCR products, an Electophoresis in Agarose Gel was performed.
4.6.3 Denaturing Gradient Gel Electrophoresis (DGGE)
The PCR products were analyzed by the DGGE that was based on standard operating procedure “DGGE Version 25 January 2010, Laboratory of Microbiology, Wageningen University” (Appendix,8). DGGE products were, afterwards, analyzed by
BioNumerics software to profile bacterial diversity.
4.7 Calculations
For the analysis of growth and feed intake, Excel software was used and the following calculations were done.
4.7.1 Growth:
Growth Rate (GR):
GR = (Wt – W0)/ t (g.d-1) t = time (in days)
Wt = body weight at time t
W0 = body weight at time 0 Specific growth rate (SGR):
SGR = (ln Wt – ln W0)/ t ×100 % (% bw.d-1) Geometric mean body weight (Wg):
Ana Catarina Silva Página 41
Metabolic growth rate (MGR)
MGR = (Wt – W0)/Wg0.8/t (g.kg-0.8.d-1)
4.7.2 Feed:
Feed given (F):
F = amount of feed given during the measuring period. (g)
Metabolic ration (Rm)
Rm = F/t/Wg0.8 g.kg-0.8.d-1 Feed intake (FI):
FI = FWi- FWf (g)
4.7.3 Growth Efficiency:
Feed conversion ratio (FCR):
FCR = (Rm/MGR) (g.g-1)
4.8 Statistical Analysis
All statistical analyses were performed using SPSS™ 19.0. The water quality parameters, FCR, SGR, feed intake and proximate analysis were compared within systems and treatments using two factor ANOVA (p > 0.5).
For the estimation of the similarity together with bacterial communities in larvae gut, water and feed, the profiles were analyzed by BioNumerics software based on Pearson correlation. Further, the Pearson values were compared within treatments using one way and two factor ANOVA (p > 0.5) and a T-test (p > 0.5).
Ana Catarina Silva Página 42
5. Results
5.1 Water Quality
The means of temperature, pH, dissolved oxygen (DO), conductivity, total ammonia nitrogen (TAN), nitrite (NO2-), nitrate (NO3-), urea and phosphate,
measured during the experimental period in different factors, salinity and feed sterilization, are represented in Table IV.
Temperature was not significantly different between factors (two factor ANOVA). Despite the similar values, there were significant differences in temperature during the 6 week experimental period (Table V). Nevertheless, no interaction was found between factor salinity and factor week (Repeated measurements ANOVA), feed sterilization and week (Repeated measurements ANOVA) and salinity, feed sterilization and week (Repeated measurements ANOVA). The calculated means for pH are equal, showing no variation of this parameter between or within treatments (Table IV). The maximum and minimum value of pH during week 1 was 8.3 and 7.6, respectively.
Conductivity was significantly higher in salt water (3.94±4.68E3 μS/cm) than in fresh water (351.4±54.9 μS/cm) (Table IV). This parameter demonstrates similar values in non-sterile and sterile feed (1.9E4 ±1.98E4 μS/cm and 1.9E4 ±1.85E4 μS/cm respectively) (two factor ANOVA). Still, there is no interaction among salinity and feed sterilization for conductivity (two factor ANOVA). Notwithstanding, when the week means are analyzed, an interception between week and salinity can be observed (Repeated measurements ANOVA) (Table V). In general, dissolved oxygen did not differ among the treatments (Table IV). Again, note that there is no interaction between factors (two factor ANOVA). Despite the similar values in each week, there is statistical difference between the first, fifth and sixth weeks. Furthermore, a significantly different value of the interception of salinity and week is present (Repeated measurements ANOVA) (Table V).
For the nitrogen compounds, TAN, NO2--N, NO3--N and urea-N, different
results are presented in Tables IV and V. Despite TAN values keeping close to 0.1 mg/l-N in all treatments, the values of NO2--N, NO3--N and urea-N vary. A significant
variation was observed within salinity, but there is no significant interaction between the factors in the all nitrogen compounds (two factor ANOVA). Table V shows the weekly variance of each parameter. For TAN, there are differences between weeks and an interaction between salinity and week (Repeated measurements ANOVA). NO3--N concentrations increased significantly over time, from 0.2±0.13 mg/l in week