1
SHRINKAGE OF SELF-COMPACTING CONCRETE. A COMPARATIVE
ANALYSIS
Miguel José Oliveira (1)(*), António Bettencourt Ribeiro (2) and Fernando Garrido Branco (3)
(1) CEPAC, Universidade do Algarve, Faro, Portugal
(2) Laboratório Nacional de Engenharia Civil, Lisboa, Portugal
(3) INESC Coimbra, Universidade de Coimbra, Departamento de Engenharia Civil, Portugal
Abstract
Self-compacting concrete (SCC) is a concrete type that does not require vibration for placing and compacting. SCC possesses special technical features and properties that recommend its application in many jobs. Nevertheless, in some situations, it has been observed an inadequate behavior of the material at early ages due to shrinkage. The existing shrinkage prediction models were developed for standard concrete. In this paper three SCC mixtures, with different compressive strength, are studied in terms of autogenous and total shrinkage. The results are compared with the Eurocode 2 model. For the studied mixtures it was found that this model underestimates the autogenous shrinkage, while the total shrinkage is generally overestimated. Keywords
2 1. INTRODUCTION
The estimation of time-dependent behaviour is still one of the most difficult aspects in designing a concrete structure. Over the last few years, the use of self-compacting concrete (SCC) has increased [1- 3]. SCC is a technically advanced material, which has shown to have a high potential in the areas of productivity, working conditions and even in matters arising from their inherent characteristics. This material possesses special properties which makes it more suitable for repair jobs. Nevertheless, in some real cases, unsuitable behaviour of the repair material was observed in the early stages of hydration, due to shrinkage [4- 6]. The structural concrete codes which deal with time-dependent behaviour provide general rules for standard concrete, but the validation of some established stress-strain-relations have to be confirmed via laboratory testing when special mixtures are used [7, 8].
The most important changes in mix design between conventionally vibrated concrete (VC) and SCC are the higher paste volume, the large use of mineral additions, and the high dosage of superplasticiser, as well as the optional resource to a viscosity-modifying agent. The variations in paste volume and binder composition lead to a significant influence on the viscoelastic properties of this type of concrete [9- 13].
According to the ACI Terminology [14], shrinkage is the decrease in either length or volume of a material subsequent from changes in moisture content or chemical changes. This decrease occurs in the absence of stress attributable to actions external to the concrete [15- 17]. When no moisture transference with the surrounding environment is allowed, and temperature is kept constant, this volume change is called autogenous shrinkage and is attributed to self-desiccation due to binder hydration [16, 18-32]. It is accepted that autogenous shrinkage is a consequence of RH changes in the pores [33- 35]. The volume of internal liquid water decreases due to hydration. Depending on the pore structure and water available, different mechanisms are triggered. Changes in the surface tension of the solid gel particles, disjoining pressure and tension in capillary water are parameters that have been discussed [16, 23, 36, 37]. In addition to these main mechanisms, other phenomena may be involved in the early volume changes: swelling phase related to sulfate-to-alkali ratio of the clinker and the amount of free lime [19], influence of the type of hydration products [21, 24, 27, 32, 34, 38], creep in the C-S-H phases [30].
Autogenous shrinkage does not usually appear significantly in normal VC, but in high-performance concrete types such as high-strength and SCC with a low water-cement ratio (w/c), autogenous shrinkage it is not an unimportant role [6, 22, 26, 28, 29, 39, 40, 41]. In those cases, the low water/powder ratio leads to refined pores, and the SCC is more sensible to cracking at early shrinkage than VC, even when good practical curing is applied.
As the use of SCC becomes more widespread, some innovative techniques to combat this singularity have been developed. The means and procedures for mitigating shrinkage include cement modification, chemical admixtures, mineral additives, control of curing conditions, fibers and advanced methods of internal curing [42- 44]. Lately, innovative shrinkage control methods using the combined effect of expansive and shrinkage reducing admixtures have been presented [45-48].
In order to optimize the shrinkage reducing effect, an appropriate curing is usually suggested, since curing conditions affect both shrinkage and cracking processes [49, 50]. In this study, autogenous and total shrinkage in three different SCC mixtures with different compressive strength are studied. The curing effect on the total shrinkage is also assessed. The objective of the experimental work carried out is to compare the results
3 with the Eurocode 2 model (EC 2) [7]. A better understanding of early and long-term shrinkage will promote good performance of the concrete structure during its service-life. 2. MATERIALS AND METHODS
In this study, three different concrete mixtures were studied. The preparation of specimens (40 mm x 40 mm x 160 mm) was carried out according to EN 196-1, in a room with a temperature of 20 ± 2 ºC and relative humidity of 555%. Nevertheless, the aggregates and mixture proportions used in the study are different from those established in EN 196-1 (see Tables 4 and 7). Furthermore, due to the low viscosity of the mixture (SCC), the test specimens were not compacted mechanically, and the SCC was just poured into molds.
The removal of molds took place about 8, 18 and 26 hours after mixing, according to the strength class. This length of time was defined as the minimum necessary to ensure concrete strength between 2 and 5 MPa, to avoid specimen’s damage due to molds removal. Subsequently, the specimens were weighed, their length was registered and, in the case of the samples used for measurement of autogenous shrinkage, they were sealed with a plastic film.
Section 5 of EN 12390-2:2009, Testing hardened concrete - Part 2: Making and curing specimens for strength tests [51], prescribes leaving the test specimens in the mold for at least 16 hours, protected against shock, vibration and dehydration. Taking into consideration that autogenous deformation of high strength concrete may start very early [19, 20, 34, 52] with this type of concrete the first length measurement should be made at an earlier age. The RILEM recommendation TC 107-CSP [25], for measurement of time-dependent strains of concrete, does not provide indications about demolding. The three different demolding periods (about 8, 18 and 26 hours) where chosen after carrying out compressive strength tests, which have shown similar values (2-5 MPa) to those specimens tested at early ages. Shrinkage deformations of each specimen were measured using a length comparator, sensitivity of 1 µm, and gage studs on the end sections of the concrete prisms (Figure 1). Stability of the length comparator was checked by a reference invar bar.
Samples for measurement of autogenous shrinkage were placed on two thin supports and kept sealed. The results of the measurements present fluctuation which should not be taken into account. The manual method of measurement implies some error and variation on laboratory room temperature and humidity could not be avoided.
4 Figure 1 - Shrinkage equipment and samples; a)- length comparator; b) sample for drying shrinkage; c) sample for autogenous shrinkage
Since first length measurement was performed very early (compressive strength not higher than 5 MPa), and the autogenous shrinkage is not relevant for stress analysis before the solid percolation, it is assumed negligible the difference between the actual autogenous shrinkage and the measured shrinkage on the sealed specimens.
At the ages of 1, 2, 3, 5, 7, 14 and 28 days, and 2, 3, 4, 5, 6, 7, 8 and 9 months, the length variation of the samples was evaluated. After mold removal, 2 levels of curing were specified:
- Uncured (air curing with the temperature of 20 ± 2 ºC and relative humidity of 555%); - Curing until the concrete reaches near 70% of the average strength at 28 days (3, 5 or 7 days), which satisfies the requirements of curing class 4 specified in the EN 13670 standard [53] (70% of specified characteristic 28 days compressive strength).
The specimens were prepared with Portland cement, CEM I 52.5 R, CEM II/A-L 42.5R or CEM II/B-L 32.5N (see Table 1 – Chemical properties and Table 2 – Physical properties), according to EN 197-1, siliceous fly ash from Compostilla in Spain (Tables 3 and 4), siliceous sand and limestone coarse aggregate from Algarve in Portugal (Table 5), potable tap water and three superplasticizers (Table 6).
The work presented in this paper is part of a PhD study, which involved a wide range of tests. In order to limit the amount of work and materials used, it was decided to use small specimens (40x40x160 mm3), since the ratio between smallest size of the specimen and
largest aggregate size is about 4, thus the size effects were considered having minor influence on the results.
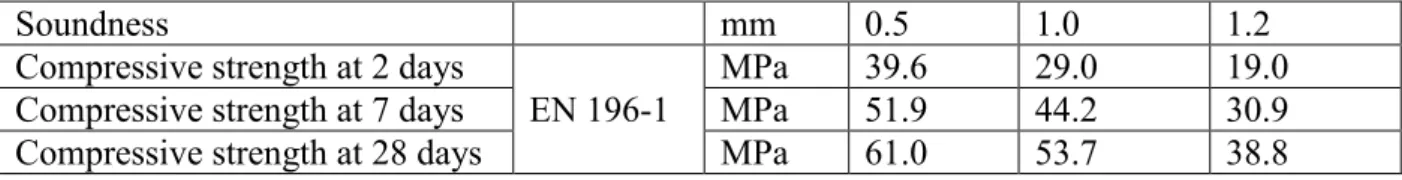
Table 1: Chemical properties of cement
Property Standard Un. CEM I
52.5R CEM II A-L 42.5R CEM II B-L 32.5N loss on ignition EN 196-2 % 1.37 7.59 11.17 Insoluble residue % 1.00 1.57 1.60 SiO2 % 19.55 17.74 16.05 Al2O3 (%) % 5.64 4.93 4.46 Fe2O3 (%) % 3.36 2.80 2.53 CaO (%) % 63.7 61.08 60.29 MgO (%) % 1.84 1.14 1.10 SO3 (%) % 3.05 3.22 3.02 Cl- (%) % 0.02 0.02 0.02
Free lime (%) ASTM C 114 % 1.12 1.00 1.00
Table 2: Physical properties of cements
Property Standard Un. CEM I
52.5R
CEM II A-L 42.5R
CEM II B-L 32.5N
Relative density LNEC
E64 - 3.10 3.05 3.02
Fineness (Blaine) EN 196-6 m2/kg 420 452 428
Water for standard consistence
EN 196-3
% 31.3 28.6 26.1
Initial setting time min. 135 125 120
5
Soundness mm 0.5 1.0 1.2
Compressive strength at 2 days
EN 196-1
MPa 39.6 29.0 19.0
Compressive strength at 7 days MPa 51.9 44.2 30.9
Compressive strength at 28 days MPa 61.0 53.7 38.8
Table 3: Chemical properties of the fly ash
Property Un. Fly ash*
SiO2 % 41.65 SiO2 + Al2O3 + Fe2O3 % 92.71 CaO (free) % 0.02 CaO (reactive) % 2.80 MgO (%) % 2.10 SO3 (%) % 0.27 Cl- (%) % 0.00
*From technical data provided by the manufacturer (EN 450-2) Table 4: Physical properties of the fly ash
Property Un. Fly ash*
Density kg/m3 2330
Fineness (Blaine) m2/kg 428
Particle size >0,045mm % 11.1 Activity index 28 days % 85.5
Activity index 90 days % 104.3 *From technical data provided by the manufacturer (EN 450-2) Table 5: Properties of the aggregates
Properties Sand Gravel
Particles dimensions (mm) 0.125-1 4 – 12.5 Particles size distribution
Sieve size (mm) Passing (%) Passing (%) 16 100 100 12.5 100 99.4 8 100 61.4 4 100 0.1 2 100 0 1 96.9 0 0.5 87.4 0 0.250 64.5 0 0.125 1.2 0 0.063 0 0
6 density (SSD)
Oven dried density 2.64 2.58
Water absorption (%) 0.6 1.5
Table 6: Properties of the admixtures
Adm. Type Delivery
condition / colour Density pH Main Component Recommended dosage SP1 Superplasticizers Liquid / yellow 1.07 6 ± 1 Polycarboxylate ether 0.6-1.2 kg/100 kg binder SP2 Superplasticizers Liquid / brown 1.06 7.3 ± 1.5 Polycarboxylate ether 1-1.7 kg/100 kg binder SP3 Superplasticizers Liquid /
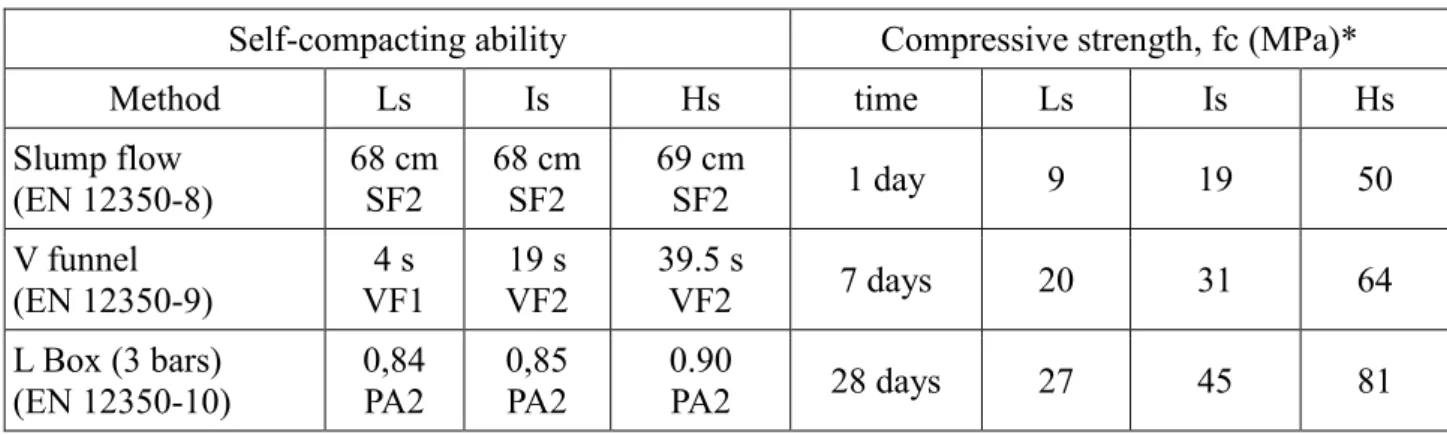
yellow 1.06 7 ± 1 Polycarboxylate ether 0.6-1.0 l/100 kg binder Table 7, exhibits proportions of high (Hs), intermediate (Is) and lower (Ls) strength concrete mixtures. The concrete constituents and dosages adopted were chosen in order to produce mixtures that could be used in commercial production of concrete. Three different superplasticizers were used in order to obtain similar flow characteristics with different W/C, using normal dosages of the commercial chemical admixtures.
Table 7: Mix proportions of tested concrete*
Class of strength Ls Is Hs Water/Powder 0.458 0.426 0.306 Water/Cement 0.757 0.685 0.480 kg/m3 CEM II/B-L 32.5N 264.5 CEM II/A-L 42.5R 283.0 CEM I 52.5R 315.7 Fly Ash 172.8 171.8 178.7 Sand 779.8 773.8 818.8 Gravel 768.1 763.8 804.3 l/m3 SP1 3.5 SP2 9.4 SP3 6.9 Mixing Water 200.3 193.9 151.4
*The air content was not measured and 5% was assumed
The three compositions were designed based on the continuity of the work presented in [54]. It was considered beneficial to keep the non-inclusion of fillers in the compositions, except those coming from cement, so that this study corresponds better to possible practical applications, taking into account that most of the Portuguese concrete plants do not use this type I addition in the manufacturing process.
The criteria for selection the types and classes of cement, as well as the superplasticizers of each composition, included the use of commercially available standard materials and
7 the required level of concrete strength.
Table 8 shows some of the properties measured in fresh and hardened states of the mixtures.
Table 8: Properties of the Self-compacting mixtures
Self-compacting ability Compressive strength, fc (MPa)*
Method Ls Is Hs time Ls Is Hs Slump flow (EN 12350-8) 68 cm SF2 68 cm SF2 69 cm SF2 1 day 9 19 50 V funnel (EN 12350-9) VF1 4 s VF2 19 s 39.5 s VF2 7 days 20 31 64 L Box (3 bars) (EN 12350-10) 0,84 PA2 0,85 PA2 0.90 PA2 28 days 27 45 81
* The compressive strength was measured in cylindrical specimens (size 15 cm diameter and 30 cm height), cured in water at 20± 2ºC.
In Figure 2, the strength development for the three SCC mixtures is presented.
Figure 2 - Strength development of the Self-compacting mixtures
3. RESULTS AND DISCUSSION
The following sections provide the results of shrinkage (total and autogenous) obtained on the three concrete mixtures (3 different strength levels) including the correspondent values obtained from the Eurocode 2 model (EC2). In section 3.1, a brief description of this model is presented.
8 According to the EC2 [7] the shrinkage strain εcs is composed of two components:
𝜀𝑐𝑠= 𝜀𝑐𝑑 + 𝜀𝑐𝑎 Eq 1
where εcs is the total shrinkage strain, εcd is the drying shrinkage strain, and εca is the autogenous shrinkage strain.
The development of the drying shrinkage strain in time may be computed by:
𝜀𝑐𝑑(𝑡) = 𝛽𝑑𝑠(𝑡, 𝑡𝑠) × 𝑘ℎ × 𝜀𝑐𝑑,0 Eq 2
where εcd,0 is the basic drying shrinkage strain, which can be calculated from:
𝜀𝑐𝑑,0= 0.85 [(220 + 110 × 𝛼𝑑𝑠1)𝑒
(−𝛼𝑑𝑠2×𝑓𝑐𝑚0𝑓𝑐𝑚)
] × 10−6× 𝛽 𝑅𝐻 Eq 3
𝛽 𝑅𝐻 = 1.55[1 − (𝑅𝐻 𝑅𝐻0⁄ )3] Eq 4
where fcm is the mean compressive cylinder strength in MPa,
fcm0 = 10 MPa, αds1 and αds2 are coefficients which depends on cement type,
RH is the relative humidity of the surrounding [%], RH0 = 100 %,
In Eq. 2, kh is a coefficient, ranging between 0.7 and 1, which depends on the nominal size (mm) of the cross-section (ℎ0 = 2𝐴𝑐 𝑢⁄ , where Ac is the concrete cross-sectional area, u is the perimeter of that part of the cross section which is exposed to drying). And βds calculated from:
𝛽𝑑𝑠(𝑡, 𝑡𝑠) = (𝑡 − 𝑡𝑠) ⁄ [(𝑡 − 𝑡𝑠) + 0.04 × √(ℎ03)] Eq 5
where:
t is age of concrete at the time considered,
ts is age of concrete at beginning of drying shrinkage (mostly end of curing),
The autogenous shrinkage is obtained from:
𝜀𝑐𝑎(𝑡) = 𝛽𝑎𝑠(𝑡, 𝑡𝑠) × 𝜀𝑐𝑎 (∞) Eq 6
where:
𝜀𝑐𝑎 (∞) = 2,5 × (𝑓𝑐𝑘 − 10) × 10−6 Eq 7
fck is the characteristic compressive cylinder strength of concrete at 28 days,
𝛽𝑎𝑠 (𝑡) = 1 − 𝑒(−0.2𝑡0.5) Eq 8
where t is given in days.
The values of fcm and fck used in this study, based on the available experimental results, are presented in Table 9.
Table 9: fck and fcm of the Self-compacting mixtures Concrete fcm (MPa) Std. dev.
(MPa)
9
Ls 31 2.6 27
Is 48 2.1 45
Hs 84 2.1 81
3.2 Lower strength concrete mixture
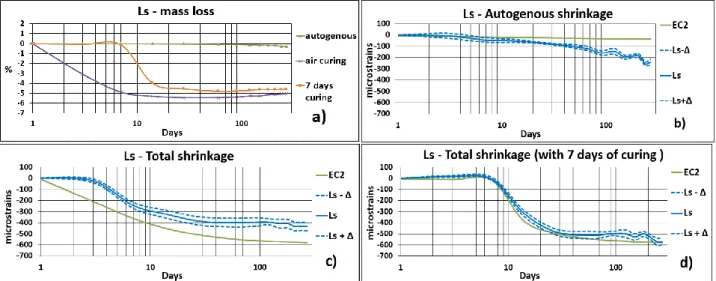
The following results (see Figure 3), were obtained using the average measurements of seven specimens per mixture. For each mixture, the solid curves present the average values and the dashed curves present the average plus or minus one standard deviation. As can be seen in Figure 3a), the specimens used for the autogenous measurements register no mass loss up to approximately 100 days. However, after that age, some drying occurs. The plastic sealing allows some evaporation, but it remains in very low level after 270 days (<0,3%). The mass loss of the specimens subjected to air drying (without cure or subjected to 7 days of cure) starts immediately after the ambient exposure. At 270 days, the mass loss observed in the specimens is almost the same (≈5%), but is a bit smaller on the specimens cured for 7 days. This result is related with the pore structure and hydration degree of the specimens. Keeping the concrete surface humid, during a longer period of time, provides more time for hydration of the concrete skin, and leads to a more refined pore structure. Between 60 days and 270 days, the weight variations are minimal, showing that the mass changes are stabilized.
Figure 3 – Results of lower strength concrete mixture: a) mass loss; b) autogenous shrinkage; c) total shrinkage with air curing; d) total shrinkage with 7 days of curing
Figure 3 also illustrates the autogenous and total shrinkage of the Ls concrete. The corresponding values obtained from the EC2 model are presented. Despite the high W/C of the mixture (0.757), in Figure 3b) the measured values of autogenous shrinkage are higher than those predicted by EC2. A value of 150 microstrain is reached after 3 months, whereas the model predicts less than 50 microstrain at the same age. Beyond 3 months, the difference keeps increasing, but after this age some drying shrinkage also occurs due to the mass loss, which may have affected the measurements. Nevertheless, the results clearly indicate that the EC2 prediction is far from the actual observed values.
10 Figure 3c) shows the results of the total shrinkage obtained from the Ls specimens without cure (demolded between 24 and 28 hours). In this case, the EC2 overestimates the total shrinkage. At early age, the difference is higher, but is still relevant after 9 months, EC2 providing higher values than the measured average (≈+40 %).
Figure 3d) shows the results of total shrinkage obtained from the Ls specimens with 7 days curing (demolded between 24 and 28 hours). The measured values and the EC2 predictions are similar. However, taking into account that the experimental results of the autogenous shrinkage, and computing the drying shrinkage as the difference between total shrinkage and autogenous shrinkage, the actual values of the drying shrinkage are smaller than those calculated from the EC2. Thus, it may be concluded that the EC2 model underestimates the autogenous shrinkage and overestimates the drying shrinkage.
After 9 months, the average of the experimental results is equal to the calculated values from the model. At this age, the total measured shrinkage is 573 microstrains, higher than the total shrinkage of the uncured specimens (435 microstrains, Figure 3c)). Since the mass loss is similar for the two curing conditions (Figure 3a)) this difference is mainly related with the more refined pore structure of the cured specimens [55].
3.3 Intermediate strength concrete mixture
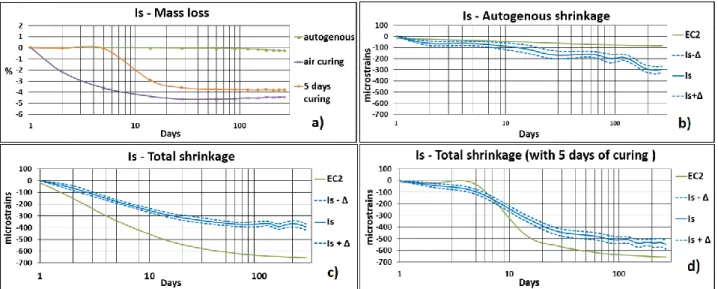
Figure 4 presents the results obtained on the intermediate strength concrete mixture. Figure 4a), the mass loss observed shows that the drying profile is similar to Figure 3a) but, as expected, with smaller values. The mass loss of the specimens subjected to air drying (without cure or 5 days of cure) also starts immediately after the ambient exposure, and at 270 days the mass loss of specimens is similar (≈4%), but is smaller on the specimens cured for 5 days.
Figure 4 – Results of intermediate strength concrete mixture: a) mass loss; b) autogenous shrinkage; c) total shrinkage with air curing; d) total shrinkage with 5 days of curing
Figure 4 also shows the autogenous and total shrinkage of the Is concrete and the EC2 predictions. The measured autogenous shrinkage (Figure 4b)) is higher than the values calculated from the EC2, reaching 200 microstrain at 90 days, more than double the estimated values at the same age. The autogenous shrinkage on Is concrete is also higher
11 than the autogenous shrinkage of Ls, as a result of the lower W/C.
Figure 4c) displays the results of total shrinkage obtained from the Is specimens without cure (demolded between 16 and 19 hours). The EC2 overestimates the total shrinkage, resulting on a difference at 9 months of about 250 microstrains (≈+60%).
Figure 4d) presents the results of total shrinkage obtained from the Is specimens 5 days cured (demolded between 16 and 19 hours). The EC2 underestimates the shrinkage at early age and overestimates it at later ages. At early age, the autogenous shrinkage prevails, and the difference between measured and calculated values is due to the underestimation of the autogenous shrinkage strain. At later ages, when the drying shrinkage becomes more relevant, the EC2 estimations surpass the measured values. Bermejo et al [56] measured the total shrinkage on 3 different SCC mixtures (30 MPa compressive strength), and refer that the EC2 overestimates the shrinkage strains, in accordance with the results presented in Figures 4c) and 4d).
3.4 High strength concrete mixture
The results obtained on the Hs concrete are shown in Figure 5. The mass variation on the specimens used for the autogenous measurements remains low and the highest mass loss was recorded on the specimens without cure (Figure 5a)). Concerning the specimens exposed to air drying, when comparing Figure 5a) with Figures 4a) and 3a), it is clear that there is a decrease of mass loss with the increase of concrete strength, which is related with the pore size. At latter ages, the influence of the curing period is small, but also increases with the concrete strength.
This last finding may be misunderstood, as usually it is considered that the cure is more relevant in low strength concrete. However, it should be noted that, as example, the Hs uncured specimens (demolded between 7 and 9 hours) were exposed to air drying at very early age, and after 1 day the mass loss was already 2 %. It means that, at that age, about 45 l/m3 of water has dried from the concrete and is not available for cement hydration.
This decrease in the water content of the mixture reduces the amount of hydration products, because the water/powder and the water/cement ratios were reduced from 0.31 to 0.21 and from 0.48 to 0.34, respectively. After one day of exposure, 4 days of age, the cured specimens have dried less than 0.5% of the original weight (≈ 11.4 l/m3), and the
corresponding reduction in water/cement is small, 0.48 to 0.44, and still above the Powers limit of ≈0.42 [33]. In fact, with different degrees of hydrations, it is expected to have distinct mass losses on the two curing conditions.
This effect of the cure on the degree of hydration is smaller for mixtures with higher water/cement, in accordance with the observed values on the three concrete mixtures.
12 Figure 5 – Results of high strength concrete mixture: a) mass loss; b) autogenous shrinkage; c) total shrinkage with air curing; d) total shrinkage with 3 days of curing
Autogenous shrinkage of Hs specimens is presented in Figure 5b). As can be seen, the EC2 model does not provide an accurate prediction. The EC2 values are higher at early age and smaller at latter ages. At 9 months the measured autogenous strain is near 300 microstrains, similar to the autogenous shrinkage of Is concrete at the same age and higher than the autogenous shrinkage of Ls concrete (≈ 250 microstrain). The difference observed among the three concrete mixtures is small. This result is probably related with the water/clinker values. Using the loss of ignition as an rough estimator of the clinker content of the cements, we can achieve approximate values of about 75 %, 83 % and 97 % for CEM II-B/L, CEM II-A/L and CEM I, respectively. With this clinker content, the water/clinker of the Ls, Is and Hs concretes are, respectively 1.01, 0.83 and 0.49. According to Powers [33], a water content of about 0.42 is enough to avoid significant self-desiccation. This indicates that, without drying and in the absence of fly ash reaction, there is enough water to avoid significant autogenous shrinkage.
As the binder have a high percentage of fly ash, the reaction of this type II addition becomes more relevant for the autogenous strains, delaying the self-desiccation process. Taking this delay into consideration, at latter ages the slope of the autogenous lines is higher on Hs concrete and smaller on Ls concrete (Is having an intermediate slope), which is in accordance with the expected different self-desiccation of the mixtures. At latter ages, the rigidity of the solid body is high and the creep is low, and, consequently it is reasonable to expect small differences on autogenous shrinkage of the different mixtures. Figures 5c) and 5d) present the results of total shrinkage obtained from the Hs specimens, uncured (demolded between 7 and 9 hours) and subjected to 3 days curing, respectively. It can be seen that EC2 overestimates the total shrinkage. The difference between experimental and estimated values is smaller on the cured specimens, being about 30 % at 270 days.
3.5 Comparative analysis for the 3 SCC classes results
According to the presented results, it is observed that the variation of the water/powder ratio influences the autogenous shrinkage. Low water/powder ratios lead to greater autogenous shrinkage. This is in agreement with the revised bibliography [57-59].
13 However, and as referred above, the difference between the results of autogenous shrinkage depends on the type of binder.
In relation to the total shrinkage, for the three concrete mixtures studied, with and without curing, the specimens subjected to curing exhibit higher shrinkage values (comparisons between Figures 3c) and 3d), Figures 4c) and 4d), Figures 5c and 5d)). An explanation for this apparent contradiction behavior is presented by Oliveira et al [55] and corresponds to a refinement of the concrete porous structure for the specimens subjected to cure.
4. CONCLUSIONS
This paper presents a study comparing experimental concrete shrinkage results (with three different SCC strength classes) with the values estimated by the EC2 model. Taking into account the limited number of mixtures tested, the following conclusions should not be considered as general trends, but rather indications of possible deviations from the standard values.
The analysis carried out shows that the measured mean values of autogenous shrinkage were higher than the mean values estimated using the EC2 equations, for the three SCC strength levels studied. This conclusion was drawn for W/C values ranging between 0.76 and 0.48 and W/P values ranging between 0.46 and 0.31, which are not too small. On the other hand, despite the expected higher shrinkage of SCC, when compared with shrinkage of standard vibrated concrete, the measured differences between total and autogenous shrinkage (using different specimens), which may be defined as approximations of the actual drying shrinkage, are smaller than the EC2 estimations. However, in general, at long term the EC2 estimations for total shrinkage were in the safe side, i.e., providing higher values than the measured ones.
Finally, the presented results show that, for thin elements, a short curing period does not have negative results on total shrinkage. The EC2 model for shrinkage does not reproduce this phenomenon.
ACKNOWLEDGEMENTS The authors express thanks to:
Technical team of the Laboratório de Materiais de Construção (LMC), Instituto Superior de Engenharia da Universidade do Algarve, Portuguese National Laboratory for Civil Engineering (LNEC) and Institute Pedro Nunes laboratory in Coimbra, Portugal. This work has been supported by the Fundação para a Ciência e a Tecnologia (FCT) under project grant UID/MULTI/00308/2013.
14 REFERENCES
[1] S. Zhang, D. Hughes, A.A. Jeknavorian, T. Nishimura, K. Yang, “88. Self-compacting concrete, worldwide experience”, Book title: 2nd Int. Symposium on Design, Performance and Use of Self Consolidating Concrete, Editor(s): C. Shi, Z.Yu, K.H. Khayat and P. Yan, Print-ISBN: 978-2-35158-073-8, e-ISBN: 978-2-35158-093-6, Publisher: RILEM Publications sarl, Pages: 831 – 840 (2009). [2] S.P. Shah, R.P. Ferron, N.A. Tregger, L. Ferrara, M.W. Beacraft, “Self-Consolidating concrete: now and future”, Book title: 2nd Int. Symposium on Design, Performance and Use of Self Consolidating Concrete, Editor(s): C. Shi, Z.Yu, K.H. Khayat and P. Yan, Print-ISBN: 978-2-35158-073-8, e-ISBN: 978-2-35158-093-6, Publisher: RILEM Publications sarl, Pages: 3 – 15 (2009). [3] S.M.F. Asmus, B.J. Christensen, “Status of self -consolidating concrete (SCC) in Asia Pacific”, Book title: 2nd Int. Symposium on Design, Performance and Use of Self Consolidating Concrete, Editor(s): C. Shi, Z.Yu, K.H. Khayat and P. Yan, Print-ISBN: 35158-073-8, e-ISBN: 978-2-35158-093-6, Publisher: RILEM Publications sarl, Pages: 823 – 830, (2009).
[4] Vieira, M; Bettencourt, A., “Repair Application of Self Compacting Concrete“ SCC2005, Combining the Second North American Conference on the Design and Use os Self-Consolidating Concrete (SCC) and the Fourth International RILEM Symposium on Self-Compacting Concrete, Chicago, Illinois, 30 October- 2 November 2005.
[5] Xiaojian Gao, Shiho Kawashima, Xiaoyan Liu, Surendra P. Shah, “Influence of clays on the shrinkage and cracking tendency of SCC”, Cement & Concrete Composites 34, 478–485 (2012). [6] Dejian Shen, Jinliang Jiang, Jiaxin Shen, Panpan Yao, Guoqing Jiang, “Influence of curing temperature on autogenous shrinkage and cracking resistance of high-performance concrete at an early age”, Construction and Building Materials 103, 67–76 (2016).
[7] Eurocode 2. Design of Concrete Structures, Part1: General rules for building. Europen Standard. European Committee for Standardization, 28-31, (1992).
[8] ACI 318-11: Building Code Requirements for Structural Concrete and Commentary.
[9] Leemann, A., Lura, P., “Mechanical Properties of Self-Compacting Concrete”, State-of-the-Art Report of the RILEM Technical Committee 228-MPS on Mechanical Properties of Self-Compacting Concrete, RILEM, 73-94 (2014)
[10] E. Rozière a, S. Granger a, Ph. Turcry b, A. Loukili, “Influence of paste volume on shrinkage cracking and fracture properties of self-compacting concrete”, Cement & Concrete Composites 29, 626–636 (2007).
[11] Saheed Adekunle, Shamsad Ahmad, Mohammed Maslehuddin, Husain Jubran Al-Gahta, “Properties of SCC prepared using natural pozzolana and industrial wastes as mineral fillers”, Cement & Concrete Composites 62, 125–133 (2015).
[12] Weiguo Shen, Xinling Li, Gejin Gan, Liu Cao, Chaochao Li, Jian Bai, “Experimental investigation on shrinkage and water desorption of the paste in high performance concrete”, Construction and Building Materials 114, 618–624 (2016).
15 [13] Ahmed Abdel-Mohti a, Hui Shen b, Yasser Khodair, “Characteristics of self-consolidating concrete with RAP and SCM”, Construction and Building Materials 102, 564–573 (2016). [14] ACI CT-13, ACI Concrete Terminology, American Concrete Institute (2013).
[15] Persson, B.,"Experimental studies on shrinkage of high-performance concrete" Cement and Concrete Research, Vol. 28, No. 7, pp. 1023–1036 (1998).
[16] Pietro Lura, Ole Mejlhede Jensen, Klaas van Breugel, “Autogenous shrinkage in high-performance cement paste: An evaluation of basic mechanisms”, Cement and Concrete Research 33, 223–232 (2003).
[17] Benoît Bissonnette, Pascale Pierre, Michel Pigeon, « Influence of key parameters on drying shrinkage of cementitious materials” Cement and Concrete Research 29, 1655–1662 (1999). [18] Jensen OM, Hansen PF., “Influence of temperature on autogenous deformation and relative humidity change in hardening cement paste”. Cement and Concrete Research, 29: 575-567. (1999).
[19] Laurent Barcelo, Micheline Moranville, Bernard Clavaud, “Autogenous shrinkage of concrete: a balance between autogenous swelling and self-desiccation”, Cement and Concrete Research 35: 177–183, (2005).
[20] A. M. Soliman, M. L. Nehdi, “Effect of drying conditions on autogenous shrinkage in ultra-high performance concrete at early-age”, Materials and Structures 44: 879–899, (2011). [21] B. Craeye, G. De Schutter, B. Desmet, J. Vantomme, G. Heirman, L. Vandewalle, Ö. Cizer, S. Aggoun, E.H. Kadri, “Effect of mineral filler type on autogenous shrinkage of self-compacting concrete”, Cement and Concrete Research 40: 908–913, (2010).
[22] M.H. Zhang, C.T. Tam, M.P. Leow, “Effect of water-to-cementitious materials ratio and silica fume on the autogenous shrinkage of concrete”, Cement and Concrete Research 33: 1687–1694, (2003).
[23] C. Hua, P. Acker, A. Ehrlacher, “Analyses and models of the autogenous shrinkage of hardening cement paste”, Cement and Concrete Research, Vol. 25. NO: 1457-1468, (1995). [24] D.P. Bentz, O.M. Jensen, “Mitigation strategies for autogenous shrinkage cracking”, Cement & Concrete Composites 26: 677–685, (2004).
[25] RILEM TC 107-CSP: Creep and shrinkage prediction models: Principles of their formation, “Measurement of time-dependent strains of concrete”, Materials and Structures, Vol. 31: 507-512, (1998).
[26] Ei-ichi Tazawa, Shingo Miyazawa, “Experimental study on mechanism of autogenous shrinkage of concrete”, Cement and Concrete Research, Vol. 25, No. 8: 1633-1638, (1995). [27] Pipat Termkhajornkit, Toyoharu Nawa, Masashi Nakai, Toshiki Saito, “Effect of fly ash on autogenous shrinkage”, Cement and Concrete Research, 35: 473–482, (2005).
16 [28] D. Snoeck, O.M. Jensen, N. De Belie, ”The influence of superabsorbent polymers on the autogenous shrinkage properties of cement pastes with supplementary cementitious materials”, Cement and Concrete Research, 74: 59–67, (2015).
[29] I. Maruyama, A. Teramoto, “Temperature dependence of autogenous shrinkage of silica fume cement pastes with a very low water–binder ratio”, Cement and Concrete Research, 50: 41–50, (2013).
[30] L. Barcelo, S. Boivin, P. Acker, J. Toupin and B. Clavaud, “Early age shrinkage of concrete: back to physical mechanisms”, Concrete Science and Engineering, Vol. 3: 85-91, (2001).
[31] Viktor Mechtcherine et al, “Effect of internal curing by using superabsorbent polymers (SAP) on autogenous shrinkage and other properties of a high-performance fine-grained concrete: results of a RILEM round-robin test”, Materials and Structures, Published on line, 14 June (2013). [32] Véronique Baroghel-Bouny, Pierre Mounanga, Abdelhafid Khelidj, Ahmed Loukili, Noureddine Rafai, “Autogenous deformations of cement pastes, Part II. W/C effects, micro– macro correlations, and threshold values”, Cement and Concrete Research 36: 123–136, (2006). [33] T. C. Powers, “Structure and Physical Properties of Hardened Portland Cement Paste”, Journal of the American Ceramic Society, vol. 41, P. 1 (1958).
[34] V. Baroghel-Bouny, A. Kheirbek, “Effect of mix-parameters on autogenous deformations of cement pastes – microstructural interpretations”, Concrete Science and Engineering, Vol. 3: 23-38, (2001).
[35] D.P. Bentz, M.R. Geiker, K.K. Hansen, “Shrinkage-reducing admixtures and early-age desiccation in cement pastes and mortars”, Cement and Concrete Research 31: 1075–1085, (2001).
[36] T. C. Powers, T. L. Brownyard, “Studies of the Physical Properties of Hardened Portland Cement Paste - Bulletin 22”, Journal of the American Concrete Institute, Vol.43, (1947).
[37] Françoise Beltzung, Folker H. Wittmann, “Role of disjoining pressure in cement based materials”, Cement and Concrete Research, 35: 2364 – 2370, (2005).
[38] Philippe J.P. Gleize, Martin Cyr, Gilles Escadeillas, “Effects of metakaolin on autogenous shrinkage of cement pastes”, Cement & Concrete Composites, 29: 80–87, (2007).
[39] Mazloom, M. and Ramazanianpor, A.A. and Brooks, J.J., "Effect of silica fume on mechanical properties of high-strength concrete." Cement & Concrete Composites 26: 347–357 (2004). [40] Ahmed Loukili a, Abdelhafid Khelidj b, Pierre Richard, Hydration kinetics, “Change of relative humidity, and autogenous shrinkage of ultra-high-strength concrete”, Cement and Concrete Research 29, 577–584 (1999).
[41] Amjad Alrifai a, Salima Aggoun a, Abdelkader Kadri b, Said Kenai c, El-hadj Kadri a, “Paste and mortar studies on the influence of mix design parameters on autogenous shrinkage of self-compacting concrete”, Construction and Building Materials 47, 969–976 (2013).
17 [42] Kovler K., “Effect of internal curing on autogenous deformation. Internal Curing of Concrete State of the Art Report of RILEM”. Technical Committee TC 196-ICC, p 71-104 (2007).
[43] Tyler Deboodt, Tengfei Fu, Jason H. Ideker, “Evaluation of FLWA and SRAs on autogenous deformation and long-term drying shrinkage of high performance concrete”, Construction and Building Materials 119, 53–60 (2016).
[44] Bart Craeye a,b, Matthew Geirnaert a, Geert De Schutter a, “Super absorbing polymers as an internal curing agent for mitigation of early-age cracking of high-performance concrete bridge decks”, Construction and Building Materials 25, 1–13 (2011).
[45] Meddah MS, Szuki M, Sato R., “Combined effect of shrinkage reducing and expansive agents on autogenous deformations of high-performance concrete”. The 3rd ACF International Conference-ACF/VCA, p 339-346 (2008).
[46] Meddah M S, Szuki M, Sato R., “Influence of a combination of expansive and shrinkage-reducing admixture on autogenous deformation and self-stress of silica fume high-performance concrete”, Construction and Building Materials; Volume 25, Issue 1: 250-239 (2011).
[47] Corinaldesi V., “Combined effect of expansive, shrinkage reducing and hydrophobic admixtures for durable self-compacting concrete”. Construction and Building Materials; Volume 36: 764-758 (2012).
[48] Oliveira, M.J., Ribeiro, A. B., Branco, F. G. “Combined effect of expansive and shrinkage reducing admixtures to control autogenous shrinkage in self-compacting concrete”, Construction and Building Materials 52, 267–275 (2014).
[49] Collepardi M, Borsoi A, Collepardi S, Ogoumah JJ, Troli R., “Effects of Shrinkage Reducing Admixture in Shrinkage Compensating Concrete”. Cement and Concrete Composites; Volume 27, issue 6: 708-704 (2005).
[50] Folliard KJ, Berke NS., “Properties of high performance concrete containing shrinkage reducing admixture”, Cement and Concrete Research, 27 (9): 1364-1357 (1997).
[51] EN 12390-2 - Testing hardened concrete - Part 2: Making and curing specimens for strength tests, (2009).
[52] Sung Won Yoo, Seung-Jun Kwon, Sang Hwa Jung, “Analysis technique for autogenous shrinkage in high performance concrete with mineral and chemical admixtures”, Construction and Building Materials, 34: 1–10, (2012).
[53] EN 13670 - Execution of concrete structures, (2009).
[54] Oliveira, M., “Development of an economic self-compacting concrete without filler”, Master's Thesis, FCTUC, Coimbra, Portugal, (2003).
[55] Oliveira, M.J., Ribeiro, A. B., Branco, F. G. “Curing effect in the shrinkage of a lower strength self-compacting concrete”, Construction and Building Materials 93, 1206–1215 (2015).
18 [56] Bermejo, G. and Cánovas, F., “Shrinkage and creep of medium-low strength self-compacting concrete”, 3rd fib International Congress (2010).
[57] Toma G.,Pigeon, M., Marchand, J., Bissonnette, B. e Barcelo L., “Early age restrained shrinkage: Stress buid up and relaxation”, in International research seminar: “Self-desiccation and its importance in Concrete Technology”, Lund, Sweden, 61-71, (1999)
[58] Bjontegaard, O. e Sellevold, E. J.,”Autogenous and thermal deformation”, in “Early Age Cracking in Cementitious Systems”, RILEM TC 181-EAS, 65-88, (2002).
[59] Baroghel-Bouny, V. “Texture and moist properties of ordinary and high-performance cementitious materials”, in Proceedings of Séminaire RILEM “Betón: du Matérial à la Structure”, Arles, France, (1996).