Acoustic characterization of rehabilitated cloisters
6
0
0
Texto
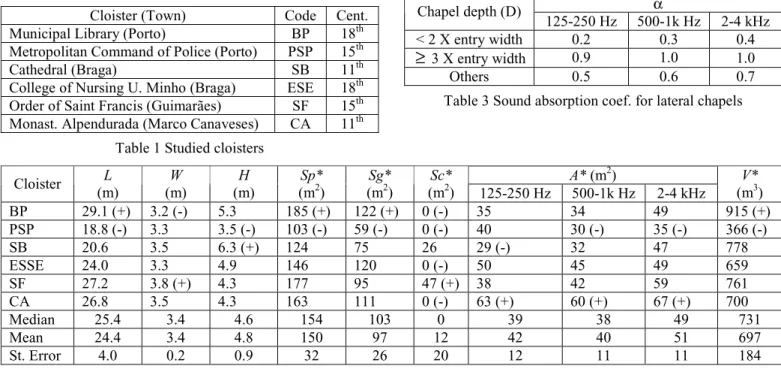
(2) Acoustics 08 Paris This work presents an acoustical characterization of religious historic cloisters which were modified by rehabilitation actions and that now have different utilization. Six cloisters in Portugal (from the 11th to the 18th century) with their galleries closed with glass, constitute the sample used. RT and RASTI’s variation, due to rehabilitation actions, were quantified in order to obtain prediction formulas, which show their variation by architectural parameters of the cloister. These prediction equations can be useful in acoustical rehabilitation to know the variation on RT and RASTI values as a consequence of adapting the local in accordance to a new use.. 1. The architectural parameters measured were: - Length of galleries (L); - Width of galleries (W); - Maximum height of galleries (H); - Surface area of pavements of galleries (Sp) – pavements surface area of two perpendicular galleries; - Surface area of glass (Sg) – surface area of glass (vertical) which closes the connection to the central yard (on two perpendicular galleries); - Chapel’s surface area (Sc) – surface area of the cloister’s lateral chapels, if any, on two perpendicular galleries. Only chapels and openings with more than 1 m deep were considered. - Calculated sound absorption (Ac) – sound absorption obtained by mathematical calculus from the predicted sound absorption coef. of all surface areas of two perpendicular galleries, to the freq. bands 125-250, 500-1k and 2-4 kHz (A125-250, A500-1k, A2k-4k):. Introduction. A Cloister is the building place, usually in a monastery or convent that consists of four open corridors (galleries) that surround an interior open courtyard. Due to the increase use of old monasteries by other activities is possible to find today cloisters as museums, concert rooms, exposition galleries, restaurants, leisure areas in luxury hotels, etc. For the new use it is necessary to modify the old open cloisters’ space, to have an interior place, by closing the galleries’ opening to the central open yard with glass, to avoid rain and wind. This work relates the interior geometry with the acoustical parameters measured (RT and RASTI) and quantifies the values’ variation on these parameters in the “closed” cloisters comparatively to “open” cloisters (the primitive situation with no rehabilitation [1]). The variations on these parameters’ values relatively to “open” cloisters, based on the prediction formulas found, can be useful in Acoustical Rehabilitation design.. 2. n. m. i =1. j =1. Ac = ¦ α i × S i + ¦ Al j + m × V. αi. sound abs. coef.,. (1). S i surface area (m2), Al j localized. sound abs. (discarded because it is usually very low) (m2), m air coef. (m-1) and V volume (m3). - Volume (V) – volume of the two perpendicular galleries (the lateral chapels’ volume, if any, is not included).. Method. 2.1 Sample. In cloisters with lateral chapels where their entry is through the galleries, the α of their entrance openings was taken as in Table 3 [2]. For small openings (less than 1 m depth) α was used according to the existing material (other openings were treated as chapels).. Six historic cloisters in Portugal which open galleries were closed by glass (transforming them in an interior space, “closed” cloisters) were used as sample (Table 1 and Fig. 1 to 6). Table 2 shows the values of their architectural parameters with a statistics summary. Cloister (Town) Municipal Library (Porto) Metropolitan Command of Police (Porto) Cathedral (Braga) College of Nursing U. Minho (Braga) Order of Saint Francis (Guimarães) Monast. Alpendurada (Marco Canaveses). Code BP PSP SB ESE SF CA. Chapel depth (D). Cent. 18th 15th 11th 18th 15th 11th. < 2 X entry width ≥ 3 X entry width Others. 125-250 Hz 0.2 0.9 0.5. α 500-1k Hz 0.3 1.0 0.6. 2-4 kHz 0.4 1.0 0.7. Table 3 Sound absorption coef. for lateral chapels. Table 1 Studied cloisters Cloister BP PSP SB ESSE SF CA Median Mean St. Error. L (m) 29.1 (+) 18.8 (-) 20.6 24.0 27.2 26.8 25.4 24.4 4.0. W (m) 3.2 (-) 3.3 3.5 3.3 3.8 (+) 3.5 3.4 3.4 0.2. H (m) 5.3 3.5 (-) 6.3 (+) 4.9 4.3 4.3 4.6 4.8 0.9. Sp* (m2) 185 (+) 103 (-) 124 146 177 163 154 150 32. Sg* (m2) 122 (+) 59 (-) 75 120 95 111 103 97 26. Sc* (m2) 0 (-) 0 (-) 26 0 (-) 47 (+) 0 (-) 0 12 20. 125-250 Hz 35 40 29 (-) 50 38 63 (+) 39 42 12. A* (m2) 500-1k Hz 34 30 (-) 32 45 42 60 (+) 38 40 11. 2-4 kHz 49 35 (-) 47 49 59 67 (+) 49 51 11. V* (m3) 915 (+) 366 (-) 778 659 761 700 731 697 184. Table 2 Architectural parameters measured (the highest + and lowest - values are signalled) * refers only to the two perpendicular galleries measured. 2702.
(3) Acoustics 08 Paris. Fig. 1 to 6 The six studied cloisters with the rehabilitated galleries: openings between galleries and central yard closed with glass (top left to bottom right: BP, PSP, SB, ESE, SF, and CA) [3].. 2.2 Methodology. 3. The RT (Reverberation Time, from 125 to 4000 Hz octave bands) and RASTI (Rapid Speech Transmission Index) were measured using a B&K 4224 sound source, a B&K 2260 sound level meter and a B&K 3361, and they were taken in half a cloister, in two perpendicular galleries, as the cloisters were symmetric. Each measure was taken with the microphone positioned at approximately 1.30 m of the ground. The measurements were made in four positions (Fig. 7) and for each the average of three values was taken.. Results. Table 4 shows the mean values for the measured RT and RASTI. The speech intelligibility suggested by RASTI values is reasonable in three of the cloisters which have values above 0.46. On the other three cloisters, RASTI values were below 0.43 that show mediocre speech intelligibility. This can be explained by the dimension of BP and SF cloisters which are the biggest measured, so there is more variability on RASTI values that decrease with the distance to the sound source. The high galleries’ height and the existence of lateral chapels on SB cloister, can affect the large variation on RASTI values. RT mean values obtained for the 500 Hz to 2 kHz octave bands were between 2.8 and 3.4 s which is high for many of the cloisters’ new uses, especially when the speech intelligibility is fundamental. However these values would be good if the local is used for choral singing.. SS. 4. Analysis. 4.1 Relationship between RT and RASTI Table 5 presents the best relationship between parameters RT and RASTI using the mean values of each cloister.. Fig. 7 Distribution of the four measuring points and Sound Source (SS) within a cloister.. 2703.
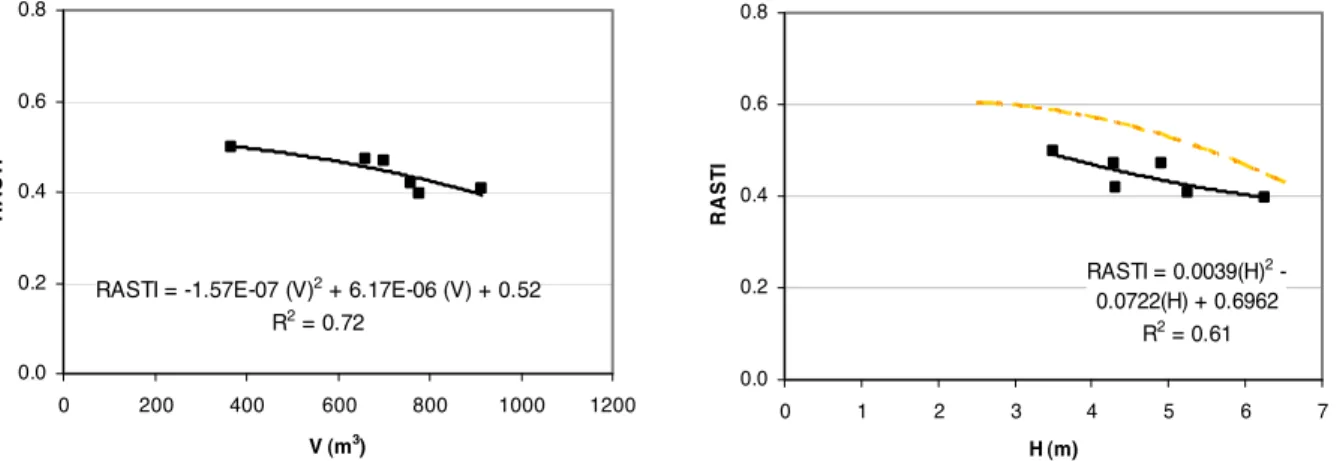
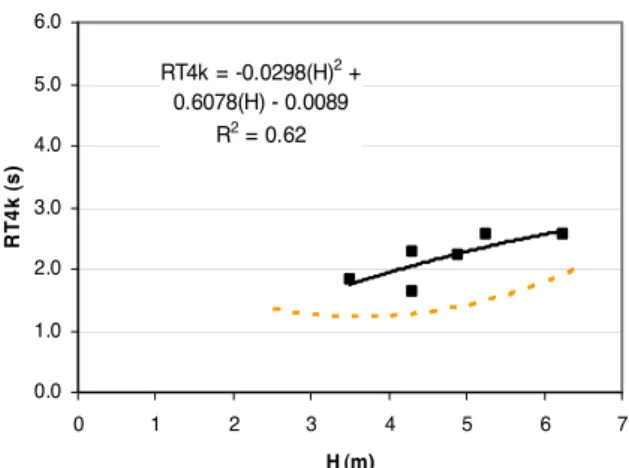
(4) Acoustics 08 Paris Cloister RT125 (s) RT250 (s) RT500 (s) RT1k (s) RT2k (s) RT4k (s) RASTI BP 4.36 (+) 5.34 (+) 5.11 (+) 4.72 (+) 3.49 (+) 2.56 0.41 PSP 2.72 2.30 2.57 2.86 2.44 1.83 0.50 (+) SB 4.09 4.54 4.63 4.38 3.38 2.57 (+) 0.40 (-) ESE 2.64 1.86 2.15 2.72 2.67 2.22 0.47 SF 3.26 3.30 3.36 3.22 2.73 2.29 0.42 CA 1.74 (-) 1.66 (-) 2.07 (-) 2.34 (-) 2.19 (-) 1.64 (-) 0.47 Median 2.99 2.80 2.96 3.04 2.70 2.25 0.44 Mean 3.14 3.17 3.32 3.37 2.82 2.18 0.44 St. error 0.98 1.51 1.30 0.96 0.52 0.38 0.04 Table 4 Medium values obtained, in each cloister, for RT (125 to 4000 Hz) and RASTI and statistics summary information (the highest + and lowest - values are signalled) RASTI = -0.1397 (RT4k)2 + 0.5001(RT4k) + 0.0348. R2 = 0.81. Table 5 The best relationship found between RT and RASTI 10 present some of these (where the broken lines in Fig. 9 and 10 indicate the best relationship obtained in “open” cloisters with the same architectural parameter - initial situation, no rehabilitation [1]). The variability of RASTI and RT is mainly explained by the Absorption (A), Height (H) or Volume (V). All the other architectural features do not appear to be significant to the variability of those parameters.. 4.2 Relationships among acoustical and architectural parameters 4.2.1 Simple models Table 6 shows the best relationships regarding simple models between the mean values of the acoustic and the architectural parameters of the cloisters studied (Fig. 8 to Simple Model RASTI = -1.57E-07 V2 + 6.17E-06 V + 0.52 RASTI = 0.0039 H2 – 0.0722 H + 0.6962. R2 0.72 0.61. RT125 = 9.0584e-0.0261 (A125-250) RT125 = 0.685 H – 0.1198. 0.88 0.43. RT250 = 977.45 (A125-250)-1.569 RT250 = 0.0055 V – 0.6424 RT250 = 0.1411 H2 – 0.3463 H + 1.5205 RT500 = 326.23 (A125-250)-1.2525 RT500 = 0.1815 H2 – 0.8492 H + 3.1158 RT500= 7.9679e-0.0233 (A500-1k) RT500 = 0.0047 V + 0.0721. 0.80 0.44 0.43 0.78 0.47 0.43 0.43. R2. Simple Model RT1k = 91.741 (A125-500)-0.898 RT1k = 0.1427 H2 – 0.6722 H + 3.2387 RT1k = 6.7183e-0.0178 (A500- 1k). 0.78 0.53 0.50. RT2k = 6.98E-06 V2 – 0.0068 V + 3.9906 RT2k = 0.4339 H + 0.7548. 0.65 0.63. RT4k = -0.0298 H2 + 0.6078 H – 0.0089 RT4k = 2.89E-06 V2 – 0.0022 V + 2.2417. 0.62 0.51. 0.8. 0.8. 0.6. 0.6 RASTI. RASTI. Table 6 Best simple models between acoustic and architectural parameters (V and A concern to half a cloister: two perpendicular galleries). 0.4. 0.2. RASTI = -1.57E-07 (V)2 + 6.17E-06 (V) + 0.52 R2 = 0.72. 0.4. RASTI = 0.0039(H)2 0.0722(H) + 0.6962 R2 = 0.61. 0.2. 0.0. 0.0 0. 200. 400. 600. 800. 1000. 1200. 0. V (m3). 1. 2. 3. 4. 5. 6. 7. H (m). Fig. 8 and 9 Some of the best simple models between RASTI and architectural parameters (V for two perpendicular galleries – broken line refers to “open” cloisters).. 2704.
(5) Acoustics 08 Paris The Eq. (2) and (3) return the predictive values that would be obtained if the cloister were measured prior to the rehabilitation and closure of its galleries with glass, meaning an approximate value that the same cloister would have if it was still “open” (non rehabilitated).. 6.0. 6.0. RT2k = 6.98E-0,6 (V)2 - 0.0068 (V) + 3.9906 2 RT4k = -0.0298(H) + R2 = 0.65. 5.0. 5.0. 0.6078(H) - 0.0089 R2 = 0.62. RT4k RT2k (s)(s). 4.0. 4.0. With the values of ǻRASTI and ǻRT obtained by Eq. (2) and (3) relationships were found in which those values were related with the architectural parameters in the cloisters’ galleries. Table 8 shows those formulas (Fig. 11 to 14). The best relationships are obtained for the 125 and 1k Hz frequency bands. The diminution of RT values by “closure” of the cloisters seems to be proportional to the increase on the sound absorption (A). The increase of the pavement area (Sp) and on the height (H) results in a raise of ǻRT.. 3.0. 3.0 2.0. 2.0 1.0. 1.0 0.0. 0.0 0 0. 200. 1. 400. 2. 600. 3V (m 3) 4. 800. 1000. 5. 6. 1200. 7. H (m). Fig. 10 One of the best simple models between RT and architectural parameters (broken line refers to “open” cloisters).. Simple Model ǻRASTI = -8.96E-05 (V) – 0.0242 ǻRT125 = -0.0600 (A125-250) + 3.3767 ǻRT250 = -4.5954 Ln (A125-250) + 18.078 ǻRT250 = 0.1369 H2 – 0.29 – 0.8074 ǻRT500 = -0.0696 (A500-1k) + 4.2508 ǻRT1k = 15.491e-0.0685 (A 500-1k) ǻRT1k = 0.7398 H – 2.2166 ǻRT2k = 0.4429 H – 1.0345 ǻRT4k = 0.000131 Sp2 – 0.0336 Sp + 2.721 ǻRT4k = 2.91E-06 V2 – 0.0029 V + 1.2643. 4.2.2 General linear models To improve the above simple models general linear models were tested and the results are shown in Table 7. All relationships are very precise and the best ones are related with the highest frequency bands of RT (the most significant for speech intelligibility). The variability is strongly justified mainly by the volume (V), the glass area (Sg) and/or the Absorption (A).. Table 8 Best predicting simple models for ǻRASTI and ǻRT from architectural parameters due to closing of cloisters’ galleries with glass (all parameters are from the rehabilitated closed galleries - V, Sp and A refers to half cloister: two perpendicular galleries). R2 0.97 0.96 0.91. 0.00. 0.93. 0. 0.96. 400. 600. 800. 1000. 1200. -0.04. 0.99 0.99. -0.06 -0.08 -0.10. Table 7 Best general linear models among acoustical and architectural parameters (Sg, V, Sp and A refer to half cloister: two perpendicular galleries). -0.12. ǻRASTI = -8.96E-05 (V) - 0.0242 R2 = 0.48. -0.14 V (m 3). 4.3 Comparison between expressions for “closed” and “open” cloisters. 4. ǻRT125 = -0.0600 (A125-250) + 3.3767 R2 = 0.89. 3 ǻRT125 (s). 4.3.1 Simple models The variation in the RASTI and RT values (that is, ǻRASTI and ǻRT) that the close of the galleries with glass implies, is analyzed (it is only considered the close of the galleries with glass, not considering any possible change in the furniture, which would implicate a change in the calculated sound absorption of the space).. 2. 1. 0 0. The ǻRASTI and ǻRT were obtained by subtracting to the measured values in the “closed” cloisters of this study the values predicted for the same cloisters using the best predicting formulas in the thesis about “open” cloisters [1]: ǻRASTI = (RASTI closed cloisters) – (RASTI open cloisters) ǻRT = (RT closed cloisters) – (RT open cloisters). 200. -0.02. ǻRASTI. General Linear Model RASTI = 0.000993 Sg – 0.000279 V + 0.54272 RT125 = 0.0162 Sg – 0.0874 (A125-250) + 5.281 RT250 = 0.00425 V – 0.0859 (A125-250) + 3.862 RT500 = 0.00654 H + 0.00534 V – 0.08253 (A5001k) + 2.9687 RT1k = 0.1088 H + 0.00338 V – 0.06130 (A500-1k) + 2.9824 RT2k = 0.05845 H + 0.00283 V + 0.3054 W – 0.04100 (A2k-4k) + 1.601 RT4k = 0.04124 Sp + 0.2217 H – 0.2658 L – 0.02236 (A2k-4k) + 2.586. R2 0.48 0.89 0.67 0.43 0.53 0.70 0.50 0.60 0.41 0.40. 20. 40. 60. 80. -1 A125-250 (m2). Fig. 11 and 12 Some of ǻRASTI and ǻRT variation with the architectural parameters, due to closing galleries with glass (two perpendicular galleries: A and V for ‘closed’ cloisters).. (2) (3). 2705.
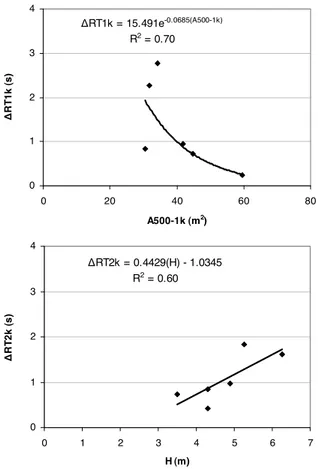
(6) Acoustics 08 Paris. 5. 4. ǻRT1k = 15.491e-0.0685(A500-1k) R2 = 0.70. In the cloisters measured, the mean RT values in the most important frequency bands (500 Hz to 2 kHz), were about 3 s, which is elevated to the new uses of these rehabilitated spaces.. ǻRT1k (s). 3. 2. From simple relationships among acoustical and geometrical parameters it was noticed that the variability of the RASTI values is explained essentially by the volume (V) or by the height of the galleries (H).. 1. 0 0. 20. 40. 60. The variability of RT values depends most of the height (H), volume (V) and sound absorption (A). These parameters influence the variability of RT values in all frequency bands, but mainly in the lower ones. In the simple models relationships among acoustical and architectural parameters, the galleries length (L), the area of glass (Sg), the opening area of the chapels (Sc), and the width (W) do not appear to be very significant to the variability of the RASTI and RT values.. 80. A500-1k (m2). 4. ǻRT2k = 0.4429(H) - 1.0345 R2 = 0.60 3 ǻRT2k (s). Conclusion. 2. From general linear models among acoustical and architectural parameters the variability of RASTI values is strongly justified by the volume (V) and by the area of glass (Sg). The parameters that most interfere on the variability of the RT are the height (H), the volume (V) and, mainly, the sound absorption (A).. 1. 0 0. 1. 2. 3. 4. 5. 6. 7. H (m). It was possible to conclude about the variations on RASTI and RT values (ǻRASTI and ǻRT) that this type of rehabilitation of cloister implies (the act of closing the galleries with glass). On simple models, the sound absorption (A), the volume (V), and the height (H) seem to be the parameters that most influence ǻRT and ǻRASTI.. Fig. 13 and 14 Some of ǻRT variation with the architectural parameters, due to closing galleries with glass (A and H for “closed” cloisters of two perpendicular galleries).. 4.3.2 General linear models. General linear models were obtained that quite precisely justify the variation on the ǻRASTI and ǻRT values caused by the closure of the galleries with glass. The height (H), volume (V) and sound absorption (A) seem to be those that most influence that variation.. Table 9 shows the best general linear models found among the variability of the RASTI and RT values as a result of the closure of the galleries with glass (ǻRASTI and ǻRT) with the architectural parameters. These prediction formulas are very precise (R2 0.94). The height (H), length (L), width (W), calculated sound absorption (A), and volume (V) seem to be those that most influence the variations of the values of RASTI and RT upon the rehabilitation of the cloister. General Linear Model ǻRASTI = 0.02076 H – 0.00015 V + 0.00150 (A125-250) – 0.1480 ǻRT125 = – 0.1757 H – 0.8152 W – 0.06617 (A125250) + 7.2851 ǻRT250 = 0.00434 V -1.9211 W – 0.08603 (A125250) + 8.252 ǻRT500 = – 0.1168 Sp + 1.023 L – 0.1090 (A125250) – 1.414 ǻRT1k = 0.5271 H + 0.1155 L – 0.06916 (A500-1k) -1.2243 ǻRT2k = 0.08206 H + 0.00280 V – 0.04144 (A2k4k) + 0.8434 ǻRT4k = 0.03692 Sp – 0.2124 L – 0.02313 (A2k-4k) + 1.5857. In general, the rehabilitation of historic religious cloisters by the closure of their open galleries with glass implies (if no other modification is done within the galleries): a reduction on values of RASTI of about 0.08 to 0.10; a raise on the values of RT 125 and 250 Hz of about 0.9 to 1.1 s; a raise on the values of RT 500 and 1000 Hz of about 1.3 to 1.5 s; a raise on the values of RT 2000 and 4000 Hz of about 0.8 to 1.1 s.. R2. The expressions now provided can be useful in the design of historic rehabilitation in cloisters of similar dimensions to the sample on this study (galleries with lengths of 15 to 30 m and heights of 3.5 to 6.5 m).. 0.97 0.96 0.94 0.95. References. 0.94. [1] Anabela Carvalho, “Caracterização acústica de claustros religiosos históricos”, M.Sc. thesis, U. Porto (2005). 0.99. [2] António Carvalho, “Influence of architectural features and styles on various acoustical measures in churches”, Ph.D. dissertation, U. Florida (1994). 0.97. Table 9 Best general linear models for ǻRASTI and ǻRT based on architectural parameters due to closing galleries with glass (all parameters from closed galleries - V, Sp and A referring to half cloister: two perpendicular galleries). [3] Sílvia Vilela, “Caracterização acústica da reabilitação de claustros”, M.Sc. thesis MIEC, U. Porto (2008). 2706.
(7)
Imagem
![Fig. 1 to 6 The six studied cloisters with the rehabilitated galleries: openings between galleries and central yard closed with glass (top left to bottom right: BP, PSP, SB, ESE, SF, and CA) [3]](https://thumb-eu.123doks.com/thumbv2/123dok_br/18880944.932498/3.892.142.753.63.583/studied-cloisters-rehabilitated-galleries-openings-galleries-central-closed.webp)
+2
Documentos relacionados
Este modelo permite avaliar a empresa como um todo e não apenas o seu valor para o acionista, considerando todos os cash flows gerados pela empresa e procedendo ao seu desconto,
didático e resolva as listas de exercícios (disponíveis no Classroom) referentes às obras de Carlos Drummond de Andrade, João Guimarães Rosa, Machado de Assis,
Na hepatite B, as enzimas hepáticas têm valores menores tanto para quem toma quanto para os que não tomam café comparados ao vírus C, porém os dados foram estatisticamente
The probability of attending school four our group of interest in this region increased by 6.5 percentage points after the expansion of the Bolsa Família program in 2007 and
Ousasse apontar algumas hipóteses para a solução desse problema público a partir do exposto dos autores usados como base para fundamentação teórica, da análise dos dados
Moreover in Raman spectroscopy, a single frequency of radiation is used to irradiate a sample unlike IR absorption which requires matching of the incident radiation to the
The author shows that not only is the foreign inscribed in the gaze, a gaze that cannot be reduced to the visible, but that it lies at the very heart of the human subject..
não existe emissão esp Dntânea. De acordo com essa teoria, átomos excita- dos no vácuo não irradiam. Isso nos leva à idéia de que emissão espontânea está ligada à
