M
ESTRADO EM
C
ONTABILIDADE
,
F
ISCALIDADE E
F
INANÇAS
E
MPRESARIAIS
T
RABALHO
F
INAL DE
M
ESTRADO
D
ISSERTAÇÃO
T
HE IMPACT OF THE PRIVATIZATION PROCESS ON COMPANY
PERFORMANCE
:
EVIDENCE FROM
E
UROPEAN COUNTRIES
.
J
OAQUIM
A
LEXANDRE DE
F
REITAS
J
USTINO
II
M
ESTRADO EM
C
ONTABILIDADE
,
F
ISCALIDADE E
F
INANÇAS
E
MPRESARIAIS
T
RABALHO
F
INAL DE
M
ESTRADO
D
ISSERTAÇÃO
T
HE IMPACT OF THE PRIVATIZATION PROCESS ON COMPANY
PERFORMANCE
:
EVIDENCE FROM
E
UROPEAN COUNTRIES
.
J
OAQUIM
A
LEXANDRE DE
F
REITAS
J
USTINO
O
RIENTAÇÃO:
M
ESTREP
AULOM
ANUEL DEM
ORAISF
RANCISCOIII
Abstract
The present study investigates the impact of the privatization process on a sample
of 125 privatized European companies, during the period 2001-2011. We compare
company performance before and after the privatization process and evaluate the impact
of changes in private shareholding on the performance of the privatized companies.
Additionally, we investigate how different combinations of private participation and state
participation influence company performance.
We find that privatized companies reveal superior performance in the period after
the privatization process and that increases in private participation have a positive impact
in company performance. The results also show that there seems to be an optimal
combination between state participation and private investment that maximizes company
performance.
IV
Resumo
O presente estudo investiga o impacto do processo de privatização numa amostra
de 125 empresas Europeias privatizadas, durante o período de 2001-2011. Comparamos
o desempenho das empresas antes e depois do processo de privatização e avaliamos o
impacto de mudanças na participação privada no desempenho das empresas privatizadas.
Adicionalmente, investigamos como diferentes combinações de participação privada e
participação do Estado influenciam o desempenho das empresas.
Os resultados mostram que as empresas privatizadas revelam um desempenho
superior no período posterior ao processo de privatização e que o aumento da participação
dos privados tem um impacto positivo no desempenho das empresas. Os resultados
mostram também que parece haver uma combinação ótima entre a participação do Estado
1
1 – Introduction
We are currently witnessing a wave of financial assistance programs in Europe.
Given the difficulty of some countries to fulfill their financial commitments, privatization
of public enterprises is one of the items in the agenda. We can find some examples of this
situation in Portugal or Greece where a memorandum has been singed between national
institutions and international European authorities. This brings back an old debate in the
European society, with valid arguments for and against privatizations. Efficiency gains
have been pointed out as an advantage of this process (Boubakri and Cosset, 1998), while
market power exploitation has been presented as a disadvantage (La Porta and
Lopez-de-Silanes, 1999). The present study intends to provide additional insights to this debate.
This study seeks to examine the relationship between the privatization process of
state owned companies and their performance. Empirical literature has provided evidence
that privately owned firms perform better than state owned companies, which in turn has
been one of the arguments in favor of selling state shares (Gupta, 2005). Given the current
sovereign debt crisis Europe is facing, European countries provide a perfect laboratory
for analyzing the efficiency of privatization processes. It’s interesting that Europe, most
important representative of welfare state policies, becomes involved in such an intense
debate about sustainability of its own model. Given the present crisis, we could question
the sustainability of state intervention in the economy, as most of the southern countries
have welfare policies that are unrealistic when compared to the level of wealth they create.
This mismatch will inevitably lead to an unsustainable level of public debt. Actually, in
most European countries economic growth seems unable to sustain social commitments
made to their citizens. The role of public enterprises is of great importance to this debate.
2
necessity seems to provide us a framework that justifies the relevance and opportunity of
this study.
This study compares public and private sector, to clarify the context involving the
Business Manager and the key variables to be taken into consideration for the decision
process, and consequently the success of the organization. Managing a state owned
company appears to require a different set of criteria from those followed by a private
sector company, especially regarding shareholder’s objectives, financial management and
employees’ perception and motivation (Gupta and Dinc, 2011). Furthermore, it is in
businesses and tax payer’s best interest that state intervention in the economy is studied
and monitored. This intervention is crucial for employment and for private sector
decisions, as state owned companies usually are important players in the market and are
responsible for a considerable number of jobs (Gupta and Dinc, 2011). Most importantly
this intervention is crucial in its application of public resources. At the end of the day,
results of this application determines the state’s financial needs, in turn determining the
level of taxation that is imposed to society.
The present study relies on public information, namely firms’ financial statements,
in order to perform a comparative analysis of business performance in state owned firms
that where subsequently sold to private owners. This comparative exercise is based on a
set of financial indicators that aim to represent the different features that compose a
company's performance and the way these features change throughout a privatization
process. Particularly, the performance of a set of privatized firms is compared with the
performance of state owned firms. The results obtained in the present study provide strong
evidence that state owned firms perform better after the privatization process since they
confirm that companies have better performance after privatization. The results also show
3
combination between private and state participation that maximizes company
performance.
The remaining of the paper is organized as follows. In the following chapter, we
review the relevant literature. The third chapter identifies the problem by defining the
hypotheses raised by this study. Chapter four addresses data that supports our analysis
and methodology is presented in chapter five. We discuss the results in chapter six and
present our conclusions in chapter seven.
4
2 – Literature Review
Theory on this subject argues that the privatization process has a positive influence
on the efficiency of privatized firms. This relationship seems to be explained by existing
differences between the objectives of privatized companies and objectives of state owned
companies (Vickers and Yarrow, 1991). When a company is controlled by the state,
objectives are established seeking to maximize a combination of social welfare and the
personal agenda of the minister, politician or government bureaucrat who controls it. This
personal agenda can be determined by different factors like favoring specific interest
groups, aiming to high wages and high employment levels in specific firms or specific
sectors, or be subject to patronage pressure that requires returns for the previously granted
political support. When a company is controlled by private investors, objectives are set
according to a profit maximization perspective, which can also constitute in itself a
component of social welfare (Vickers and Yarrow, 1991). Between these two opposing
perspectives lies one of the reasons for the difference between the efficiency of state
owned enterprises and private enterprises, since strategies for improving business
performance necessarily require restructuring measures and resource optimization. These
measures can turn out to be very unpopular for any politician (Gupta and Dinc, 2011).
Additionally, the privatization process contributes to change the means of
monitoring managerial behavior. The possibility of transferring the property rights
acquired by private investors may lead to market pressure. This pressure reveals
information because of the need to establish prices for those property rights. These prices
should reflect the possibility of current decisions becoming future profits, thus evaluating
management decisions (Vickers and Yarrow, 1991). Another kind of monitoring
5
bankruptcy. Privatized firms no longer have the shelter provided by state protection that
subsidizes loss-making activities with taxpayer money when necessary. These companies
are now subject to a competitive environment that facilitates performance comparisons
but also requires an increase in productive efficiency for the companies to be able to
survive (Vickers and Yarrow, 1991).
In Table I we present a summary of the main studies on this subject and its main
conclusions. The time period of the study, the methodology and the geographic context
from where the sample was collected, are also presented. Overall the studies report
performance improvements for partially privatized and fully privatized companies,
regardless of different samples, different methodologies and different time periods.
Table I - Summary of literature review
Authors Country(ies)
analyzed periodTime Methodology Main conclusions
Boubakri and
Cosset (1998) developing 21 countries
1980-1992 difference testMean Significant improvement in output, operating efficiency, investment, dividends payment and employment. Significant reduction in debt levels.
Boardman, Laurin and Vining (2000)
Canada
6
Authors Country(ies)
analyzed periodTime Methodology Main conclusions
Boardman and
Vining (1989) 500 largest non US industrial
firms
1983 OLS
Regression State owned and mixed ownership firms are significantly less profitable and productive than private firms. Mixed firms do not prove to be more profitable than state owned companies, full private ownership is a necessary condition for efficiency gains.
Boardman and
Vining (1992) Canada 1986 RegressionOLS Partially privatized companies are more profitable than companies fully owned, there is an ownership effect that can be isolated from the competition effect.
Chen, Firth, Xin and Xu (2008)
China
1996-2000 RegressionOLS When control is transferred to a private company there are positive effects on performance. When the transfer is made to an entity controlled by the Government there are no significant changes in performance. Claessens and
Djankov (1999)
Czech
Republic 1992-1997 RegressionOLS Greater concentration of ownership is associated with higher levels of profitability and productivity. Foreign investment and investment that is not associated with banks contribute more to performance. Dewenter and Malatesta (2001) 500 largest non US industrial firms
1981-1994 Regression, OLS Mean difference test
Results show significant improvements in profitability and a sharp decrease in debt and labor intensity, both in the short-term and the long-term. D'Souza and Megginson (1999) 28 industrialized countries
7
Authors Country(ies)
analyzed periodTime Methodology Main conclusions
D'Souza, Nash and Megginson (2001) 29 industrialized countries
1961-1995 difference testMean Restructuring and changes in corporate governance are determinant for performance improvements. Foreign investment contributes to performance improvements but also has higher levels of debt associated. Friedman, Gray, Hessel and Rapaczynski (1999) Czech Republic, Hungary and Poland 1990-1993 OLS Regression
Privatized firms that remain controlled internally rarely begin restructuring processes, while firms that admit new shareholders grow faster.
Gupta (2005) India
1990-2000 Regression, OLS Mean difference test
Growth rates associated with productivity and profitability increase significantly while sate participation decreases.
Gupta and
Dinc (2011) India 1990-2004 RegressionOLS Deciding which companies to privatize will depend on a combination of financial characteristics and specific electoral considerations.
Harper (2002) Czech
Republic 1991-1994 difference testMean Results suggest the existence of a seasoning effect. The success of a privatization process requires preparation and favorable political and economic conditions.
Huang and
Wang (2011) China 1996-2005 Regression, OLS Mean difference test
As long as the Government holds a stake in the company that enables it to retain control, the organization will not function as a private company. Authors suggest a concept of ultimate privatization.
Kang and Kim
(2012) China 1994-2002 Generalized Methods of Moments
8
Authors Country(ies)
analyzed periodTime Methodology Main conclusions
La porta and López-de-Silanes (1999)
Mexico
1983-1991 difference testMean Layoffs are an important source of performance improvement. However, before privatization, state owned companies worked with excess workers and wages exceeded market values. Majumdar
(1996) India 1973-1989 Efficiency scores State owned companies are less efficient than mixed enterprises and private firms. Mixed companies prove to be less efficient than private firms.
Megginson, Nash and van Randenborgh (1994)
18 Countries
1961-1989 difference testMean Results show improvements in real output, capital investment, dividend payment and a significant decrease in debt levels. While a significant change in executives was observed, no evidence of a reduction in the level of employment was found. Megginson and Netter (2001) Non-transition and transition economies Existing literature until 2001
Survey Results show significant improvements in output, efficiency, profitability and investment as opposed to a significant debt reduction after the privatization process, both for transition and non-transition economies.
Omran (2004) Egypt
9
Authors Country(ies)
analyzed periodTime Methodology Main conclusions
Sun, Tong and
Tong (2002) China 1994-1997 regresssionOLS The authors suggest the existence of an inverted U-shaped pattern between state ownership and firm performance, where an optimal combination between state ownership and private investors might exist.
Tian (2000) China 1998 Propose a theoretical
model
Performance of private firms is significantly higher than performance of partially privatized firms. Additionally, the researcher concludes that in most cases company value decreases in the presence of a state participation.
Wang (2005) China
1994-1999 Regression, OLS Mean difference test
Ownership concentration has a different impact depending on the type of shareholder. Private participation and domestic entities’ participation are significantly associated with performance improvements, while state participation does not seem to provide any changes.
Wei, Varela, D’Souza and Hassan (2003)
China
1990-1997 difference testMean Privatized significant improvements in firms have profitability and firms with more than 50% of private equity show superior results when compared with companies in which Government retains control.
10
3 – Hypotheses
3.1. Before-after performance comparison.
The hypothesis that there is an improvement in company performance after the
privatization process takes place will be tested. Following the literature presented in the
previous section, we can expect performance improvements after the privatization
process. The results for our sample of European companies should be in line with most
of the studies in this subject that report significant improvements after selling shares to
private investors. Privatizing companies reduces state intervention, thus contributing for
more competition. To succeed without sate protection companies need greater managerial
accountability and a results oriented strategy, requirements that should improve
performance in the long run (Vickers and Yarrow, 1991).
H1 - Performance is higher in privately owned firms.
3.2. Firm performance as a positive function of private ownership.
In our analysis we will test whether increasing private participation can be linked
to improvements in company performance. As already mentioned private participation
increases at the expense of a decrease in state participation. Consequently, we can expect
less intervention in company’s management and a growing ability to follow performance
strategies over the traditional political objectives (Gupta and Dinc, 2011). Therefore, an
increase in private investment should have a positive impact in company performance.
This hypothesis has been tested in the existing literature with successful results for a
11
of private investment (Gupta, 2005). We will try to verify the existence of similar results
for our sample of European companies.
H2 - Firm performance is a positive function of the level of private ownership.
3.3 Inverted U-shaped pattern: Private ownership and firm performance.
Some authors suggest the existence of an optimal combination between state
participation and private equity in order to maximize the performance of privatized firms
(Sun, Tong and Tong, 2002). This approach questions if the full privatization option, that
gathers a wide consensus among researchers regarding better performance (Boardman
and Vining, 1989), is the best solution for the previously sate owned companies. Sun,
Tong and Tong (2002) investigate this situation by testing the existence of an inverted
U-shaped pattern between performance and state participation, which can support the
previous line of thought. Their results suggest that an excessive state participation
involves an interference in the organization’s management and control of its destinies.
Too small a stake provides insufficient support to the difficulties that these companies
will be facing, due to market competition. Our study will test the existence of a similar
pattern between performance and private participation for European privatized firms.
H3 - The relationship between performance and private ownership follows an inverted
12
4 – Data
The basis of the present study are non-financial companies owned by the central
governments in Europe that have sold equity to private investors within a defined time
range, in this case between 2001 and 2011. Partial privatization and full transfer of the
company to the private sector have both been considered for this analysis. Working with
partial privatization provides a wider scope on the effects of the privatization process,
according to Gupta (2005), Sun, Tong and Tong (2002) and Tian (2000).
Privatization data was collected from the Privatization Barometer Database, which
provides information about privatizations in Europe. We used this data base to confirm
which companies where privatized within our time range and to collect data, namely the
percentage of equity sold to private investors and the year that the sale took place. All
privatized firms between 2001 and 2011 were selected for this study. For comparison
purposes, and following Gupta (2005), a second group of companies was also selected.
This group consists of 100% state owned companies from the same European context of
the previous companies, with comparable data within the time range of our study. For this
control group, the data source used was the European Public Companies Database from
SPC Network (Strategy and Policy Consultants Network). This database was used to
identify sate owned companies and to verify its shareholder structure.
The sample resulted in two groups of 125 firms (i.e. 250 firms), from 26 European
countries. For each firm, yearly financial statements from 2001 to 2011 were collected,
resulting in an initial sample of 2,500 firm year observations. Accounting information
was collected from the Amadeus database. In some cases it was necessary for analysis
purposes, to complement this information with the annual reports of the companies. These
13
The information collected from financial reporting consists of the value of annual Assets,
annual Liabilities, Equity, current Assets, current Liabilities, net Profit, annual Sales, total
number of employees, operating Income and Income before taxes. Collecting information
for each year of our sample was not possible for a number of companies. For this reason
some firms have more information available than others, leading the panel to be
unbalanced. Additionally, information on workforce for each year of our sample was not
available for some companies. However, this limitation does not prevent us from
following the author's methodology. Missing data regarding employment was estimated
based on time average. After eliminating companies with incomplete information, the
total accounting data collected for this study consists of 2,315 financial years, including
the study group and the control group.
Following Gupta (2005), the present study focuses on two categories of business
performance: profitability and productivity. The impact of the privatization process on
employment levels will also be addressed, as some researchers have questioned the
positive effect of the privatization process in this variable (Malatesta, 2001). Annual sales
and return on assets information is used as proxies for profitability. The annual profit
considered to calculate the return on assets is the Operating Income of each company. We
measure productivity with two ratios, the average product of labor, which is calculated by
the ratio of sales to the total number of workers and the return to labor ratio, calculated
by the ratio of operating income to the number of workers. The total number of workers
in each year will be used to assess the impact of the privatization process on employment.
The use of debt at each moment is calculated by the ratio between total liabilities and total
assets value, providing information on possible changes in financing patterns for each
company. We further control for the size of the company measured by the total book value
14
Some of the variables used in the study are presented as logarithms in order to
control for skewness in the data. Description of main variables used in this study and the
source from where the information has been collected is presented in table II. Table III
presents descriptive statistic of those variables.
Table II – Variables description and information source
Variables Description Source
assets_log Logarithm of the book value of assets as of the end Amadeus/company
of fiscal year, reported by the firm. reports
average Ratio of annual sales to Labor. Amadeus/company
product reports
debt/assets Ratio of total liabilities to annual assets. Amadeus/company
reports
employees_log Logarithm of the total number of employees at the Amadeus/company
end of the year reports
priv Variable that lies between 0 and 100, measuring the Amadeus/SPC
the percentage of equity that is private in a firm in a Database given year.
roa_log Logarithm of the Ratio of annual operating income Amadeus/company
to annual assets plus one. reports
return to labor Ratio of annual operating income to labor. Amadeus/company
reports
sales_log Logarithm of the annual sales generated by an Amadeus/company
enterprise from its main activity. reports
15
Table III – Descriptive statistics
Variables Obs (firms) Mean Std. Dev. Min Máx
Panel A: Privatized Firms
assets (millions) 1,225 (125) 13,900.00 33,000.00 1.60 263,000.00
average product 1,225 (125) 449.42 802.98 1.20 10,520.56
debt/assets 1,225 (125) 0.57 0.23 0.02 2.89
employees 1,225 (125) 22,662.91 54,485.40 13.00 502,763.00
priv 1,225 (125) 0.40 0.34 0.00 1.00
roa 1,225 (125) 0.07 0.12 -0.56 0.83
return to labor 1,225 (125) 70.13 193.93 -330.17 2,575.61
sales (millions) 1,225 (125) 7,404.31 18,100.00 0.57 167,000.00
Panel B: State owned Firms
assets (millions) 1,090 (125) 2,816.66 10,900.00 0.03 97,700.00
average product 1,090 (125) 338.05 803.60 0.00 16,958.30
debt/assets 1,090 (125) 0.57 0.43 0.00 3.54
employees 1,090 (125) 6,680.41 18,985.51 2.00 156,529.00
roa 1,090 (125) 0.03 0.16 -3.51 0.74
return to labor 1,090 (125) 58.91 305.88 -1,892.34 5,685.01
sales (millions) 1,090 (125) 839.64 2,263.84 0.00 23,800.00
Panel C: All firms
assets (millions) 2,315 (250) 8,660.42 26,200.00 0.03 263,000.00
average product 2,315 (250) 396.98 805.02 0.00 16,958.30
debt/assets 2,315 (250) 0.57 0.34 0.00 3.54
employees 2,315 (250) 15,137.67 42,468.67 2.00 502,763.00
priv 2,315 (250) 0.21 0.32 0.00 1.00
roa 2,315 (250) 0.05 0.14 -3.51 0.83
return to labor 2,315 (250) 64.85 252.90 -1,892.34 5,685.01
sales (millions) 2,315 (250) 4,313.38 13,600.00 0.00 167,000.00
Notes: This table reports descriptive statistics of the variables used in the study. All data was obtained from the Amadeus database and the companies’ financial reports. Refer to table II for variables definitions. All values are in thousands of euros unless stated otherwise.
This table includes both privatized companies and companies completely owned
by the state. The number of observations corresponds to the number of financial years
16
followed by the standard deviation to evaluate dispersion around de mean value.
Minimum and maximum values are also presented to evaluate the range of each variable.
We can observe that European privatized firms are quite big, with an asset value average
of 13,900,000,000 euros. This value is significantly higher than the asset value average
of 2,816,660,000 euros, reported by state owned companies. Privatized companies also
sell more than state owned companies, with average annual sales of 7,404,308,000 euros
compared to 839,637,700 euros of state owned companies. Regarding profitability there
is a 4% difference between the two groups. Privatized companies have a 7% average
17
5 – Methodology
We will use two different approaches to test the proposed hypotheses. To test the
first hypothesis, we investigate changes in performance before and after privatization. In
order to evaluate this transition, the average for each variable is calculated and then the
hypothesis for the mean difference between the two periods will be tested, using the
t-student statistic. The two periods are separated using the first sale of equity to private
investors as a reference. Thus, for the firms in our sample that were privatized, i.e. 125
firms, the first period is comprised with all the yearly observations from the period
beginning in 2001 until the beginning of the year the first sale was made. The second
period is set from that year onwards until 2011.
The second approach, follows Gupta (2005) methodology. In this approach we
evaluate the impact of changes in the percentage of private equity in company
performance by creating the variable Priv. This variable measures the percentage of the
company capital held by private owners at the end of each year. The second hypothesis
is then tested by mean of a baseline panel regression model. We will investigate the
significance of the priv variable explaining each performance measure. The results are
calculated using the following model:
Equation 1: yit = β1 + β2privit-1 + β3debt_assets it-1 + β4assets_log it-1 + eit
Where yit represents each of the independent variables analyzed, more precisely
annual sales, return on assets, labor productivity, return to labor and employment. The
priv variable, as already mentioned, represents the fraction of privately owned capital,
debt_assets is the debt to assets ratio used to evaluate financing patterns and the
assets_log the control variable for firm size. All independent variables are lagged one
18
Finally, the existence of an optimal combination of state participation and private
participation in the ownership structure of a privatized company is investigated (H3). We
follow Sun, Tong and Tong (2002) study to test if this is the case. Using the priv variable
we will check for a maximum absolute value in a quadratic function that combines the
different variables of company performance with the percentage of private shares at each
moment. If the a coefficient of each polynomial function in the form f(x) = ax²+bx+c is
negative, and the b coefficient is positive, this reveals the existence of a maximum
absolute value for the quadratic function. If such a result is found then the inverted
U-shaped pattern hypothesis is accepted. Meaning that there is an optimal combination
between state and private equity that maximizes the performance of the privatized
19
6 – Results
6.1 – Before-after performance comparison
In Table IV we can verify the performance changes before and after the
privatization process for our sample of partially privatized and fully privatized
companies. We can find this methodology in studies like Megginson, Nash and van
Randenborgh (1994) and Boardman, Laurin and Vining (2000). The following results are
obtained by calculating the mean of each variable and testing for the mean difference
between the two periods, using the t-statistic mean difference test. The post privatization
period is defined using the first sale of shares to private investors as a reference.
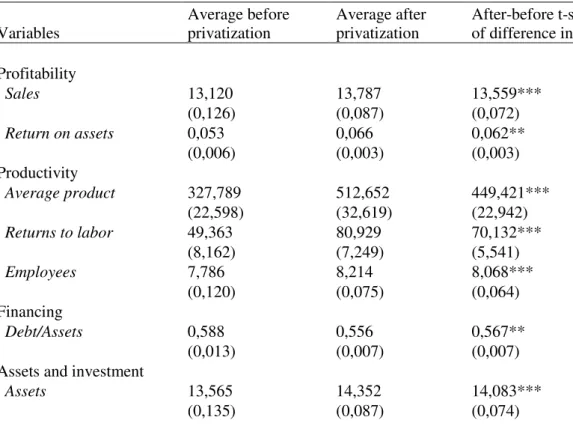
Table IV – T-statistics mean difference
Variables Average before privatization Average after privatization After-before t-statistics of difference in means
Profitability
Sales 13,120 13,787 13,559***
(0,126) (0,087) (0,072)
Return on assets 0,053 0,066 0,062**
(0,006) (0,003) (0,003)
Productivity
Average product 327,789 512,652 449,421***
(22,598) (32,619) (22,942)
Returns to labor 49,363 80,929 70,132***
(8,162) (7,249) (5,541)
Employees 7,786 8,214 8,068***
(0,120) (0,075) (0,064)
Financing
Debt/Assets 0,588 0,556 0,567**
(0,013) (0,007) (0,007)
Assets and investment
Assets 13,565 14,352 14,083***
(0,135) (0,087) (0,074)
20
Results show with a significance level of 1% that the mean difference for the
measures of performance is positive and statistically significant between the two periods,
more precisely for annual sales, average product and returns to labor. Return on assets
shows a similar result at a 5% significance level. These results show that the performance
of companies improved after allowing private investors to enter the capital structure. In
general terms partially privatized and fully privatized firms show an increase in sales,
become more profitable and achieve higher levels of productivity, in line with the results
found in Gupta (2005). This result confirms our hypothesis of better performance
following private investment in companies of our sample.
We can verify that the annual assets show an increase in the post privatization
period. With a significance level of 1% the positive difference between averages of the
two periods is significant. Since Megginson, Nash and Randenborgh (1994) report an
increase in capital investment following the privatization process, this result might be a
sign of investment and indicate that companies grew after the privatization process.
The number of employees also show a significant positive difference after
privatization took place, with a significance level of 1%. This result shows that more
employees where hired following private investment. We could expect a different result
since in most cases the privatized processes implies restructuring of the company, which
can lead to reduction of personnel (Malatesta, 2001). This happens because state owned
companies generally operate with more staff than they need and with above-average
wages (La Porta and Lopez-de-Silanes, 1999). In the present analysis, contrary to these
prior studies, it is found that the level of employment increases after the privatization
process. In this case the effect of reducing personnel due to restructuring may have been
absorbed by the effect of company growth. This might have led to an increase in the total
21
normally encountered in these processes. The annual assets result combined with the
higher numbers off employment seems to give some support to this line of thought. Again
this information is in line with our hypothesis of improvements after the privatization
process. More assets and more employees indicates growth for the companies in our
sample, presumably as a result of better performance.
Regarding the debt/assets ratio which represents the debt utilization of firms, the
average difference is negative and statistically significant. The results show with a 5%
level, a reduction in debt usage patterns after admitting private investors to the ownership
structure. As discussed in the literature review section, most studies show significant
changes in financing patterns, as private investment seems to contribute to a lower level
of debt, bringing new resources both at management level and financial level, to the
companies. The negative difference between the mean values of the two periods of our
sample indicates a reduced level of indebtedness after privatization. This result verifies
the expected reduction in the level of debt that seems to be associated with the
privatization process.
Overall these results are in line with the existing literature and confirm, within the
mean difference test methodology, that there is actually an improvement in performance
of firms after a partial privatization or full privatization process. However, this type of
analysis, before and after privatization performance, faces some limitations regarding
changes in the overall sate of economy during the years of our sample or changes in the
life cycle of some of the organizations (Gupta, 2005). For this reason we will test the
22
6.2 – Private participation
Table V shows the results of the multivariate regression model, i.e. the impact of
changes in private participation in the ownership structure on the different performance
measures used in this study.
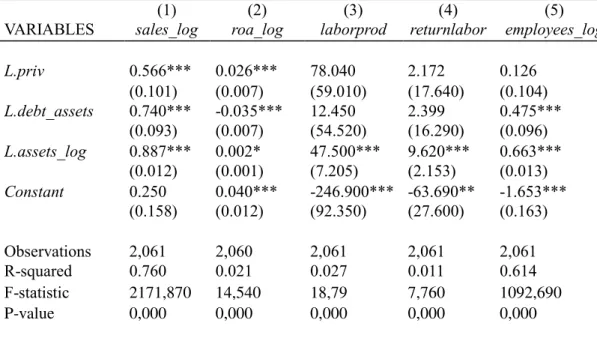
Table V – Panel data regression results
(1) (2) (3) (4) (5) VARIABLES sales_log roa_log laborprod returnlabor employees_log L.priv 0.566*** 0.026*** 78.040 2.172 0.126
(0.101) (0.007) (59.010) (17.640) (0.104) L.debt_assets 0.740*** -0.035*** 12.450 2.399 0.475***
(0.093) (0.007) (54.520) (16.290) (0.096) L.assets_log 0.887*** 0.002* 47.500*** 9.620*** 0.663***
(0.012) (0.001) (7.205) (2.153) (0.013) Constant 0.250 0.040*** -246.900*** -63.690** -1.653***
(0.158) (0.012) (92.350) (27.600) (0.163) Observations 2,061 2,060 2,061 2,061 2,061 R-squared 0.760 0.021 0.027 0.011 0.614 F-statistic 2171,870 14,540 18,79 7,760 1092,690
P-value 0,000 0,000 0,000 0,000 0,000
Notes: Huber-White heteroscedasticity-consistent standard errors. *, ** and *** refer to significance at 10%, 5% and 1% levels respectively. The dependent variable in the first regression (1) is sale_log, measured as the logarithm of annual sales of main activity of the firm. The dependent variable in the second regression (2) is roa_log, measured as the logarithm of return on assets plus one. The dependent variable in the third regression (3) is laborprod, measured as the ratio of annual sales to labor. The dependent variable in the fourth regression (4) is returnlabor measured as the ratio of annual operating income to labor. The dependent variable in the fifth regression (5) is employees_log, measured as the logarithm of total number of employees at the end of the year. Refer to table II for independent variables definitions.
This analysis includes both the study group and the control group where the priv
variable takes the value zero because these companies are completely owned by the state.
The dependent variable y assumes for each regression, the different performance
measures that we want to study. The variable debt_assets represents the use of debt by
the companies and the variable assets_log, the assets logarithm, is used as a control
23
The first regression in Table V represents the impact of changes in private
participation in the annual sales of companies, presented as its logarithm. Results show
that with a significance level of 1% the priv variable is statistically significant for
explaining the changes in annual sales of privatized firms. The positive coefficient reveal
that on average, an 1% increase in the percentage of capital held by private investors lead
to an increase of 57% in annual sales of these companies in the following periods. This
confirms the hypothesis that more private investment has a positive impact in this measure
of firm performance. Regarding the use of debt, this variable is also significant with a
significance level of 1% to explain the dependent performance variable. The positive
coefficient allows us to conclude that the increase in indebtedness of privatized firms has
a positive impact on the annual sales of companies in the next period. This result seems
to indicate that companies gathered resources to finance investments that had a positive
outcome, which may be reflected in increased annual sales. Further, the annual assets of
the companies also show as statistically significant as an explanatory variable for annual
sales with a significance level of 1%. The positive coefficient suggests that increasing
assets have a positive impact on annual sales, which can be explained by the fact that
most of the asset increases result from investment policies. The combination of these three
variables prove to be statistically significant to explain de dependent performance
variable, the F test for the global significance of the model shows Prob > F = 0,000 as a
result. This means that increases in private participation combined with more debt use
presumably for investment, and more assets, contribute to more sales in the following
period.
The second regression of Table V shows the impact of private investment in the
return on assets ratio of the privatized companies. At a significance level of 1% the priv
24
that increasing private participation for our sample results in an increase in returns on
assets in the following period. On average, a 1% increase in the percentage of capital held
by private investors leads to an increase of 2,6% in returns on assets. Again, this confirms
our hypothesis of higher performance as a result of private investment. Regarding the use
of debt this variable assumes a negative coefficient which suggests a decrease in return
on assets on the following period as a consequence of companies borrowing money. This
variable, with a significance level of 1%, proved to be statistically significant to explain
the return on assets of the companies in our sample. This result shows that companies
have to take in to consideration smaller returns on the short term when they gather
financial resources for new investments. The annual assets show as statistically
significant for the dependent variable with a positive impact in the next period, but only
at a 10% significance level. Never the less, this result is in line with the previous
regression. The F test confirms the global significance of this model (Prob > F = 0,000)
which confirms that these variables combined are statistically significant explaining the
dependent performance variable. Return on assets depends on private investment, debt
use and asset value all together. Private investment provides the company with more
resources, equivalent to the value of shares sold to the new investors. This reduces
financial needs and correspondent costs, increasing the results of the company and its
ability to grow. On the other hand, using more debt implies borrowing costs that reduce
the company profitability.
The third regression of Table V examines the relationship between labor
productivity and changes in private investment for the companies in our sample. Changes
in private percentage did not reveal a statistically significant impact on the productivity
of workers within the current analysis. This result does not confirm our hypothesis of
25
may be explained by the need for restructuring, already mentioned in the literature that
privatized firms usually face (Gupta and Dinc, 2011). This restructuring process generally
requires some layoffs in the short term, therefore the positive effect on labor productivity
may require a longer time range than the one presented in our analysis to be confirmed.
The impact of debt use in this performance variable did not show as statistically
significant, which means that for this group of companies the debt use did not seem to
influence the productivity of workers. The annual assets show an opposite result, which
suggests the existence of a significant positive relationship between the company's growth
and the productivity of its workers. The two variables seem to be linked together as more
productive workers brings growth to the company and bigger companies provide better
conditions that may stimulate productivity. The F test suggests that the model is globally
significant explaining the dependent variable. This means that although the two first
variables are not significant in their isolated impact, its combined effect with the others
variables prove to be significant explaining the dependent variable.
The fourth regression in Table V represents the impact of changes in private equity
on the returns to labor. The results are similar to previous regression. If we can’t confirm
the existence of a positive significant impact in labor productivity resulting from private
investment for the time period of our sample, we also shouldn’t expect for such a
confirmation regarding returns to labor because it relies on the same premise, the
employees. Once again this result does not confirm our hypothesis of better performance
regarding returns to labor.
Finally the fifth regression in table V represents the level of employment in the
organizations of our sample. We can observe that changes in the percentage of private
equity in privatized companies of our sample do not prove to be statistically significant
26
level of 1% debt use shows as statistically significant. With a positive coefficient, this
result suggests that an increase in debt level leads to increases in the number of employees
working for the companies in the following period. This may come as a result of financing
investments that have a positive return. This positive outcome leads to the growth of the
organization as a whole, which may result in increases in the employment numbers as
well. The statistically significant result for the annual assets with a positive impact on the
number of employees comes in line with the previous result, strengthening the above
reasoning. The F test confirms that the model is globally significant despite the result of
the priv variable. There isn’t a consensus around the privatization process impact in
employment and related performance measures among the researchers in this subject.
Studies like Gupta (2005) and Boubakri and Cosset (1998) report increases in
employment level and better performance regarding employment performance measures.
On the other hand, studies like La porta and Lopez-de-Silanes (1999), Malatesta (2001)
and D’Souza and Megginson (1999) report that there is a decrease in the employment
level and related performance measures after the privatization process takes place. The
reduction of personnel is actually described as one of the necessary measures to increase
performance in the short term.
Overall these results show that the privatization process leads to significant
improvements in annual sales and in returns to assets of the privatized companies, in line
with the existing literature on this subject. This conclusion is valid both for partial
privatization and full privatization scenarios. On the other hand, the results also show that
the admission of private investors in state owned companies do not seem to bring
short-term improvements to the performance variables related to employment. It would be
necessary to extend our time range of analysis to confirm the effects on these variables.
27
improvement of state owned companies when they become open to private investment.
As already discussed in the literature review, this improvement comes from a greater
ability for the management to define targets for the organization with less state
interference. Managers have more leeway to pursue performance goals and sustainability
instead of the traditional political objectives that guide most of state owned companies
(Gupta and Dinc, 2011). There is more room for a result oriented strategy which in most
cases requires politically unpopular measures. However, these same measures are
essential to the performance of any company.
6.3 – Inverted U-shape pattern
Table VI shows the results regarding the pattern followed by the performance
measures used in this study, when combined with different levels of private participation
in the ownership structure. The goal is to verify the existence of an optimal proportion of
private equity that maximizes the performance of the companies in our sample. This
proportion of private shares would also represent an optimal combination with state
participation, as the rest of the equity would be sate owned. Such a result would confirm
the hypothesis that partial privatization is a better solution than full privatization
28
Table VI – Inverted U-shaped pattern results
(1) (2) (3) (4) (5) VARIABLES sales_log roa_log laborprod returnlabor employees_log Panel A: All firms
L.priv 2.788*** 0.167*** 753.9*** 167.2** 1.135*** (0.328) (0.0283) (254.4) (72.22) (0.362) L.priv2 -2.701*** -0.172*** -821.7*** -200.6*** -1.227***
(0.393) (0.0329) (270.7) (77.15) (0.422) L.assets_log 0.859*** -0.000145 39.02*** 7.550*** 0.651***
(0.0110) (0.00117) (5.688) (1.511) (0.0124) L.debt_assets 0.806*** -0.0305*** 32.56 7.309 0.505***
(0.143) (0.0112) (37.41) (14.88) (0.0930) Constant 0.505*** 0.0566*** -169.4** -44.76** -1.537***
(0.150) (0.0141) (66.51) (19.92) (0.161) Observations 2,061 2,060 2,061 2,061 2,061 R-squared 0.765 0.035 0.032 0.015 0.616 F-Statistic 2348,030 13,940 32,420 20,760 966,090 P-value 0,000 0,000 0,000 0,000 0,000
Panel B: Privatized firms
L.priv 0.802** 0.103*** 964.9*** 272.5*** -0.00278 (0.344) (0.0312) (274.5) (72.60) (0.397) L.priv2 -1.162*** -0.127*** -1,022*** -299.0*** -0.202
(0.411) (0.0344) (288.1) (79.61) (0.449) L.assets_log 0.857*** -0.00222 25.67*** 1.353 0.709***
(0.0105) (0.00167) (7.177) (1.897) (0.0126) L.debt_assets 0.924*** -0.0408** 69.17 16.97 1.078***
(0.182) (0.0182) (79.20) (20.53) (0.186) Constant 1.014*** 0.112*** -39.88 17.41 -2.453***
(0.143) (0.0233) (84.74) (21.80) (0.166) Observations 1,097 1,097 1,097 1,097 1,097 R-squared 0.858 0.026 0.030 0.024 0.738 F-Statistic 2811,640 5,180 19,030 8,960 1207,170 P-value 0,000 0,000 0,000 0,000 0,000
29
The results are calculated using the variable priv, which represents the private
participation in the capital structure of the company at each moment, to build a quadratic
function that relates this information with performance measures (Sun, Tong and Tong,
2002). This type of function enables us to analyze the existence of a maximum or a
minimum absolute value depending on the sign of the coefficients of variables priv and
priv2. Priv2 is the priv variable squared. The calculations follow the presented equation,
where f(x) assumes each performance variable: f(x) = priv² + priv + constant.
Since all the coefficients of variable priv are positive and all the coefficients of
variable priv2 are negative for the sample including all firms, these results confirm the
existence of a maximum absolute value in the function for all the five equations. This
confirms the existence of a potential optimal point that maximizes each performance
measure, which leads to the conclusion that there might be an optimal combination
between private investment and state shares for our sample. This optimal combination
maximizes annual sales, return on assets, returns to labor, labor productivity and
employment, thus confirming our hypothesis. In Panel B of Table VI we can verify similar
results for the sample of privatized companies, except for the variable measuring
employment. As already discussed, there isn’t a consensus around the effect of the
privatization process in the employment level that leads to consistent results. Overall this
outcome is in line with the Sun, Tong and Tong (2002) study that we use as a guide line,
as we can verify by one of the concluding comments of their research: “Too much
government holding of SOE (State Owned Enterprises) shares means too much control
and interference in the economic operations of SOEs. Too little government holding
means too little support from the government to pull the SOEs out from their difficulties”.
These results reinforce the idea that partial privatization may be the best solution
30
2002). An optimal allocation of shares between the two parties seems to combine the
advantages of private management with specific resources of the public sector and still
be effective in reducing excessive intervention by the state and the imposition of political
31
7 – Conclusion
The results confirm the three hypotheses proposed by this study. Companies
privatized reveal superior performance in the period following the first private investment
in the capital structure. Additionally, the performance of privatized companies depends
on the percentage of private investment since it has been confirmed that an increase of
this percentage reflects positively in the performance measures. Finally, there seems to
be an optimal combination between the state participation and private investment that
maximizes the performance of privatized firms, suggesting that state and private investors
can co-exist with valid contributions in the capital structure of previously state owned
companies.
The results referring to employment related performance measures, more
precisely productivity, returns and changes in the total number of employees do not have
a consistent outcome in our analysis. Still, this situation falls within the literature on the
subject as already discussed. Although there is not a significant relationship of these
measures with private investment for our sample, the positive outcome of the remaining
performance measures and the other tests seem to be acceptable to support our
conclusions.
These results for a sample of the European context, which is the scope of this
study, are consistent with the existing literature on the subject, as they confirm an
improvement in company performance resulting from the privatization process that does
not seem to depend on the geographical area in which this process takes place. Therefore,
this study strengthens the general application of the existing knowledge on this subject
that points towards significant improvements resulting from the reduction of state
32
Additionally this study helps to reinforce the need to privatize existing state owned
companies in European rescued countries, given the current context of adversity. This
context is characterized by scarcity of resources, high unemployment, and a scenario of
persistent economic recession accompanied by a high level of taxation due to budgetary
constraints. In this difficult situation the efficiency, sustainability and profitability of
enterprises becomes even more important, especially for those that spend public
resources.
In this study some limitations were found regarding the availability of information
that restricted the full application of the methodology used in Gupta (2005). The
information available on the number of employees in the databases and financial reports
that we used is limited for a number of companies and accounting information was not
available for all the years in our sample. The researcher uses two additional analytical
perspectives, more precisely investment and rotation of directors and evaluates its impact
on company performance. However, given the difficulties in gathering information about
capital expenditures, research and development costs and detailed information about
executives, these features were not implemented in our study. Still, working with the
information available we have tried to make this study and its findings as robust as
possible.
Regarding future research and in coherence with the reported limitations, it would
be important to gather the necessary conditions for the full implementation of the
methodology that constitutes the basis of this study, in order to further strengthen its
conclusions. Additionally, we should consider extending our sample to a larger set of
companies, as more information leads to even more robust conclusions. Using a longer
time range would help to confirm the effects on employment levels and employment
33
process in these performance variables may not be visible within the time range selected
for this study. It would be interesting to compare the application of this methodology in
different contexts, in particular comparing the results of the original study conducted with
a sample of Indian companies with the findings of this study using a European sample.
This comparison could be extended by applying this methodology to other relevant
geographical contexts like China or Russia where the state traditionally has a relevant
position and privatization processes exist in sufficient number for analysis purposes.
All studies seem to confirm that less sate interference leads to better company
performance, this does not necessarily mean a complete absence of state participation.
Whether this positive effect is perceivable immediately or it takes some time to be
identified, in the long run all evidence suggests that performance will have a positive
outcome, regardless of the geographical contexts or the method used to evaluate the
performance changes. Differences among researchers seem to rely more in the scale of
34
References
Boubakri and Cosset (1998). The financial and operating performance of newly privatized firms: evidence from developing countries. The Journal of Finance 53 (3), 1081-1110.
Boardman, Laurin and Vining (2000). Privatization of state-owned firms in Canada: a cross-national comparative analysis. Working paper. University of British Columbia. Vancouver.
Boardman and Vining (1989). Ownership and Performance in Competitive Environments: A Comparison of the Performance of Private, Mixed, and State-Owned Enterprises. Journal of Law and Economics 32 (1), 1-33.
Boardman and Vining (1992). Ownership versus competition: Efficiency in public enterprise. Public Choice 73 (2), 205-239.
Chen, Firth, Xin and Xu (2008). Control transfers, privatization and corporate performance: Efficiency gains in China's listed companies. Journal of Finance and Quantitative Analysis 43 (1), 161-190.
Claessens and Djankov (1999). Ownership concentration and corporate performance in the Czech Republic. Journal of Comparative Economics 27 (3), 498–513.
Dewenter and Malatesta (2001). State-owned and privately owned firms: An empirical analysis of profitability, leverage, and labor intensity. The American Economic Review 91 (1), 320-334.
D'Souza and Megginson (1999). The financial and operating performance of privatized firms during the 1990s. The Journal of Finance 54 (4), 1397–1438.
D'Souza, Nash and Megginson (2001). Determinants of performance improvements in privatized firms: the role of restructuring and corporate governance. Working paper. University of Oklahoma.
Fondazione Eni Enrico Mattei (2003). Privatization Barometer Database. Available at:
35
Friedman, Gray, Hessel and Rapaczynski (1999). When does privatization work? The impact of private ownership on corporate performance in the transition economies.
Quarterly Journal of Economics 114 (4), 1153-1191.
Gupta (2005). Partial privatization and firm performance. The Journal of Finance 60 (2), 987–1015.
Gupta and Dinc (2011). The decision to privatize Finance and Politics. The Journal of Finance 66 (1), 241–269.
Harper (2002). The performance of private firms in Czech Republic. Journal of Banking & Finance 26 (4), 621–649.
Huang and Wang (2011). Ultimate privatization and change in firm performance: evidence from china. China Economic Review 22 (1), March 2011, 121–132.
Kang and Kim (2012). Ownership structure and firm performance: evidence from the chinese corporate reform. China Economic Review 23, 471–481.
La porta and López-de-Silanes (1999). The benefits of privatization: Evidence from Mexico. Quarterly Journal of Economics 114 (4), 1193-1242.
Majumdar (1996). Assessing comparative efficiency of the state-owned mixed and private sectors in Indian industry. Public Choice 96, 1-24.
Megginson, Nash and van Randenborgh (1994). The Financial and Operating Performance of Newly Privatized Firms: An International Empirical Analysis. The Journal of Finance 49 (2), 403–452.
Megginson and Netter (2001). From state to market: A Survey of Empirical Studies on Privatization. Journal of Economic Literature 39 (2), 321-383.
Omran(2004). The performance of state owned enterprises and newly privatized firms: Does privatization really matter? World Development 32 (6), 1019–1041.
Strategy and Policy Consultants Network (2003). Database of State Owned Enterprises In The European Union. Available at:
36
Sun, Tong andTong (2002). How does government ownership affect firm performance? Evidence from China’s privatization experience. Journal of Business Finance & Accounting 29 (1-2), 1–27.
Tian (2000). Property Rights and the Nature of Chinese Collective Enterprises. Journal of Comparative Economics 28 (2), 247–268.
Vickers and Yarrow (1991). Economic Perspectives on Privatization. Journal of Economic Perspectives 5 (2), 112-132.
Wang (2005). Ownership and operating performance of Chinese IPOs. Journal of Banking & Finance 29 (7), 1835–1856.
37
List of tables
Table
I – Summary of literature review………5
II – Variables description and information source………14
III – Descriptive statistics……….15
IV – T-statistics mean difference………..19
V – Panel data regression results………..22
38
Agradecimentos
Este trabalho não estaria completo se nele não constasse o agradecimento aos
meus pais. Sem eles o meu percurso académico não teria sido possível. Muito obrigado
pelo apoio, pelo exemplo e por me proporcionarem, com muito trabalho e dedicação, a
liberdade de fazer as minhas próprias escolhas.
Agradeço também ao Professor Paulo Francisco o tempo e a dedicação que