Printed version ISSN 0001-3765 / Online version ISSN 1678-2690 www.scielo.br/aabc
Atmospheric particle dry deposition of major ions to the South Atlantic coastal area observed at Baía de Todos os Santos, Brazil
STELYUS L. MKOMA1,2,3, GISELE O. DA ROCHA1,2, JOSÉ S.S. DOMINGOS2, JOÃO V.S. SANTOS1,4,
MANUELA P. CARDOSO2, ROGERIO L. DA SILVA2 and JAILSON B. DE ANDRADE1,2
1
Instituto Nacional de Ciência e Tecnologia de Energia e Ambiente /INCT-E&A, 40110-040 Salvador, BA, Brasil
2
Instituto de Química, Universidade Federal da Bahia/UFBA, Campus de Ondina, Ondina, 40170-290 Salvador, BA, Brasil
3Department of Physical Sciences, Faculty of Science,
Sokoine University of Agriculture (SUA), P.O. Box 3038, Morogoro, Tanzania
4
Instituto Federal de Educação, Ciência e Tecnologia Baiano, Caixa Postal 66, Campus Teixeira de Freitas, 45995-000 Teixeira de Freitas, BA, Brasil
Manuscript received on June 3, 2013; accepted for publication on November 26, 2013
ABSTRACT
The coastal atmosphere adjacent to large urban areas can be strongly affected by the emission of air pollutants, among them, major ions species. In this study, the chemical composition and sources of carboxylates and other water-soluble ions in fine and coarse aerosols as well as estimates of particle dry deposition fluxes were studied at a tropical coastal site affected by an urban environment. The mean concentrations of the total carboxylates were 78 ng m-3 in fine fraction and 81 ng m-3 in coarse fraction of particulate matter (PM). The corresponding values for the total inorganic ions were 2143 ng m-3 and 4880 ng m-3 respectively. Main sources for fine particles were: (i) photochemical formation of carboxylic acids in vapor phase and a posterior gas-to-particle conversion onto sea salt particles; (ii) emissions from anthropic sources with long range transportation processes; and (iii) the interchanging of volatile species among atmospheric phases. In turn, for coarse particles, the predominant sources were: (i) gas-phase species and ab/adsorbed onto pre-existing particles afterwards; (ii) primary emission of coarse particles from anthropogenic sources; and (iii)
sea salt spray and/or soil resuspension. Finally, particle dry deposition was a very important mechanism representing air-to-sea fluxes of major species.
Key words: particle dry deposition, PM, major ions, tropical atmosphere, Baia de Todos os Santos bay, Brazil.
Correspondence to: Jailson Bittencourt de Andrade E-mail: jailsong@ufba.br
INTRODUCTION
The coastal atmosphere adjacent to large urban areas can be strongly affected by the emission of air pollutants (Gao et al. 1996, He and Balasubramanian 2008, Fang et al. 2006). The major airborne pollutants include the ionic species such as SO42-, NO3-, Na+, and NH4+, among others,
such ionic species in particulate matter in the coastal atmosphere could not only enhance the air-to-sea deposition fluxes to coastal waters and affect the quality of the coastal ecosystem, but also deteriorate air quality and influence human health (He and Balasubramanian 2008).
Particulate matter (PM) with aerodynamic diameter less than 2.5 µm (PM2.5) exhibits stronger relation with health than those with aerodynamic diameters less than 10 µm (PM10), although some other studies have reported a strong potential of PM10 to human health (Salma et al. 2002, Kappos et al. 2004, Verma et al. 2010, Kumar et al. 2010). Organic acids and water-soluble inorganic ions are important groups of compounds identified in the atmospheric aerosol (Jacobson et al. 2000, Bourotte et al. 2007). More attention has been paid to carboxylates due to their potential to modify the hygroscopic properties of atmospheric particles, including cloud condensation nuclei activity (CCN) and hence to change global radiation balance (Kerminen 2001, Peng et al. 2001). Major water-soluble inorganic ions are associated with atmospheric visibility degradation, adverse human health effects, and acidity of precipitation (Dockery and Pope 1996, IPCC 2007, Lee and Hieu 2013, Zhang et al. 2011). Carboxylates and water-soluble ions in variable concentrations have been reported in urban, rural and marine atmosphere (Kawamura and Sakaguchi 1999, Kerminen et al. 2000, Nicolas et al. 2009). Some sources origins are fossil fuel combustion (Narukawa et al. 1999), sea spray, traffic and industrial emissions and photochemical oxidation of precursors from anthropogenic and biogenic origins (Kawamura and Sakaguchi 1999, Limbeck and Puxbaum 1999, Chakraborty and Gupta 2010). Other sources for the carboxylic acids in marine atmosphere include in-cloud and heterogeneous formations (Warneck 2003). The chemical composition of fine (PM2.5) and even that of coarse (PM10) aerosols are important to gain insight into sources, about their toxicity, and to evaluate the effectiveness of abatement strategies
for relevant emission sectors. In different parts of the world carboxylic acids and ionic concentrations in the PM2.5 and PM10 aerosols have been studied (Limbeck et al. 2001, Limon-Sanchez et al. 2002, Kawamura and Yasui 2005, Karthikeyan and Balasubramanian 2006, Mkoma et al. 2009). However, studies on the South Atlantic region or in Brazil are scarce (Kubátová et al. 2000, Allen et al. 2004, da Rocha et al. 2005, Bourotte et al. 2007, Mariani and de Mello 2007, Kundu et al. 2010). Nevertheless, studies about major ions in tropical atmosphere are few and some lack of knowledge still remains. In this study, the main objective was to provide an insight into the levels and source profiles of carboxylate and water-soluble inorganic ions in PM2.5 and PM10 size fractions in South Atlantic by observing them in the Baía dos Todos Santos bay, Brazil.
EXPERIMENTAL
SAMPLING SITE AND AEROSOL COLLECTION
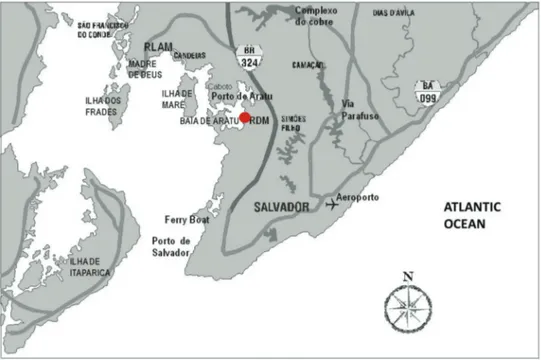
Baía de Todos os Santos Bay (BTS), Northeastern Brazil, is the second largest Brazilian bay (1233 km2). A large urban area (about 3 million inhabitants), and an important industrial complex (petrochemical, chemical, textile, fertilizers, paper mill, etc.) are loca-ted in the BTS basin. The sampling site considered in this study is located in the Baía de Todos os Santos bay (Fig. 1). An intensive sampling campaign was carried out at a coastal site in Base Naval de Aratu (BNA) (12°48'19.0"S; 38°29'54.2"W, at sea level) from the 13th to 27th of September 2010. Possible
aerosol sources include harbour activities, industries and marine and urban pollution. Aerosol samples were collected using two high volume samplers (Energética, Brazil, flow rate 1.13 m3 min-1)
with Whatman quartz fiber filters (20.3 cm x 25.4 cm; Whatman Inc., Maidstone, UK) which were pre-baked at 550 °C in a furnace to eliminate any adsorbed organics before use. The sampling was carried out approximately in 24 h intervals and exchange of filters during the sampling periods was done at 7:00 AM. A total of 15 sets of samples were
collected for each sampler and used in this study. After sampling, the actual samples were folded face to face, placed in polyethylene plastic bags, and kept frozen at -4 °C during storage then transported cool to the laboratory for analysis. All the procedures were strictly quality-controlled in order to avoid any possible contamination of the samples.
Fig. 1 - Map of Baía de Todos os Santos bay, showing the sampling site (BNA) of this study.
The meteorological data, including ambient temperature (22.5-24.9°C), relative humidity (72-84%), solar radiation (145-340 W m-2), and wind
speed (3.9-8.0 m s-1) for the sampling days are shown in Fig. 2a. Backward air mass trajectories were calculated during the whole sampling events by using the NOAA HYSPLIT database (2011 http://ready.arl.noaa.gov/HYSPLIT.php). A one-dimensional trajectory was calculated starting 96 h before the arrival time (00:00 UTC) and 500 m a.g.l. (Fig. 2b). During all sampling times, air trajectories were of typically oceanic contribution.
CHEMICAL ANALYSIS
For particulate mass measurements, the filter samples were weighed before and after sampling
with an analytical microbalance Mettler Toledo MX5 (reading precision at 1 μg). Before weighing, the filters were conditioned in a chamber equipped with hydro-thermometer clock at a temperature of 20 °C and the relative humidity of 40% for 48 h and the weightings were done under these conditions.
Chromatograph (modules model ICS 1100 for cations and ICS 2100 for anions) with conductivity detector and 100 µL sampling loop. Chromatographic methods for determination of both cationic and anionic species followed a modified procedure reported by Mkoma et al. (2014). Briefly, carboxylate and water-soluble anions were determined by using AS11-HC analytical column (2 x 250 mm, Dionex, USA), an AS11-HC guard column (2 x 50 mm, Dionex, USA) and anion self-regenerating suppressor (ASRS-300, 2 mm membrane thickness, Dionex, USA) in electrolytic mode. The eluent gradient program was gradually
increasing from 0.6 to 8.0 mmol L-1 KOH over 35 minutes. The anionic analysis was operated under a flow rate of 0.38 mL min-1 and with a suppressor
current of 36 mA. In turn, the determination of water-soluble cations was performed utilizing a CS16 analytical column (3 x 250 mm, Dionex, USA) with a CG16 Guard column (3 x 50 mm, Dionex, USA) and a cation self-regenerating suppressor (CSRS-300, 2 mm membrane thickness, Dionex, USA) in electrolytic mode. An eluent of 17.5 mmol L-1 H2SO4
in isocratic mode at a flow rate of 0.35 mL min-1
The injection volume during all analyses was 25 µL. Peak identification was confirmed based on a match of IC retention times and standard samples. The limit of detection (LOD) corresponded to a range of 0.38 to 0.81 pg m-3 for carboxylates, 0.38
to 1.1 pg m-3 for water-soluble anions and 1.0 to 4.0 pg m-3 for cations. Precision was better than
5% for all species in this study.
STATISTICAL ANALYSES
Experimental data were analyzed by calculating the Spearman’s correlation coefficients using STATISTICA 6.0 (Statsoft, USA) program. In addition, Principal Component Analysis (PCA) and Cluster Analysis (CA), using Ward’s Method and Euclidian distances, were performed. The calculations were performed using the individual experimental values for each sample.
RESULTS AND DISCUSSION
PMMASS CONCENTRATIONS
Table I shows the mean PM mass concentrations, associated standard deviations and ranges as derived from the high volume samplers. The mean concentrations of PM2.5 and PM10 masses were 13.9 µg m-3 and 24.8 µg m-3, respectively, with
a PM2.5/PM10 mean mass ratio and standard deviation of 0.6 ± 0.2. Currently in Brazil, the daily and annual average standard limit values for inhalable particulate matter are 150 and 50 µg m-3
respectively (CONAMA 1990). The mean for the PM2.5 and PM10 mass concentrations at Base Naval de Aratu in Salvador were below these average limit values. However our data were in line with the levels reported in other cities in Brazil (Bourotte et al. 2007, Mariani and Mello, 2007). Compared with the United States Environmental Protection Agency (US EPA) the average daily limit value in ambient air of 65 µg m-3 for PM2.5 and 150 µg m-3 for PM10 (US EPA 1997), almost 21% of the PM2.5 and 17% of the PM10 mass concentrations from this study
were lower than the standards, showing that particulate pollution, was not a problem during our sampling campaign in the study area.
CONCENTRATIONS OF CARBOXYLATE AND INORGANIC IONS
The mean and associated standard deviations, minimum and maximum concentrations of the carboxylate and inorganic ions are presented in Table I.
The total concentrations of the carboxylates ran-ged from 57 to 121 ng m-3 with a mean of 78 ng m-3 in
PM2.5 size fraction, and from 60 to 122 ng m-3 with
a mean of 81 ng m-3 in PM10 fraction. Acetate was
the most abundant species with mean concentrations of 31 ng m-3 in the PM2.5 and 34 ng m-3 in the PM10
aerosols ranging from 26 to 46 ng m-3. Its relative abundance in the total measured carboxylate ions in PM2.5 and PM10 fractions was 40% and 17% respectively. The second most abundant carboxylate ion, on a mean, was oxalate which accounts for nearly 28% and 13% of the total carboxylates concentrations in the PM2.5 and PM10 aerosols. The malonate, formate, and pyruvate were also found in substantial amount but succinate was the least abundant accounting for about 1-2% of the total carboxylates in the two size fractions. It should be noted that among the analysed dicarboxylates, oxalate was the most abundant as reported in other studies (Mochida et al. 2003, Warneck 2003). However, acetate, oxalate and malonate together contributed 80% to the total carboxylates PM2.5 and PM10 masses while the total carboxylates accounted for 0.56% and 0.33% to the total PM2.5 and PM10 mass, respectively. In comparison to some other studies, the mean concentrations of the measured carboxylate ions were lower to those reported in costal urban atmosphere and marine sites. For instance, Kawamura and Yassui (2005) have studied atmosphere of Tokyo and have found the following levels at 233, 52 and 53.9 ng m-3,
and acetate, respectively. Da Rocha et al. (2012) in a study of atmosphere of the São Paulo city found 70.4; 10.3; 150, and 33.6 ng m-3for formate, acetate, oxalate and succinate, respectively.
At BNA in Salvador, among possible sources, photochemical reactions during the daytime appeared to be an important source of formate, as found in literature (Allen et al. 2004, da Rocha et al. 2003, 2005), whereas acetate appeared to be mainly from primary sources such as industrial and vehicular emissions. It is noteworthy to mention that Brazilian gasoline possesses around 22-26% of hydrated ethanol and it is often called “gasohol”. Moreover, one such particularity of light-duty vehicles in Brazil (56 % of vehicular fleet) is “flexfuel” which run regularly with any proportion of hydrated ethanol-to-gasohol (DENATRAN 2013). Those specific details would explain the higher levels of acetate found in this study.
The concentrations of the individual inorganic ions in both size fractions were in the order of SO42–
> Cl– > NO
3– for the anions while for the cations Na+
was the most abundant and NH4+ the least abundant
cationic species. On an average SO42– and Cl–
accounted for 16% and 6.7%, respectively, of the total water-soluble ions in PM2.5 mass and 11% and 10%, respectively, of the PM10 mass. Other ions were in the order of Na+ > Mg2+ > K+ > Ca2+ in the
PM2.5 fraction and Na+ > K+ > Ca2+ > Mg2+ in the
PM10 fraction. The NH4+ was the minor contributor
(1.0 –1.4%) to the total ions in both size fractions. As for the higher concentrations of Na+ and Cl– at BNA, it is presumably mainly derived from sea salt, as the sampling site was about less than 1 km from the southern Atlantic Ocean and all backward air mass trajectories during this sampling campaign were essentially oceanic. For SO42– the higher
levels could be attributed to secondary formation
Species PM2.5 PM10
Mean SD Min. Max. Rel. Ab. Mean SD Min. Max. Rel. Ab.
PM mass (µg m-3) 13.9 2.7 8.5 17.2 - 24.8 5.9 17.8 39.7
-Carboxylate ions
Formate 7.9 2.3 5.4 14 9.9 9.1 2.8 6.1 15 4.3
Acetate 31 2.8 26 35 40 34 5.0 27 46 17
Oxalate 23 8.6 12 42 28 28 8.7 17 45 13
Malonate 12 4.0 8.6 20 15 11 1.6 9.2 12 4.8
Succinate 1.9 2.1 0.3 5.9 2.0 1.9 1.5 0.2 3.5 0.90
Pyruvate 6.7 1.3 4.4 9.5 8.5 7.0 1.9 3.4 12 3.4
∑carboxylates 78 18 57 121 81 18 60 122
inorganic ions
NH4+ 30 8.5 18 54 1.4 51 10 35 72 1.1
NO3– 112 37 62 184 5.2 175 64 102 303 3.7
SO42– 350 148 206 730 16 561 137 368 882 12
Cl– 143 42 82 225 6.9 511 146 341 842 10
Na+ 899 179 683 1192 42 2431 551 1649 3603 49
K+ 180 43 126 264 8.4 571 122 387 763 12
Mg2+ 315 69 253 472 15 274 67 202 413 5.6
Ca2+ 113 18 82 150 5.3 311 69 214 454 6.6
∑inorganic ions 2143 295 1604 2535 4880 841 3621 6699
TABLE I
Mean concentrations and associated standard deviation, ranges (ng m-3) and relative abundances (%) of carboxylate and inorganic
processes (such as gas-to-particle conversion) (Allen et al. 2004, Campos et al. 2007). The sea salt ratios were calculated for each inorganic ion using Na+ as a reference species, assuming all Na+ to be
of marine origin. The ratios for SO42–/Na+, Cl–/Na+,
K+/Na+, Mg2+/Na+ and Ca2+/Na+ in PM2.5 were 0.42 (0.25), 0.17 (1.81), 0.20 (0.04), 0.35 (0.04), 0.13 (0.12) respectively. The corresponding values in PM10 aerosols were 0.24 (0.25), 0.22 (1.81), 0.24 (0.04), 0.11 (0.04), 0.13 (0.12) respectively. The values in the parentheses represent the average ratios for each ion in seawater (Brewer 1975). Larger ratios of ions indicate the incorporation of non-marine constituents in aerosols. The small ratio of Cl–/Na+ could be due to modifications caused by
non-marine constituents. In fact, the small ratio of Cl–/Na+ could be caused by the modifications
suffered by sea salt aerosol by incorporation non-marine sources. The chloride loss may be explained by the heterogeneous reaction of airborne sea salt with acidic gases and aerosol species (Millero 2006, Allen et al. 2004). High K+/Na+ and Mg2+/ Na+ ratios also show a non-marine source. This
source could be either anthropic such as industrial (maybe a fertilizer plant present in BTS basin) or dust resuspension. But if dust resuspension were this source, the Ca2+/Na+ ratio would also be
higher than seawater ratio and it is not. Therefore, it seems dust resuspension is a negligible source and the additional non-marine source for K+and
Mg2+ seems to be industrial and Na+ and Ca2+ are
originated from sea salt spray.
Considering that besides sea salt spray, there are no other important sources for Na+ in the
site under study, we tentatively suggest that the lower Cl–/Na+ mean ratios than the sea-water
ratio indicate that a minor fraction of Na+ may be contributed from mineral dust resuspension.
FINE TO PM10RATIOS AND TIME SERIES FOR SELECTED
SPECIES
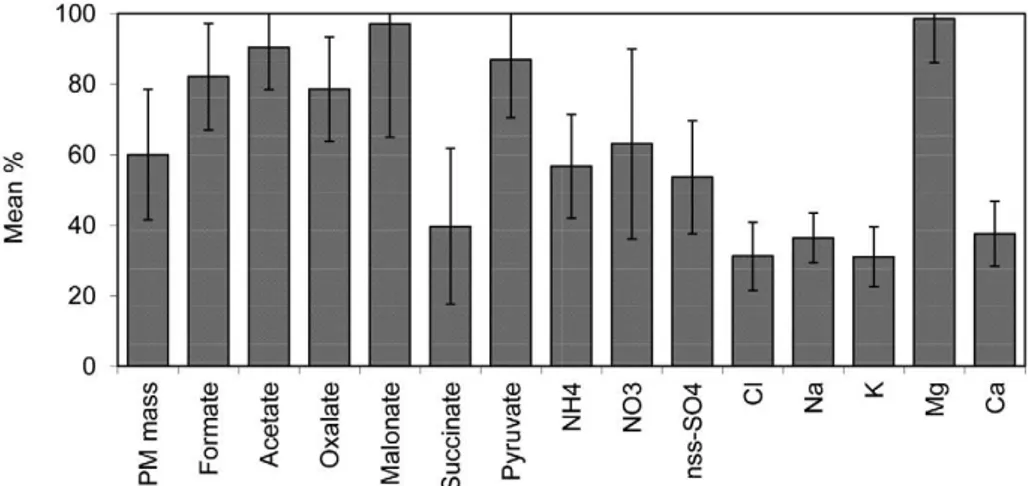
The average fine (PM2.5) to PM10 percentage ratios and associated standard deviations for the PM mass, carboxylate and water-soluble ions are shown in Fig. 3. The ratios were calculated on the basis of the data for the PM2.5 and PM10 samples taken in parallel and then averaged over all samples from the campaign. The mean fine to PM10 ratios for all species with the exception of those for succinate, Na+, K+, Ca2+ and Cl– were predominantly associated
with the fine size fraction (for more than 50%). For most carboxylate ions, the higher ratios (even larger than 80%) are considered to be attributed from secondary organic aerosols (SOA), vehicular and
industrial emissions. The different size distributions between formate and/or acetate and oxalate could be related to their different physical characteristics. Formate and acetate in the PM2.5 fraction could easily volatilize (more volatile than oxalate) to the gas phase, part of which could be absorbed on the PM10 particles. The higher mean temperature (24 °C) during sampling period at BNA might be the main reason for the found PM2.5 to PM10 ratios for the carboxylate ions.
For the water-soluble inorganic ions, as expected, the sea salt species (Na+, Cl-) and the indicator species for crustal matter (Ca2+) were
predominantly (for more than 62%) associated with the PM10 size fraction. Ammonium, NO3–,
and SO42– were mainly present in the fine size
fraction suggesting that these species originated from anthropogenic high temperature sources and/ or gas-to-particle conversion. About half of the PM10 SO42– and most of the fine SO42– were
non-sea salt (nss) SO42–. The nss-SO42– is probably due
to oxidation of SO2, which is predominantly from
anthropogenic origin (e.g. burning of S-containing fossil fuels and non-ferrous smelters). Potassium was associated with the PM10 particles (about 70%) suggesting vegetative emissions and crustal source.
TIME SERIES OF THE PMMASS AND SELECTED AEROSOL
SPECIES
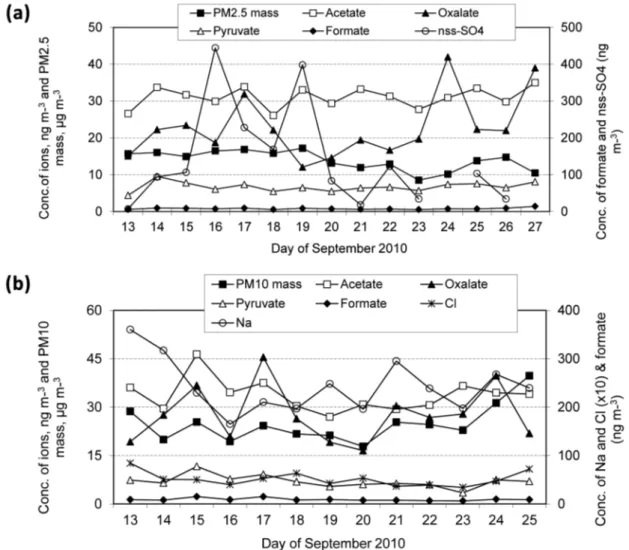
The time series of the PM mass, selected carboxylate and inorganic ions in PM2.5 and PM10 size fractions as a function of sampling time is shown in Figs. 4a and 4b. In these figures the oxalate in both size fractions, nss-SO42– in the PM2.5 and Na+ in the
PM10 aerosols showed a pronounced variation during the campaign. Other species showed slight variations during sampling period while that of formate and pyruvate in both size fractions and Cl− in the PM10 aerosols, there was no clear variation that could be noted. The observed behaviour of the species during sampling period could be a result from the variations in sources strengths and in
meteorological conditions, such as mixing height and relative humidity (RH). Additionally, the high RH (mean: 76%) during the campaign could serve as a removal mechanism hence lead to a daily variation in carboxylate (and also inorganic) ion levels.
In this study, the concentrations of oxalate were higher to a factor of 3 than that of formate during the sampling period. On the other hand, the concentrations of acetate were higher than those of formate and oxalate. The ratio of oxalate to total dicarboxylates can be used to evaluate the aging process of organic aerosols (Kawamura and Sakaguchi 1999). In this study, the oxalate/ total dicarboxylates ratio did not vary significantly during the sampling period (range 0.48−0.98), indicating that the aerosols emitted from various sources and transported to this site were equally aged. Since there was RH quite high during the whole period of the campaign, it is assumed that oxalate was also produced in aqueous phase during the aging process. Aqueous phase chemistry in aerosol and/or cloud droplets is important in the production of oxalate (Warneck 2003).
ION BALANCE
Ion balance for both size fractions of PM from BNA was done (Table II). Results of Σanions/cations for PM2.5 and PM10 were well
below one unity. This indicates that there is a quite reasonable anion deficiency in PM, thus suggesting that positive charges from cations are not totally neutralized by negative charges from anions. This can happen for some reasons: it may represent the contributions from other weak acidic species such as CO32- and/or HCO3- (not
measured in this study) and / or this apparent anion deficiency. The anion deficiency can indicate that the PM from BNA is, in fact, basic. Since we did not find high enough NH4+ atmospheric
in a lesser extension, soil dust resuspension, can probably act as neutralization agents of acidic gas phase of the atmosphere. In fact, evidences of it are found in previous studies in a nearby area of BTS by Campos et al. (2007). In these studies it was shown that sea spray salts present in the basic aerosol were responsible for up to 81 % of rainwater samples neutralization and that acid gaseous species emitted from anthropic sources were condensed onto sea spray aerosol. These explanations are in good agreement with our findings in the present study. This may be a good explanation for the excess of positive charges (and consequently the amount of anion
deficiency) found by Σanions/Σcations < 1 from the present study.
DIAGNOSTIC RATIOS AND PEARSON’S CORRELATION
The correlation coefficients of PM mass, carboxylates and source indicators shown in Table III were perfor-med in order to understand their possible sources and formation mechanisms. The selected source indi cators include K+ for vegetation emissions, Na+ and Cl−
for sea spray, and SO42− for anthropic emission and/
or secondary formation (gas-to-particle conversion from gaseous SO2). Solar radiation and wind speed
have been used as additional parameters to illustrate the atmospheric behaviours of carboxylate ions. Fig. 4 - Time series of the PM mass, acids and nss-SO42− in the PM2.5 size fractions (a) and in the PM10 size
It can be observed from Table III that there were possible similar sources for formate and other carboxylate ions as verified by a good correlation between them in the PM2.5 (0.51 < r < 0.80) and PM10 (0.50 < r < 0.87) aerosols. Succinate is poorly correlated with oxalate (r = 0.08) but most closely correlated with malonate (r = 0.85) in the PM2.5 aerosols. The former correlation indicates that the oxidation of unsaturated fatty acids, which usually occurs in marine atmospheres (Kawamura and Sakaguchi 1999) is not a likely source for succinate, but it seems to be an important source for both formate and oxalate at this site, while the latter is a feature of the photochemically induced decomposition of succinate into malonate (Yao et al. 2002). Nitrate is well correlated to succinate (r = 0.70) in PM2.5 but not correlated (r = - 0.70) in PM10. This probably evidences photochemical reactions being also important for NO3- in PM2.5
but the opposite happens for this species in PM10. Good correlation was also observed between NO3-
and SO42− (r = 0.68) for PM10 and (r = 0.84) for
PM2.5 that probably shows that vehicular and/or industrial emissions were important sources for those species.
In the PM2.5 aerosols, Na+ is correlated with
malonate and pyruvate and in both size fractions with K+. Sea salt is a known source of Na+ and
even Cl- in urban atmosphere (Hsieh et al. 2007).
Kerminen et al. (2000) showed that most of the sea salt derived aerosols have particle diameter between 1 and 5 µm. In this study, Na+ was found in a pronounced amount in the PM2.5 and PM10 size fractions and to a slightly extent for Cl−, suggesting sea spray could be one of the contributing sources of the aerosol components at the site.
Sulfate has been used as reference to investigate the major formation routes of carboxylate ions (Yu et al. 2005). As shown in Table III, acetate and pyruvate showed slight good correlation with SO42− in PM10 aerosols, suggesting that vehicular
emission can probably play an important role in the formation of acids at BNA in Salvador. On the other hand, the poor correlation of malonate with SO42−
(r = 0.28) suggests that malonate was possibly emitted by another source (Peng et al. 2001). Formate and oxalate showed poor correlations with SO42− in both size fractions, indicating that they were
mainly originated from primary emissions sources and/or atmospheric processes different from those of SO42−. Poor correlation between NH4+ and SO42−
indicates they were emitted from different sources and also, due to the found low levels of NH4+, the
reaction between their vapour precursors leading to nucleation of new particles was not a relevant process. Moderate to high correlations among Ca2+ and formate, acetate, and oxalate (0.53 < r <
0.70) for both particle fractions and for malonate (r = 0.98) in PM10 as well as Mg2+ and oxalate
(r=0.73) indicates either they have similar sources (being emitted as magnesium and/or calcium salts) or those carboxylic acids were emitted in vapour phase and then condensed onto Ca2+and Mg2+ rich
particles, such as sea salt particles. Nitrate is well
Species PM2.5 PM10
mean SD mean SD
acetate 0.5 0.05 0.6 0.08
formate 0.2 0.05 0.2 0.06
oxalate 0.5 0.2 0.6 0.20
malonate 0.2 0.1 0.05 0.09
succinate 0.02 0.03 0.02 0.02
pyruvate 0.08 0.01 0.08 0.02
NO3
-1.8 0.6 2.8 1.0
SO4
2-7.3 3.1 12 2.9
Cl- 4.0 1.2 14 4.1
NH4+ 1.7 0.5 2.6 1.0
Na+ 39 7.8 106 24
K+ 4.6 1.1 15 3.1
Mg2+ 26 5.8 23 5.6
Ca2+ 5.7 0.9 16 3.4
∑anions 15 5.3 30 8.5
∑cations 77 16 161 37
∑anions/∑cations 0.19 0.33 0.19 0.23
Anions deficiency 63 11 131 29
TABLE II
An
Acad Bras Cienc
(2014)
W
A
TER-SOLUBLE IONS IN FINE
AND COARSE
AEROSOLS
PM mass formate acetate oxalate malonate succinate pyruvate NH4+ NO3- SO42- Cl- Na+ K+ Mg2+ Ca2+ Solar Rad WS
PM mass 0.01 0.01 -0.40 -0.09 -0.07 -0.01 -0.43 0.57 0.65 0.37 -0.21 -0.17 -0.47 0.02 -0.71 -0.37
formate 0.12 0.69 0.53 0.67 0.64 0.65 0.41 0.34 0.08 -0.23 0.43 0.59 0.46 0.53 0.33 -0.02
acetate 0.25 0.70 0.37 0.68 0.53 0.80 0.07 0.28 0.16 -0.17 0.41 0.42 0.34 0.53 0.57 0.11
oxalate 0.17 0.66 0.48 0.20 0.08 0.51 0.52 -0.24 -0.30 0.05 0.45 0.71 0.73 0.57 0.62 -0.23
malonate 0.53 0.76 0.74 0.83 0.85 0.68 0.60 0.38 0.20 -0.36 0.40 0.43 0.04 0.43 0.24 0.32
succinate -0.36 -0.22 -0.57 -0.05 -1.00 0.68 0.42 0.70 -0.15 -0.41 0.35 0.20 0.07 0.01 0.08 0.47
pyruvate 0.18 0.87 0.69 0.50 0.72 -0.44 0.17 0.28 0.04 -0.16 0.53 0.53 0.37 0.44 0.49 -0.04
NH4+ 0.06 -0.14 -0.30 0.26 0.31 0.36 -0.08 -0.21 -0.39 -0.04 0.34 0.43 0.42 0.20 0.25 0.00
NO3- 0.23 0.21 0.35 0.46 0.43 -0.71 0.42 0.18 0.84 -0.13 0.14 0.09 -0.08 0.01 -0.27 -0.26
SO42- 0.29 0.41 0.52 0.24 0.28 -0.41 0.73 0.12 0.68 0.15 -0.17 -0.07 -0.35 0.14 -0.42 -0.48
Cl- 0.47 0.15 0.15 -0.24 -0.95 -0.06 0.28 -0.21 -0.19 0.31 -0.60 -0.38 -0.42 0.20 -0.39 -0.53
Na+ 0.31 -0.10 -0.14 -0.03 0.42 0.00 0.01 0.90 -0.05 0.11 0.40 0.86 0.78 -0.01 0.60 0.37
K+ 0.35 -0.01 -0.09 0.19 0.51 0.02 0.06 0.90 0.08 0.12 0.23 0.96 0.76 0.40 0.55 0.07
Mg2+ 0.59 -0.10 0.12 0.10 -0.73 -0.37 0.04 0.15 0.19 0.20 0.49 0.53 0.46 0.16 0.77 0.15
Ca2+ -0.12 0.70 0.58 0.65 0.98 -0.03 0.67 0.40 0.35 0.46 -0.07 0.28 0.40 -0.08 0.24 -0.42
Solar Rad 0.53 -0.05 -0.04 0.45 0.87 -0.17 -0.17 0.43 0.29 -0.13 -0.34 0.07 0.26 0.26 -0.09 0.36
WS 0.21 -0.58 -0.48 -0.36 -0.15 0.52 -0.67 0.54 -0.38 -0.38 0.11 0.53 0.49 0.18 -0.27 0.32
the PM10 size fractions (lower diagonal triangle) at BNA, Salvador. Correlation coefficients larger than 0.50 are indicated in bold.
*Solar rad. = Solar radiation #
correlated to succinate (r = 0.70) in PM2.5 but not correlated (r = - 0.70) in PM10. Wind speed was poorly correlated with most carboxylates except with succinate in the PM10 aerosols. This indicates that in addition to secondary formation, the carboxylates were mainly generated from local sources, while succinate might be related to long range aerosols transport to the sampling site. Concentrations of acetate, oxalate and malonate generally showed a good correlation with solar radiation suggesting that the acids were largely produced by secondary photochemical processes in the atmosphere (Kawamura and Yasui 2005). The ratio of malonate to succinate is used as an indicator of enhanced photochemical production of dicarboxylates in the atmosphere (Kawamura and Sakaguchi 1999). Malonate is derived from the incomplete combustion of fossil fuels or from the secondary atmospheric production. The mean malonate/succinate ratio of 1.6 (range: 0.56–2.9) in atmospheric aerosol and the lower average ratio of 0.35 (range: 0.25–0.44) were observed in vehicular exhaust because malonate is thermally less stable than succinate (Kawamura and Ikushima 1993). In this study substantially higher mean malonate/succinate ratio (5.3) in the PM2.5 aerosols were observed suggesting larger contribution from secondary sources to the atmospheric parti-culate acids (Kawamura and Sakaguchi 1999).
The ratio of formate-to-acetate has been used as a good indicator of the relative contributions of in-situ formation (high ratio) and secondary sources (low ratio) to carboxylate ions (Talbot et al. 1990, Grosjean 1992, da Rocha et al. 2012). As can be seen in Table III, the lower formate/acetate ratios (mean of about 0.26) for both size fractions particles can also indicate that the secondary formation was an important contributing source of those ions. This suggestion is supported by the fact that higher mean average temperature during sampling period (mean, 24 °C) might be the controlling factor in determining the relative contribution of the primary and secondary sources to these species.
PRINCIPAL COMPONENT ANALYSIS (PCA) AND CLUSTER
ANALYSIS (CA)
PCA from PM2.5 is shown in Table V and Fig. 5. Firstly, for PM2.5 (Fig. 5a and Table Va), the adjusted model is composed by three components (PC) that explains 68 % of total variance. PC1 explains 36 % and shows high scores for formate, acetate, oxalate, pyruvate, Na+, K+, Mg2+, total diacids and solar radiation. This PC provokes a separation in the dataset, demonstrated by those high scores for the indicated variables. PC1 represents a probable photochemical formation of (di)carboxylic acids in vapor phase and a posterior gas-to-particle conversion onto sea salt particles. In turn, sea salt particles are formed by the drying action caused by solar radiation on seawater droplets allowed to be in suspension in the atmosphere. PC2 explains 18 % of variance and brings high scores for SO42-, Ca2+,
Cl- and wind speed. This component also provokes
differentiation among data, separating these variables from those explained by PC3. Species presented by PC2, due to high scores for wind speed, had been involved in long range transportation processes. Since SO42- is a good tracer for anthropogenic
sources, this could be emitted by industries (from petrochemical complex) and/or by vehicles (from Salvador Metropolitan Area) as SO42- or SO2 and be
transported to BNA and causing modification of Cl
-and Ca2+ rich particles (probably from sea salt spray
and/or soil suspension). Finally, PC3 explains 14 % of variance and is presented by NO3-, temperature
and relative humidity. In this case, nitrate which is a volatile species, represents the change among atmospheric phases (from gas-to-particle and vice-versa) and the contribution of removal processes due to high RH. These explanations could also be verified by the groupings from Cluster analysis (Fig. 6a), Pearson correlations (Table III) and diagnostic ratios (Table IV).
Fig. 5 - Principal component analysis at 95 % confidence level for (a) PM2.5 and (b) PM10 according to ions
species, from BNA.
major part of PM10 samples. These explanations are in good agreement with information from cluster analysis (Fig. 6b), Pearson correlations
(Table III), and diagnostic ratios (Table IV). The dendogram shows the formation of three groups of samples. Two of them have more similarity and
(a)
Ratio PM2.5 PM10
mean range mean range
Malonate/Succinate 5.3 3.0−7.8 5.8 3.4-40
Formate/Acetate 0.25 0.18−0.41 0.27 0.17−0.40
Oxalate/dicarboxylates 0.72 0.48−0.98 0.83 0.69−0.97
Oxalate/K+ 0.13 0.08−0.18 0.05 0.04-0.06
TABLE IV
Mean ratios and associated standard deviations and range for carboxylate ions and K+ in PM2.5 and PM10 aerosols at BNA in Salvador.
(a) PM2.5
Species PC 1 (36 %) PC 2 (18 %) PC 3 (14 %)
mass -0.52 -0.58 0.29
Formate 0.64 -0.51 0.17
Acetate 0.61 -0.46 0.23
Oxalate 0.82 -0.21 -0.26
Malonate -0.57 -0.56 -0.11
Succinate -0.52 0.34 0.45
Pyruvate 0.67 -0.50 0.12
NH4 +
0.53 -0.01 -0.36
NO3- -0.18 -0.58 0.70
SO42- -0.42 -0.63 0.57
Cl- -0.39 -0.38 -0.53
Na+ 0.76 0.09 0.43
K+ 0.82 -0.18 0.26
Mg2+ 0.83 0.12 0.12
Ca2+ 0.42 -0.64 -0.22
Dicarboxylates 0.93 -0.01 -0.08
Solar Radiation 0.84 0.23 0.02
Wind Speed 0.25 0.70 0.29
Temperature 0.13 0.45 0.63
RH(%) -0.18 0.15 0.50
(b) PM10
Species PC 1 (34.8 %) PC 2 (20.6 %) PC 3 (11.5 %)
mass 0.11 -0.62 0.41
Formate 0.80 0.11 0.01
Acetate 0.81 0.01 -0.01
Oxalate 0.72 -0.01 0.63
Malonate -0.49 -0.12 0.42
Succinate -0.60 -0.11 -0.30
Pyruvate 0.89 -0.01 -0.23
NH4
+
-0.01 -0.91 -0.31
NO3
-0.60 -0.01 0.33
SO42- 0.72 -0.23 -0.23
Cl- 0.01 -0,54 -0.41
Na+ -0.01 -0,89 -0.20
K+ 0.13 -0,88 0.01
Mg2+ -0.01 -0,72 0,30
Ca2+ 0.81 -0,18 -0.11
Dicarboxylates 0.82 -0.01 0.28
Solar Radiation -0.01 -0.19 0.89
Wind Speed -0.59 -0.60 0.11
Temperature -0.90 -0.11 0.22
RH(%) -0.74 0.17 0.29
TABLE V
Principal Component Analysis (PCA) for both particle size fractions. High loadings are indicated in bold.
acetate, oxalate, pyruvate, NO3-, SO42-, Ca+, and
total diacids and high negative values for succinate, wind speed and temperature. This PC causes little separation in the dataset, indicating similar concentration levels for the species in question. First of all, since meteorological variables such as wind speed and temperature correlate well with succinate this means that it may be emitted or formed in atmosphere as acid succinic in gas phase and be ab/adsorbed onto pre-existing particles. On the other hand, this happens the other way
around for formate, acetate, oxalate, pyruvate, NO3-, SO42-, Ca+ and total diacids. This means that
they are either primarily emitted as coarse particles from anthropogenic sources or are result of ageing and growing of fine particles. PC2 explains 20.6 % PM10 mass, NH4+, Na+, and Mg2+ and makes the
the third group is presented by few samples with different characteristics of the others.
ESTIMATES OF DRY DEPOSITION FLUXES
The dry atmospheric deposition fluxes (Fd) were
calculated by multiplying the geometric mean
particulate concentration in air of the element of interest (i) by the elemental dry settling velocity (Vd):
F
d=
C
ix
V
dThe term Vd varies with particle size and
is dependent on climatological and physical Fig. 6 - Cluster analysis at 95 % confidence level for (a) PM2.5 and (b) PM10, from BNA.
a
conditions in the troposphere, especially in coastal environments (Herut et al. 2001). The Vd values considered in this study were reported
elsewhere (Cadle et al. 1985, Chu et al. 2008, Khare et al. 1998). Even though keeping in mind the uncertainties of the term Vd, the dry deposition
fluxes of selected major ions were calculated since this is the first approach to have an insight about this parameter and, therefore, about major ions air-to-sea fluxes for BTS. Anyway, similar estimates were done in recent studies for major
ions and also other compounds (da Rocha et al. 2009, 2012, Pereira et al. 2007, Vasconcellos et al. 2011, Machado et al. 2009).
Table VI presents estimates of dry deposition fluxes (Fd) for selected ions in both fine (PM2.5)
and coarse (PM10) particulate matter. Since during sampling campaign there were no rain events and there were high Fd values found (mainly for
inorganic species), we could say particle dry deposition is a very important removal mechanism of these species during dry periods.
Dry Settling Velocity (Vd) (cm s-1)
PM2.5 PM10
Geometric Mean (ng m-3)
Dry Deposition Flux (Fd) (mg m-2 day-1)
Geometric Mean (ng m-3)
Dry Deposition Flux (Fd) (mg m-2 day-1)
formate 0.5a 7.59 3.28 8.72 3.77
acetate 1.0a 30.9 26.7 33.3 28.8
Cl- 4.1b 138 489 493 1747
NO3- 0.27b 107 24.9 165 38.6
SO42- 0.52b 327 147 546 246
Na+ 3.49b 883 2663 2377 7168
NH4+ 0.13b 29.1 3.26 49.9 5.61
K+ 3.9b 176 592 559 1883
Mg2+ 1.5c 309 399 267 346
Ca2+ 2.1c 112 203 304 552
a
Khare et al. 1998; bChu et al. 2008; and cCadle et al. 1985.
TABLE VI
Estimates of particle dry deposition fluxes (Fd) for major ions in BNA.
CONCLUSIONS
The PM2.5 and PM10 aerosols samples were collected from a site at Baia de Todos os Santos bay in Salvador, Brazil. Among the analysed carboxylate ions, formate was found to be the dominant species in almost all samples followed by acetate and oxalate. Of the other ionic components, SO42−, Cl−,
and Na+ made a lager contribution to the total
water-soluble inorganic aerosol mass. Main sources for fine particles were: (i) photochemical formation of carboxylic and dicarboxylic acids in vapor phase and a posterior gas-to-particle conversion onto sea salt particles; (ii) emissions from anthropic sources (vehicles and/or industries) within participation in
ACKNOWLEDGMENTS
The authors are grateful to Dr. Eliane Sousa, Prof. Dr. Sandro Andrade, Jeancarlo dos Anjos, Ana Carla Regis for help in logistics and Cibele Soares for PM mass measurements. We also wish to acknowledge Marinha do Brasil, PETROBRAS, Coordenação de Aperfeiçoamento de Pessoal de Nível Superior (CAPES), Fundação de Amparo à Pesquisa do Estado da Bahia (FAPESB) and Conselho Nacional de Desenvolvimento Científico e Tecnológico (CNPq).
RESUMO
A atmosfera de regiões costeiras adjacentes a regiões urbanas podem ser afetadas pela emissão de diferentes poluentes atmosféricos, dentre eles, os íons majoritários. Nesse estudo foram estudadas a composição química e as fontes de carboxilatos e íons solúveis em água em partículas finas e grossas bem como as estimativas de fluxo de deposição seca em um sítio em uma região costeira tropical afetada por uma Região Metropolitana. As concentrações médias de carboxilatos totais foram 78 ng m-3 na fração fina e 81 ng m-3
na fração grossa do material particulado (MP). Os valores correspondentes de concentração para os íons inorgânicos foram 2143 ng m-3 e 4880 ng m-3, respectivamente, para as frações fina e grossa. As principais fontes para as partículas finas foram: (i) formação fotoquímica de ácidos carboxílicos na fase vapor e posterior conversão gás-partícula sobre partículas de sal marinho,
(ii) emissões de fontes antrópicas envolvendo processos de transporte de longas distâncias; e (iii) a interconversão de espécies voláteis entre fases atmosféricas. Por sua vez, as fontes predominantes para as partículas grossas foram: (i) espécies gasosas ab/adsorvidas em partículas pré-existentes, (ii) emissão primária de partículas grossas de fontes antrópicas, e (iii) spray marinho e/ou ressuspensão do solo. Finalmente, a deposição seca de partículas representa o fluxo de íons majoritários na interface ar-oceano.
Palavras-chave: deposição seca de partículas, MP, íons majoritários, atmosfera tropical, Baía de Todos os Santos, Brasil.
REFERENCES
ALLEN AG, CARDOSO AA AND DA ROCHA GO. 2004.
Influence of sugar cane burning on aerosol soluble ion composition in Southeastern Brazil. Atmos Environ 38(30): 5025-5038.
BOUROTTE C, CURI-AMARANTE AP, FORTI MC, PEREIRA LAA,
BRAGA AL AND LOTUFO PA. 2007. Association between ionic composition of fine and coarse aerosol soluble fraction and peak expiratory flow of asthmatic patients in São Paulo city (Brazil). Atmos Environ 41(10): 2036-2048.
BREWER PG. 1975. Minor elements in sea water, In: Chester
R (Ed), Chemical Oceanography, Vol. 1, Academic Press: New York, p. 417-425.
CADLE SH, DASCH JM AND MULAWA PA. 1985. Atmospheric concentrations and the deposition velocity to snow of nitric-acid, sulfur-dioxide and various particulate species. Atmos Environ19: 1819-1827.
CAMPOS VP, COSTA A AND TAVARES T. 2007. Partial neutra-lization of rain by seaspray: the case of Recôncavo, Bahia, Brazil. J Environ Manage 84: 204-212.
CHAKRABORTY A. AND GUPTA T. 2010. Chemical
Characterization and Source Apportionment of Submicron (PM1) Aerosols in Kanpur Region, India. Aerosol Air Quality Res 10: 433-445.
CHU CC, FANG GC, CHEN JC AND YANG I. 2008. Dry deposition study by using dry deposition plate and water surface sampler in Shalu, central Taiwan. Environ Monit Assess 146: 441-451.
CONAMA - CONSELHO NACIONAL DE MEIO AMBIENTE. 1990.
Resolução nº. 03, de 28 de junho de 1990. Publicação no Diário Oficial da União, 22 de agosto de 1990.
DA ROCHA GO, ALLEN AG AND CARDOSO AA. 2005. Influence
of Agricultural Biomass Burning on Aerosol Size Distribution and Dry Deposition in Southeastern Brazil. Environ Sci Technol 39: 5293-5301.
DA ROCHA GO, FRANCO A, ALLEN AG AND CARDOSO AA.
2003. Sources of atmospheric acidity in an agricultural-industrial region of São Paulo State, Brazil. J Geophys Res 108: 4207. doi:10.1029/2002JD002567.
DA ROCHA GO, LOPES WA, PEREIRA PAP, VASCONCELLOS
PC, OLIVEIRA FS, CARVALHO LS, CONCEIçãO LS AND
DE ANDRADE JB. 2009. Quantification and Source
Identification of Atmospheric Particulate Polycyclic Aromatic Hydrocarbons and their Dry Deposition Fluxes at Three Sites in Salvador Basin, Brazil, Impacted by Mobile and Stationary Sources. J Braz Chem Soc 20: 680-692. DA ROCHA GO, VASCONCELLOS PC, ÁVILA SG, SOUZA DZ,
REIS EAO, OLIVEIRA PV AND SANCHEZ-CCOYLLO O.
2012. Seasonal Distribution of Airborne Trace Elements and Water-Soluble Ions in São Paulo Megacity, Brazil. J Braz Chem Soc 23: 1915-1924.
DENATRAN - DEPARTAMENTO NACIONAL DE TRâNSITO. 2013.
DOCKERY D AND POPE A. 1996. Epidemiology of acute health effects: Summary of time-series studies. In: Spengler JD and Wilson R (Eds), Particles in Our Air: Concentration and Health Effects. Harvard University Press, Cambridge-MA, USA, p. 123-147.
FANG GC, WU YS, CHEN JC, RAU JY, HUANG SH AND LIN CK.
2006. Concentrations of ambient air particulates (TSP, PM2.5, and PM2.5-10) and ionic species at offshore areas
near Taiwan Strait. J Hazard Materials 132: 269-276. GAO Y, ARIMOTO R, DUCE RA, CHEN LQ, ZHOU MY AND GU
DY. 1996. Atmospheric non-sea-salt, sulphate, nitrate and methane sulfonate over the China Sea. J Geophys Res 101: 12601-12611.
GROSJEAN D. 1992. Formic and acetic acids: emissions,
atmospheric formation and dry deposition at two southern California locations. Atmos Environ 26A: 3279-3286.He J and Balasubramanian R. 2008. Rain-aerosol coupling in the tropical atmosphere of Southeast Asia: distribution and scavenging ratios of major ionic species. J Atmos Chem 60: 205-220.
HE J AND BALASUBRAMANIAN R. 2008. Rain-aerosol coupling in the tropical atmosphere of Southeast Asia: distribution and scavenging ratios of major ionic species. J Atmos Chem 60: 205-220.
HERUT B, NIMMO M, MEDWAY A, CHESTER R AND KROM MD.
2001. Dry atmospheric inputs of trace metals at the Mediterranean coast of Israel (SE Mediterranean): sources and fluxes. Atmos. Environ 35: 803-813.
HSIEH LY, KUO SC, CHEN CL AND TSAI YI. 2007. Origin of low-molecular-weight dicarboxylic acids and their concentration and size distribution variation in suburban aerosol. Atmos Environ 41: 6648-6661.
HYSPLIT. 2011. HYbrid Single Particle Lagrangian Integrated Trajectory model, NOAA, available on http://ready.arl. noaa.gov/HYSPLIT.php, accessed at 21st March 2011. IPCC - INTERGOVERNMENTAL PANEL ON CLIMATE CHANGE.
2007. IPCC fourth assessment report, London: Cambridge
University Press, p. 1-940.
JACOBSON MC, HANSON HC, NOONE KJ AND CHARLSON RJ.
2000. Organic atmospheric aerosols: review and state of
the science. Rev Geophys 38: 267-294.
KAPPOS AD ET AL. 2004. Health effects of particles in ambient air. Internat J Hygiene Environ Health 207: 399-407. KARTHIKEYAN S AND BALASUBRAMANIAN R. 2006.
Determi-nation of water-soluble inorganic and organic species in atmospheric fine particulate matter. Microchem J 82: 49-55. KAWAMURA K AND IKUSHIMA K. 1993. Seasonal changes in the
distribution of dicarboxylic acids in the urban atmosphere. Environ Sci Technol 27: 2227-2233.
KAWAMURA K AND SAKAGUCHI F. 1999. Molecular distribution of water soluble carboxylic acids in marine aerosols over the Pacific Ocean including tropics. J Geophys Res 104: 3501-3509.
KAWAMURA K AND YASUI O. 2005. Diurnal changes in the distribution of dicarboxylic acids, ketocarboxylic acids and dicarbonyls in the urban Tokyo atmosphere. Atmos Environ 39: 1945-1960.
KERMINEN VM. 2001. Relative roles of secondary sulfate and organics in atmospheric cloud condensation nuclei production. J Geophys Res 106: 17321-17333.
KERMINEN VM, OJANEN C, PAKKANEN T, HILLAMO R, AURELA
M AND MERILAIEN J. 2000. Low-molecular-weight dicarboxylic acids in an urban and rural atmosphere. J Aerosol Sci 31: 349-362.
KHARE P, KUMAR N, SATSANGI GS, KUMARI KM AND
SRIVASTAVA SS. 1998. Formate and acetate in particulate matter and dust fall at Dayalbagh, Agra (India). Chemosphere 36: 2993-3002.
KOçAK M, KUBILAY N AND MIHALOPOULOS N. 2004.
Ionic composition of lower tropospheric aerosols at a Northeastern Mediterranean site: implications regarding sources and long-range transport. Atmos Environ 38: 2067-2077.
KUBÁTOVÁ A, VERMEYLEN R, CLAEYS M, CAFMEYER
J, MAENHAUT W, ROBERTS G AND ARTAXO P. 2000.
Carbonaceous aerosol characterization in the Amazon basin, Brazil: novel dicarboxylic acids and related compounds. Atmos Environ 34: 5037-5051.
KUMAR A, MISHRA MK, DIVKAR JK, ROUT S, NARAYANAN U
AND HEDGE AG. 2010. Impact of particle size distribution of major ions in acid- and water-soluble components of PM10 atmospheric aerosols in the coastal region of Mumbai. Atmos Res 98: 406-415.
KUNDU S, KAWAMURA K, ANDREAE TW, HOFFER A AND
ANDREAE MO. 2010. Diurnal variation in the water-soluble inorganic ions, organic carbon and isotopic compositions of total carbon and nitrogen in biomass burning aerosols from the LBA-SMOCC campaign in Rondônia, Brazil. J Aerosol Sci 41(1): 118-133.
LEE BK AND HIEU NT. 2013. Seasonal ion characteristics of fine and coarse particles from an urban residential area in a typical industrial city. Atmos Res 122: 362-377.
LIMBECK A AND PUXBAUM H. 1999. Organic acids in continental background aerosols. Atmos Environ 33: 1847-1852.
LIMBECK A, PUXBAUM H, OTTER L AND SCHOLES MC. 2001.
Semi-volatile behavior of dicarboxylic acids and other polar organic species at a rural background site (Nylsvley, RSA). Atmos Environ 35: 1853-1862.
LIMON-SANCHEZ MT, ARRIAGA-COLINA J, ESCALONA-SEGURA
S AND RUíZ-SUÁREZ LG. 2002. Observations of formic and acetic acids at three sites of Mexico City. Sci Total Environ 287: 203-212.
MACHADO MCS, LOYOLA J, QUITéRIO SL, DA ROCHA GO, DE
ANDRADE JB AND ARBILA G. 2009. Particle associated polycyclic aromatic hydrocarbons and their dry deposition fluxes from a bus station in Rio de Janeiro metropolitan area, Brazil. J Braz Chem Soc 20: 1565-1573.
MARIANI RL AND DE MELLO WZ. 2007. PM2.5–10, PM2.5 and associated water-soluble inorganic species at a coastal urban site in the metropolitan region of Rio de Janeiro. Atmos Environ 41: 2887-2892.
MILLERO FJ. 2006. Chemical Oceanography. New York:
MKOMA SL, DA ROCHA GO, REGIS ACD, DOMINGOS JSS,
SANTOS JVS, DE ANDRADE SJ, CARVALHO LS AND DE
ANDRADE JB. 2014. Major ions in PM2.5 and PM10 released from buses: The use of diesel/biodiesel fuels under real conditions. Fuel 115: 109-117. http://dx.doi. org/10.1016/j.fuel.2013.06.044
MKOMA SL, WANG W AND MAENHAUT W. 2009. Seasonal Variation of Water-Soluble Inorganic Species in the Coarse and Fine Atmospheric Aerosols at Dar es Salaam, Tanzania. Nucl Instrum Meth Phys Res B 267: 2897-2902. MOCHIDA M, KAWABATA A, KAWAMURA K, HATSUSHIKA H
AND YAMAZAKI K. 2003. Seasonal variation and origins of dicarboxylic acids in the marine atmosphere over the western North Pacific. J Geophys Res 108 (D6): 4193. NARUKAWA M, KAWAMURA K, TAKEUCHI N AND NAKAJIMA
T. 1999. Distribution of dicarboxylic acids and carbon isopotic compositions in aerosols from 1997 Indonesian forest fires. Geophys Res Lett 26: 3101-3104.
NICOLAS JF, GALINDO N, YUBERO E, PASTOR C, ESCLAPEZ R
AND CRESPO J. 2009. Aerosol Inorganic Ions in a Semiarid Region on the Southeastern Spanish Mediterranean Coast. Water Air Soil Poll 201: 149-159.
PENG C, CHAN MN AND CHAN CK. 2001. The hygroscopic properties of dicarboxylic and multifunctional acids: measurements and UNIFAC predictions. Environ Sci Technol 35: 4495-4501.
PEREIRA PAP, LOPES WA, CARVALHO LS, DA ROCHA GO,
BAHIA NC, LOYOLA J, QUITERIO SL, ESCALADEIRA V,
ARBILLA G AND DE ANDRADE JB. 2007. Metal Contents, TSP and MP10 Concentrations in Airborne Particulate Matter from Three Sites in Salvador, Bahia, Brazil. Atmos Environ 41: 7837-7850.
SALMA I, BALASHAZY I, WINKLER-HEIL R, HOFMANN W AND
ZARAY G. 2002. Effect of particle mass size distribution on the deposition of aerosols in the human respiratory system. J Aerosol Sci 33: 119-132.
TALBOT RW, ANDREAE MO, BERRESHEIM H, JACOB DJ AND BEECHER KM. 1990. Sources and sinks of formic, acetic and pyruvic acids over central Amazonia: 2. Wet deposition. J Geophys Res 95: 16799-16811.
US ENVIRONMENTAL PROTECTION AGENCY. 1997. National Ambient Air Quality Standards for Particulate Matter, Final Rule. Federal Register Vol. 62, No. 138. (EPA, 40 CFR Part 50, 18 July).
VASCONCELLOS PC, ZACARIAS D, MAGALHãES D AND DA
ROCHA GO. 2011. Seasonal Varition of n-Alkanes and polycyclic aromatic hydrocarbons in PM10 samples collected in urban sites of São Paulo State, Brazil. Water Air Soil Poll 219:1-12.
VERMA SK, DEB MK, SUZUKI Y AND TSAI YI. 2010. Ion chemistry and source identification of coarse and fine aerosols in an urban area of eastern central India. Atmos Res 95: 65-76.
WARNECK P. 2003. In-cloud chemistry opens pathway to the formation of oxalic acid in the marine atmosphere. Atmos Environ 37: 2423-2427.
WITT MLI, MATHER TA, BAKER AR, DE HOOG JCM AND PYLE
DM. 2010. Atmospheric trace metals over the south-west Indian Ocean: total gaseous mercury, aerosol trace metal concentrations and lead isotope ratios. Mar Chem 121: 2-16. YAO X, FANG M AND CHAN CK. 2002. Size distributions and
formation of dicarboxylic acids in atmospheric particles. Atmos Environ 36: 2099-2107.
YU J, HUANG X, XU J AND HU M. 2005. When aerosol sulfate goes up, so does oxalate: implication for the formation mechanisms of oxalate. Environ Sci Technol 39 (1): 128-133. ZHANG T, CAO JJ, TIE XX, SHEN ZX, LIU SX, DING H, HAN