Antonio Donizette de Oliveira1, Francisco Fernandes Bernardes2, José Luiz Pereira de Rezende3, José Márcio de Mello4, José Roberto Soares Scolforo5, Luiz Moreira Coelho Junior6 (received: February 12, 2010; accepted: September 27, 2010)
ABSTRACT: The objective of this study is to estimate for several importing countries of fi berboard panels the income elasticities and price elasticities of total import demand and also the own-price and cross-price elasticities of demand for fi berboard panels, differentiated by country of origin. Time series data were used referring to the trade fl ow of the world’s largest exporters and importers of fi berboard panels. The demand model being used treats products as imperfect substitutes. It was concluded that in Germany, China and United Kingdom the total import demand for fi berboard panels was more sensitive to variations in price than in income, whereas in other importing countries the reverse happened. The own-price elasticity of demand for fi berboard panels, differentiated by country of origin, was higher than one in almost all markets, except in Germany and United Kingdom. The negative cross-price elasticities suggest that fi berboard panels imported from other exporting countries are complementary products.
Key words: Armington model, forest products trade, export, import.
DEMANDA DE PAINÉIS DE FIBRA DE MADEIRA NO MERCADO INTERNACIONAL RESUMO: Objetivou-se, neste estudo, estimar, para os diversos países importadores de painéis de fi bra de madeira, as
elasticidades-renda e as elasticidades-preço da demanda total de importação e as elasticidades-preço diretas e cruzadas da demanda por painéis
de fi bra de madeira, diferenciados por país de origem. Utilizaram-se dados de séries temporais referentes aos fl uxos comerciais dos
maiores exportadores e importadores mundiais de painéis de fi bra de madeira. O modelo de demanda utilizado considera que os
produtos não são substitutos perfeitos. Concluiu-se que na Alemanha, na China e no Reino Unido, a demanda total de importação
de painéis de fi bra de madeira foi mais sensível às variações no preço que na renda, enquanto nos outros países importadores
ocorreu o contrário. A elasticidade-preço direta da demanda por painéis de fi bra de madeira, diferenciada por país de origem, foi
maior que um em quase todos os mercados, com exceção da Alemanha e do Reino Unido. O valor negativo das elasticidades-preço
cruzadas sugere que os painéis de fi bra de madeira importados dos outros países exportadores são produtos complementares.
Palavras-chave: Modelo de Armington, comércio de produtos fl orestais, exportação, importação.
1Forest Engineer, Professor, Dr. in Forest Science – Departamento de Ciências Florestais – Universidade Federal de Lavras – Cx. P. 3037 – 37200-000 –
Lavras, MG, Brasil – donizete@dcf.ufl a.br
2Forest Engineer, MSc in Forest Engineering – Vallourec e Mannesmann Florestal Ltda – Rua Honduras n 78, Léo Batista – 35790-000 – Curvelo,
MG, Brasil
3Forest Engineer, PhD in Forest Economy – Departamento de Ciências Florestais/DCF – Universidade Federal de Lavras/UFLA – Cx. P. 3037 –
37200-000 – Lavras, MG, Brasil – jlprezen@dcf.ufl a.br
4Forest Engineer, Professor, Dr. in Forest Resources – Departamento de Ciências Florestais – Universidade Federal de Lavras – Cx. P. 3037 – 37200-000 –
Lavras, MG, Brasil – josemarcio@dcf.ufl a.br
5Forest Engineer, Professor, Dr. in Forest Engineering – Departamento de Ciências Florestais – Universidade Federal de Lavras – Cx. P. 3037 –
37200-000 – Lavras, MG, Brasil – jscolforo@dcf.ufl a.br
6Economist, Researcher in socioeconomics – Intituto Agronômico do Paraná (IAPAR) – Rodovia BR 163, Km 188 – 85825-000 – Santa Tereza do
Oeste, PR, Brasil – lmcjunior@hotmail.com
1 INTRODUCTION
Fiberboard panels are characterized as being highly homogeneous and isotropic structures, the manufacturing process being responsible for conferring advantages in terms of homogeneity of properties. Several types of wood fi berboard panels are available which can be grouped into laminate composites and particulate composites. The first group comprises plywood and blockboard, whereas the second group comprises mineral board (fl ake and excelsior), fi berboard (hardboard, medium density fi berboard or MDF, and insulating board) and particleboard
(conventional, waferboard, and oriented strand board or OSB).
The use of economic models for analysis in the forest sector is recent and highly elaborate as far as methods and applications are concerned (RIBEIRO, 2003). According to Grennes et al. (1979), what differentiates one model from another are the restrictions associated to them, whether related to the economic theory or to the functional specifi cation of the model.
The development of models in the forest sector is due to a large extent to the evolution of agriculture, having included representations of supply and demand, spatial treatment of production and consumption, as well as distinction between resource and product markets. Several types of models can be used to study international trade patters, with special mention of market share models, economic equilibrium spatial models, and differentiated product models or Armington models (RIBEIRO, 2003). As far as trade of agricultural products is concerned, several examples can be given of the application of the Armington model, including the works of Abbott and Paarlberg (1986), Babula (1987), Figueroa and Webb (1986), Grennes et al. (1979), Johnson et al. (1979), Penson and Babula (1988), and Sarris (1983) and Silva (1990, 1993). As for the trade of forest products, however, the Armington theory has been little used so far and includes the works of Chou and Buongiorno (1983), Cruz (2001), Oliveira et al. (1996) and Ribeiro (2003). In the fi rst case, the study consisted of estimating United States demand for hardwood plywood, imported from Korea, Taiwan, Japan, Philippines, and other countries grouped into a region referred to as ‘rest of the world’. Plywood differentiation by country of origin allowed estimating, for each exporting country, own-price and cross-price elasticities of demand for the product imported by the United States. In the second case, the authors assessed the evolution of prices and fl ow of cellulose pulp in the international market, considering the main exporting and importing countries. To achieve that, they formulated a model of the international cellulose pulp trade to simulate sudden changes in exogenous variables, including changes in supply and demand shifters and tariffs imposed on imports. Cruz (2001) studied cellulose pulp and paper trade, and Ribeiro (2003) studied plywood trade.
Oliveira et al. (1996) argue that knowing the imports demand structure is important for all countries involved in the international market of a given product. This empirical information about elasticities of demand can help exporting countries in defi ning price policies and planning production. Questions involving changes in the participation of a given importer in a specifi c market due to an increase in its sale
price or in the sale price of competitor countries can be better answered with knowledge of equations of import demand differentiating products by country of origin.
According to Barros (1987), econometric analysis is becoming increasingly critical in modern day economy, given the need to access market responsiveness in both the short and long term to various changes that are imposed in a multitude of ways. Assessing the likely consequences of policies being adopted is critical, prior to them being adopted. This work aims to estimate, for various importing countries of fi berboard panels, the income elasticities and price elasticities of total import demand for the product, as well as and the own-price and cross-price elasticities of demand for fi berboard panels, differentiated by country of origin.
2 MATERIAL AND METHODS
In order to analyze the import demand for fi berboard panels differentiated by country of origin, the Armington elasticity model (1969a,b) was used. This model treats products as imperfect substitutes, that is, if the price of one is lower than the price of the rest, it does not mean that the importing country will stop buying higher priced products, for the fact that the importer needs that particular product exclusively, with no substitution for another from a different origin being possible.
The estimation of demand equations was obtained using a two-stage maximization process. In the fi rst stage, the total utility of a given country was maximized through the allocation of total spending (E), in the quantities demanded of each type of good (Xi). One of such goods is fi berboard panel, and fi berboard panels from different origins (Xij) are considered differentiated ‘products’. The price of each good (Pi) is represented by a product price function (Pij), in market i. In the second stage, the importing country allocates its purchases so as to maximize spending (Ei) in each predetermined quantity of Xi. The two processes are summarized as follows:
Max U = U (Xi , ...,Xm) subject to E =
∑
= n i i iP X 1 (1) ⇒Xi = Xi (E, Pi , ...,Pn)
Min ij m i ijX P
∑
=1subject to Xi = θ (Xi1, ..., Xim (2)
⇒ ⎟⎟ ⎠ ⎞ ⎜⎜ ⎝ ⎛ = im ij i ij i ij ij P P P P X X
X , ,...,
By grouping (1) and (2), the following is derived:
(3)
where n represents the number of goods, and m represents the number of products in each market.
If a single maximization process was used, n x m prices would be required, while, if two stages were used, only n + m prices would be required. However, this simplifi cation is at a cost. Two-stage maximization presupposes weak separability of utility function and degree of priority, for deriving demand equations in equation (2).
Weak separability implies that the marginal rate of substitution between two products competing in the same market of good i is independent of any other goods. This represents a restriction in the preference of the importing country.
The adopted model also assumes that the elasticity of substitution is constant and equal between any product pair, in the same market. Therefore, it considers that the demand for each good (Xi) is a constant elasticity of substitution (CES) function:
(4)
From (4), equations of import demand for products (fi berboard panels) have the following form:
(5)
where Xi is the quantity index of fiberboard panels demanded by country i; Xij is the quantity of fi berboard panels of country j going into country i; Pi is the price index of fi berboard panels in country i; Pij is the price of fi berboard panels of country j in country i; σi is the elasticity of substitution between any pair of fi berboard panels in country i; and bij is the ratio of export value of fi berboard panels of country j that go into country i, to the total worldwide export value of fi berboard panels.
By differentiating equation (5), an equation is derived that is expressed by percentage changes:
(6)
where
εi = income elasticity of Xij;
- [(1 – Sij) σi+ Sijηi] = ηijj is the own-price elasticity of demand for fi berboard panels of country j in country i; (7) [Sihσi – Sihηi] = ηijh is the cross-price elasticity of demand for fi berboard panels of country j, with respect to the price of fi berboard panels of country h, in country; (8) ηi= price elasticity of total import demand for fi berboard panels in country i;
ηih = cross-price elasticity of demand for fi berboard panels of country j in country i, with respect to price of products from other groups;
Sij = share of country j in imports of good Xi in country i, that is, relative participation in spendings with fi berboard panels of country j in country i.
The number of parameters forming own-price and cross-price elasticities of import demand is small. To obtain Sij values, data were used on the worldwide trade fl ow of fi berboard panels. ηi values were estimated using a fi berboard panel import demand function, at the aggregate level, fi tted to each importing country with no reference to the origin. In the fi rst stage, when total utility has to be maximized, the importing country decides on the quantity of fi berboard panels to buy based on price of fi berboard panels, on prices of competitive goods, on the level of income and on other country-specifi c variables. However, according to model assumptions, prices and quantities in this stage should be such that the demand for fi berboard panels is consistent with the optimal selection of products in each market. Thus, in order to estimate the total import demand for fi berboard panels, one should use quantity and price indices based on the elasticities of substitution estimated in the second stage. Assumptions of the Armington model allow specifying such indices as being constant elasticity of substitution functions (CES indices), whose formulas are expressed as:
(9)
(10)
where ;
Xi = CES quantity index of fi berboard panels in country i; Pi= CES price index of fi berboard panels in country i.
⎟⎟ ⎠ ⎞ ⎜⎜ ⎝ ⎛ = im ij i ij n ij ij P P P P P P E X
X , ,..., , ,...,
1 1
[
i i]
ii i im im
i
b
X
b
X
X
ρ ρ ρ1 1
...
1 − − −+
+
=
i i i ij i ij ij P P X b X σ σ − ⎟⎟ ⎠ ⎞ ⎜⎜ ⎝ ⎛ =( )
ii
m
j ij ij
i b X
X ρ ρ 1 1 − = − ⎥ ⎦ ⎤ ⎢ ⎣ ⎡ =
∑
( )( )
ii
ij m
j ij
i b P
P σ σ − − = ⎥⎦ ⎤ ⎢ ⎣ ⎡
=
∑
11 1
1
(
i)
i ρ σ + = 1 1
)
(
]
[
ln ij i ln 1 ij i ij i ln ij ih i h j
d X εd S σ S η d P S σ
=
⎡
= Ε −⎣ − + + Σ −
]
ln 1 lnih i h ih h
h
S η d P η d P
=
The per capita Gross Domestic Product (GDP) was used as an indicator of income in each importing country, while the effect of prices of competitive goods was implicitly obtained by using real prices and GDP. The model of total import demand for fi berboard panels can be expressed as:
(11) where Yi represents the per capita GDP and (Xi)t-1 is the lagged dependent variable which was introduced in the model on the assumption that there is market rigidity and that fi berboard panel imports in a given year almost always correspond to contracts made in the preceding year.
According to Oliveira (1995), the use of lagged variables in demand studies is commonly found in specialized literature, and authors such as Goldstein and Khan (1976), Khan (1974), Turnovsky (1968), Wilson and Takacs (1979) and Yadav (1975) argue that demand does not adjust instantly to changes in any of the parameters considered for its determination. According to Malinvaud (1970), as cited by Oliveira (1995), one of the justifi cations for using demand equations including lagged variables is that imports are based on contracts between far-apart countries, which do not respond instantly to changes in demand.
Model (11) was fi tted in log-linear form so that price elasticities and income elasticities of total import demand for fi berboard panels are measured directly from the coeffi cients of variables price index (Pi) and per capita GDP (Yi) respectively.
In order to obtain the elasticities of substitution (σi), a product demand equation was estimated as specifi ed in (5). In order to obtain the constant elasticity of substitution, which is a fundamental assumption of the Armington model, the equation was fi tted in log-linear form, expressed as:
(12) where X
iis the total quantity of fi berboard panels consumed by country i; and Piis the average price of fi berboard panels in the world market, equal to the average export price of Germany, Austria, Belgium, Brazil, Canada, China, United States, France, Italy, Holland, Norway, Switzerland, Poland, United Kingdom, Russia and Sweden, weighted by the respective ratios of export value of these countries to the international trade.
According to Ball (1973), these Xi and Pi values represent well the real CES quantity and price indices, as calculated by formulas (10) and (11) respectively, often being used in estimations of product demand equations, in the Armington model. The work of Cruz (2001) and Oliveira (1995) on international trade of cellulose pulp and paper, and the work of Ribeiro (2003) on international trade of plywood, exemplify the use of Xi and Pi values in substitution for CES index values.
In order to satisfy the assumption that elasticities of substitution are constant and equal between any product pair, in a given market, the average value of elasticity of substitution was used.
Models were fi tted using the ordinary least squares method (OLS). The F test was used to test the statistical signifi cance of regressions, while the adjusted coeffi cient of determination ( 2
R ) was used to assess the degree of equation fi tting. Also, the statistical signifi cance of estimated coeffi cients was verifi ed by Student’s t-test.
Tests for the existence of serial autocorrelation of residuals were based on Durbin-Watson’s d-statistic and Durbin’s h-statistic, the latter being used for models that included a lagged endogenous variable as explanatory variable. The existence of serial correlation in residuals means that parameters are ineffective, despite being unbiased.
Where autocorrelation was detected, the interactive method of Cochrane-Orcu tt was used for solving such problem, as presented by Gallant and Goebel (1976).
To study fi berboard panel demand in the international market, the following countries were selected as importers: United States (EUA), China (CH), Germany (AL), Canada (CA), Italy (IT), United Kingdom (RE), France (FR), and Russia (RU), in addition to a region referred to collectively as ‘Rest of the World’ (RDM1) comprising all remaining importers. The following countries were selected as exporters: Austria (AU), Germany (AL), Belgium (BE), Brazil (BR), Canada (CA), China (CH), France (FR), Italy (IT), Holland (HO), Norway (NO), Poland (PO), Russia (RU), Spain (ES), Sweden (SUE), Switzerland (SU), United Kingdom (RE) and United States (EUA). The remaining exporters were grouped into a region referred collectively as ‘Rest of the World’ (RDM2).
Although Thailand, Malaysia, Turkey and New Zealand rank 4th, 5th, 13th and 14th respectively in the list of largest exporters of fi berboard panels, they were not computed individually in the analysis due to data unavailability on the trade fl ows of these countries covering every year of the 1997-2006 interval, a precondition to apply the Armington model.
( )
( )
31 2 1 0
β β β
β
−
=
t
i i i t
i P Y X
X
( )
( )
( )
(
)
( )
Data on trade fl ows (value in US$ and quantity in m3 of
fi berboard panels that each exporter sells annually to each importer) refer to annual time series covering the 1997-2006 interval and were retrieved from FAO website (2008). Longer time series are unavailable in the website for the relevant period and no other source was accessible in the format required by the Armington model.
3 RESULTS AND DISCUSSIONS
Table 1 provides elasticities of substitution regarding fi berboard panel imports for model fi tting. The low value found indicates low substitutability between fi berboard panels imported by a given country.
The total import demand was estimated using model 11 and results are provided in Table 2. For estimations of CES quantity and price indices (formulas
10 and 11), average values of elasticity of substitution in Table 1 were used. The per capita Gross Domestic Product (GDP)―defl ated by the consumer price index of the United States and taking 2005 as base year―was used to represent the level of income.
Price elasticities and income elasticities of total import demand for fi berboard panels are expressed by the coeffi cients of variables Pi and GDP respectively. Model fi tting to Canada data showed autocorrelation which was corrected using the Cochrane-Orcutt method.
As for Germany, United States and France, models did not show good statistical fi tting, since R2 values were low. Model fitting to China data showed the highest coeffi cient of determination (0.954), indicating that 95.4% of variations in total demand for fi berboard panels from China are explained by the independent variables inserted for model fi tting.
Table 1 – Elasticities of substitution regarding fi berboard panel imports.
Tabela 1 – Valores das elasticidades de substituição da importação de painéis de fi bra de madeira.
Exporting countries Importing countries
1
AL CA CH EUA FR IT RE RU RDM1
Germany - -3.316 -0.819 -2.357 -1.530 -0.605 -0.106 -0.570 0.148
Austria -0.480 -2.401 -0.213 -1.494 -0.808 -1.517 1.361 0.221 -1.836
Belgium -0.548 -2.334 -0.933 -0.027 -1.198 0.168 0.094 -0.226 -1.450
Brazil -0.012 -0.226 0.836 -0.170 -1.109 -1.564 -1.736 -2.275 -1.520
Canada -0.982 - -0.882 -0.821 -0.948 -0.743 -1.096 0.738 0.644
China 0.172 -3.176 - -0.322 -0.882 -0.441 -2.815 2.241 4.952
Spain -3.431 -1.067 -1.260 -0.371 -0.794 0.640 -1.517 -0.782 -0.881
United States -1.367 1.304 -0.626 - -0.210 -1.263 -0.534 0.971 1.562
France -1.639 -1.523 -1.150 -0.725 - -0.783 -1.304 -1.529 -0.596
Holland -1.815 -2.171 -0.626 1.273 -0.692 -1.275 -1.922 -1.327 -1.821
Italy -1.364 -0.457 -0.981 -0.656 -0.559 - -1.532 -1.947 -0.284
Norway -1.036 -0.840 0.307 -0.234 -2.000 0.946 -0.494 -0.937 -0.078
Poland 0.553 3.055 -0.222 2.425 -0.635 -0.966 -0.399 -1.364 -1.142
United Kingdom -0.295 -6.313 -0.736 -1.368 0.233 -0.812 - -0.485 -1.223
Russia -1.847 0.954 -0.941 -0.613 -0.788 -1.746 -2.062 - -1.520
Sweden -0.364 2.767 -1.594 -0.430 0.995 -0.394 0.132 0.376 0.215
Switzerland -0.839 0.843 -2.169 1.085 -1.190 -2.409 0.148 -2.506 -1.180
Rest of the World -0.998 -1.003 0.106 -0.605 -0.760 -0.148 -0.918 0.376 -0.164
Average -0.958 -0.936 -0.700 -0.318 -0.711 -0.760 -0.865 -0.531 -0.343
Table 2 – Equations of total import demand for fi berboard panels.
Tabela 2 –Equações de demanda total de importação de painéis de fi bra de madeira.
Importing country Intercept Pi 1 coef
fi cient Per capita GDP 2 coeffi cient
Lagged dependent variable coeffi cient R
2
Germany 19.634 (1.065) -1.301 (-1.132) 0.151 (0.105) 0.056 (0.128) 0.223 Canada ♦ 7.350 (1.144) -1.053 (-2.039) 1.848 (2.430) -0.602 (-1.644) 0.613 China 43.889 (9.632) -2.277 (-6.893) -1.946 (-6.509) -0.138 (-0.939) 0.954 United States -83.709 (-1.262) -0.396 (-0.421) 9.427 (1.492) -0.388 (-1.119) 0.342
France -5.059 (-0.458) -1.368 (-1.794) 2.274 (1.548) 0.316 (1.089) 0.422 Italy -10.590 (-1.678) -1.036 (-2.804) 2.379 (2.663) 0.488 (2.351) 0.842
United Kingdom 5.446 (0.752) -1.177 (-2.028) 1.105 (2.258) 0.590 (2.316) 0.719 Russia 6.917 (1.385) -1.340 (-1.943) 1.760 (3.068) -0.100 (-0.304) 0.806 Rest of the World -35.120 (-2.256) -1.361 (-1.156) 7.575 (3.091) -0.101 (-0.337) 0.890
Values in brackets refer to Student’s t-statistic.
♦ indicates presence of autocorrelation, as demonstrated by Durbin’s h-statistic. 1Refers to price elasticities of total import demand for
fi berboard panels. 2Refers to income elasticities of total import demand for
fi berboard panels. An analysis of the statistical significance of
coeffi cients by Student’s t-test revealed that fi ve price elasticities were signifi cant, at the 10% level or less, and fi ve income elasticities were signifi cant, at the 5% level or less. The coeffi cient of the lagged dependent variable of Canada, Italy and United Kingdom was signifi cant, at the 10% level or less, indicating that the demand for fi berboard panels in those countries does not adjust instantly, due to variations in import prices and levels of income.
The sign of price elasticities was negative in all equations, agreeing with descriptions in the theory of demand. Except for the United States, all price elasticities were higher than one, indicating that, in those countries, a change in the price of fi berboard panels, all other things being held constant, would cause more than proportional changes in demanded quantities, characterizing an elastic demand in relation to price.
As regards the United States, the value -0.396 for price elasticity indicates that total import demand for fi berboard panels is hardly sensitive to variations in price since, if product price increases by 10%, all other things being held constant, the quantity imported by the country only drops by 3.96%. It should be noted that the United States is the world’s largest importer of fi berboard panels, accounting for about 14% of the global total sold in 2007. Therefore, it can be inferred that the United States will affect the price of this product according to its choice of supply source.
The sign of income elasticities of importing countries was positive, except for China, contradicting principles in the theory of demand.
Judging by the magnitude of most estimated coeffi cients (higher than one), it becomes evident that the total import demand for fi berboard panels from the countries being considered is very sensitive to variations in income, which characterizes an elastic demand for the product. A 10% increase in the per capita GDP of Canada, United States, France, Italy, United Kingdom, Russia and Rest of the World, all other things being held constant, causes a 18.48%, 94.27%, 22.74%, 23.79%, 11.05%, 17.60% and 75.75% rise in demand respectively.
As regards Germany, demand proved inelastic with respect to income. The income elasticity value of 0.151 indicates that a 10% increase in the country’s per capita income, all other things being held constant, only increases demand by 1.51%.
Own-price and cross-price elasticities of demand for fi berboard panels differentiated by country of origin were obtained through formulas 8 and 9, computing average elasticities of substitution of model (12) (second-stage equations), price elasticities of total import demand for panels (fi rst-stage equations), and ratios of spending from importing countries, as illustrated in Table 3.
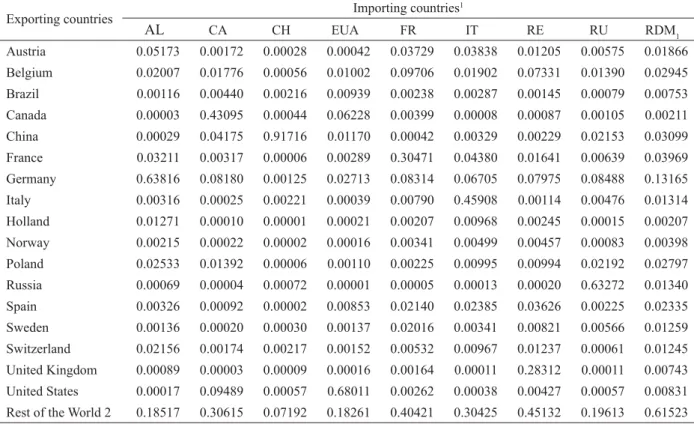
domestically, that is, within Germany. The remaining panels were bought from other countries in the following ratios: Austria 5.17%, Belgium 2.00%, United States 0.01%, Italy 0.31%, Sweden 0.13%, France 3.21%, Canada 0.003%, Brazil 0.11%, China 0.02%, Holland 1.27%, Norway 0.21%, Poland 2.53%, Russia 0.06%, Spain 0.32%, Switzerland 2.15%, United Kingdom 0.08%, and Rest of the World 18.51%.
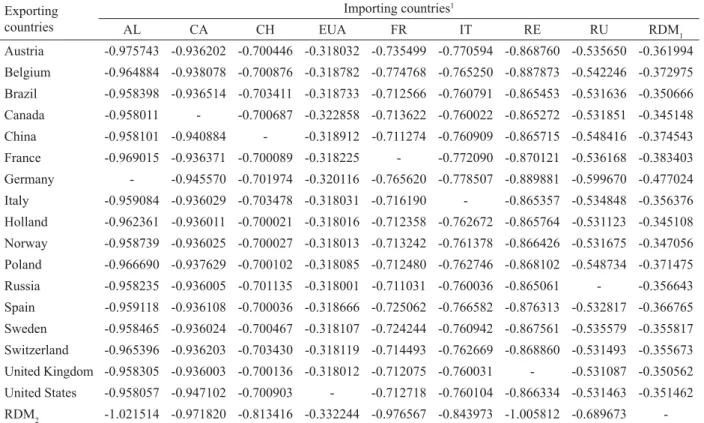
Own-price elasticities of import demand for fi berboard panels, as differentiated by country of origin, are provided in Table 4. The demand was inelastic in all markets, except in the case of the United Kingdom, in which the countries grouped as Rest of the World (RDM2) had an elastic demand.
Taking as an example the case of Germany as importer and Brazil as exporter, the value -0.9584 for own-price elasticity of demand concerning Brazilian exports
indicates that, if the price of Brazilian panels is subjected to a 10% increase, the demand from Germany for panels originating in Brazil drops by 9.584%. It can be thus said that changes in the price of Brazilian fi berboard panels cause less than proportional changes in product quantities demanded by Germany.
Where the elasticity of substitution is smaller than the price elasticity of total import demand, as is the case with all markets considered here, a direct relationship is expected between the ratio of spending on panel imports and the own-price and cross-price elasticities. This can be demonstrated by comparing, for instance, the elasticities of Belgium and Russia in relation to the French market, where elasticities of substitution and price were 0.711 and -1.368 respectively. Belgium accounts for 9.706% of the total value imported by France and is its largest supplier of panels. For this reason, the French own-price (-0.77477) Table 3 – Ratio of spending on imports of fi berboard panels produced by relevant exporting countries, concerning the 2004-2006 period. Tabela 3 –Proporção dos gastos com a importação de painéis de fi bra de madeira produzido nos diversos países exportadores, referente ao período 2004-2006.
Exporting countries Importing countries
1
AL CA CH EUA FR IT RE RU RDM1
Austria 0.05173 0.00172 0.00028 0.00042 0.03729 0.03838 0.01205 0.00575 0.01866 Belgium 0.02007 0.01776 0.00056 0.01002 0.09706 0.01902 0.07331 0.01390 0.02945 Brazil 0.00116 0.00440 0.00216 0.00939 0.00238 0.00287 0.00145 0.00079 0.00753 Canada 0.00003 0.43095 0.00044 0.06228 0.00399 0.00008 0.00087 0.00105 0.00211
China 0.00029 0.04175 0.91716 0.01170 0.00042 0.00329 0.00229 0.02153 0.03099 France 0.03211 0.00317 0.00006 0.00289 0.30471 0.04380 0.01641 0.00639 0.03969 Germany 0.63816 0.08180 0.00125 0.02713 0.08314 0.06705 0.07975 0.08488 0.13165 Italy 0.00316 0.00025 0.00221 0.00039 0.00790 0.45908 0.00114 0.00476 0.01314
Holland 0.01271 0.00010 0.00001 0.00021 0.00207 0.00968 0.00245 0.00015 0.00207 Norway 0.00215 0.00022 0.00002 0.00016 0.00341 0.00499 0.00457 0.00083 0.00398 Poland 0.02533 0.01392 0.00006 0.00110 0.00225 0.00995 0.00994 0.02192 0.02797 Russia 0.00069 0.00004 0.00072 0.00001 0.00005 0.00013 0.00020 0.63272 0.01340
Spain 0.00326 0.00092 0.00002 0.00853 0.02140 0.02385 0.03626 0.00225 0.02335 Sweden 0.00136 0.00020 0.00030 0.00137 0.02016 0.00341 0.00821 0.00566 0.01259 Switzerland 0.02156 0.00174 0.00217 0.00152 0.00532 0.00967 0.01237 0.00061 0.01245
United Kingdom 0.00089 0.00003 0.00009 0.00016 0.00164 0.00011 0.28312 0.00011 0.00743 United States 0.00017 0.09489 0.00057 0.68011 0.00262 0.00038 0.00427 0.00057 0.00831 Rest of the World 2 0.18517 0.30615 0.07192 0.18261 0.40421 0.30425 0.45132 0.19613 0.61523
Source: FAO (2008).
Table 4 –Own-price elasticities (ηijj) of import demand for fi berboard panels in relevant countries.
Tabela 4 –Elasticidades-preço diretas (ηijj) da demanda de importação de painel de fi bra de madeira dos países considerados.
Exporting countries
Importing countries1
AL CA CH EUA FR IT RE RU RDM1
Austria -0.975743 -0.936202 -0.700446 -0.318032 -0.735499 -0.770594 -0.868760 -0.535650 -0.361994 Belgium -0.964884 -0.938078 -0.700876 -0.318782 -0.774768 -0.765250 -0.887873 -0.542246 -0.372975 Brazil -0.958398 -0.936514 -0.703411 -0.318733 -0.712566 -0.760791 -0.865453 -0.531636 -0.350666
Canada -0.958011 - -0.700687 -0.322858 -0.713622 -0.760022 -0.865272 -0.531851 -0.345148 China -0.958101 -0.940884 - -0.318912 -0.711274 -0.760909 -0.865715 -0.548416 -0.374543 France -0.969015 -0.936371 -0.700089 -0.318225 - -0.772090 -0.870121 -0.536168 -0.383403
Germany - -0.945570 -0.701974 -0.320116 -0.765620 -0.778507 -0.889881 -0.599670 -0.477024 Italy -0.959084 -0.936029 -0.703478 -0.318031 -0.716190 - -0.865357 -0.534848 -0.356376 Holland -0.962361 -0.936011 -0.700021 -0.318016 -0.712358 -0.762672 -0.865764 -0.531123 -0.345108
Norway -0.958739 -0.936025 -0.700027 -0.318013 -0.713242 -0.761378 -0.866426 -0.531675 -0.347056 Poland -0.966690 -0.937629 -0.700102 -0.318085 -0.712480 -0.762746 -0.868102 -0.548734 -0.371475 Russia -0.958235 -0.936005 -0.701135 -0.318001 -0.711031 -0.760036 -0.865061 - -0.356643
Spain -0.959118 -0.936108 -0.700036 -0.318666 -0.725062 -0.766582 -0.876313 -0.532817 -0.366765 Sweden -0.958465 -0.936024 -0.700467 -0.318107 -0.724244 -0.760942 -0.867561 -0.535579 -0.355817
Switzerland -0.965396 -0.936203 -0.703430 -0.318119 -0.714493 -0.762669 -0.868860 -0.531493 -0.355673 United Kingdom -0.958305 -0.936003 -0.700136 -0.318012 -0.712075 -0.760031 - -0.531087 -0.350562 United States -0.958057 -0.947102 -0.700903 - -0.712718 -0.760104 -0.866334 -0.531463 -0.351462
RDM2 -1.021514 -0.971820 -0.813416 -0.332244 -0.976567 -0.843973 -1.005812 -0.689673
-1Importing countries: Germany (AL), Canada (CA), China (CH), United States (EUA), France (FR), Italy (IT), United Kingdom (RE), Russia (RU) and Rest of the World (RDM1).
2Exporting country: Rest of the World (RDM 2).
and cross-price (-0.06377) elasticities are the highest. Russia, on the other hand, has the weakest participation in the French market (0.0005%), with own-price (-0.71103) and cross-price (-0.0003) elasticities being the lowest in the French market.
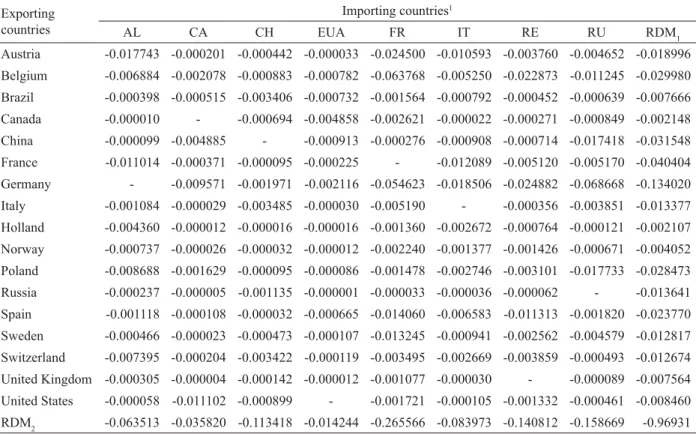
Where the elasticity of substitution is greater than the price elasticity of total import demand, though not the case in this study, an inverse relationship would be expected between the ratio of spending on imports and the own-price elasticity, while a direct relationship would be expected between the ratio and the cross-price elasticity. Cross-price elasticities of demand for fi berboard panels differentiated by country of origin are illustrated in Table 5. Negative values indicate a certain complementarity in the use of fi berboard panels in relevant markets. It is thus expected that an increase in the price of panels from a given country, all other things being held constant, will reduce the demand for panels offered by a competitor
country. Taking the case of China as importer as an example, the value -0.0034 of cross-price elasticity of Brazil in that market indicates that, should there be an increase of 10% in the price of Brazilian fi berboard panels, all other things being held constant, the demand from China for panels exported by competitor countries drops by 0.034%.
Table 5 – Cross-price elasticities (ηijh) of import demand for fi berboard panels in relevant countries.
Tabela 5 –Elasticidades-preço cruzadas (ηijh), da demanda de importação de painel de fi bra de madeira dos países considerados.
Exporting countries
Importing countries1
AL CA CH EUA FR IT RE RU RDM1
Austria -0.017743 -0.000201 -0.000442 -0.000033 -0.024500 -0.010593 -0.003760 -0.004652 -0.018996
Belgium -0.006884 -0.002078 -0.000883 -0.000782 -0.063768 -0.005250 -0.022873 -0.011245 -0.029980
Brazil -0.000398 -0.000515 -0.003406 -0.000732 -0.001564 -0.000792 -0.000452 -0.000639 -0.007666 Canada -0.000010 - -0.000694 -0.004858 -0.002621 -0.000022 -0.000271 -0.000849 -0.002148
China -0.000099 -0.004885 - -0.000913 -0.000276 -0.000908 -0.000714 -0.017418 -0.031548
France -0.011014 -0.000371 -0.000095 -0.000225 - -0.012089 -0.005120 -0.005170 -0.040404
Germany - -0.009571 -0.001971 -0.002116 -0.054623 -0.018506 -0.024882 -0.068668 -0.134020 Italy -0.001084 -0.000029 -0.003485 -0.000030 -0.005190 - -0.000356 -0.003851 -0.013377
Holland -0.004360 -0.000012 -0.000016 -0.000016 -0.001360 -0.002672 -0.000764 -0.000121 -0.002107
Norway -0.000737 -0.000026 -0.000032 -0.000012 -0.002240 -0.001377 -0.001426 -0.000671 -0.004052 Poland -0.008688 -0.001629 -0.000095 -0.000086 -0.001478 -0.002746 -0.003101 -0.017733 -0.028473
Russia -0.000237 -0.000005 -0.001135 -0.000001 -0.000033 -0.000036 -0.000062 - -0.013641
Spain -0.001118 -0.000108 -0.000032 -0.000665 -0.014060 -0.006583 -0.011313 -0.001820 -0.023770 Sweden -0.000466 -0.000023 -0.000473 -0.000107 -0.013245 -0.000941 -0.002562 -0.004579 -0.012817
Switzerland -0.007395 -0.000204 -0.003422 -0.000119 -0.003495 -0.002669 -0.003859 -0.000493 -0.012674
United Kingdom -0.000305 -0.000004 -0.000142 -0.000012 -0.001077 -0.000030 - -0.000089 -0.007564 United States -0.000058 -0.011102 -0.000899 - -0.001721 -0.000105 -0.001332 -0.000461 -0.008460
RDM2 -0.063513 -0.035820 -0.113418 -0.014244 -0.265566 -0.083973 -0.140812 -0.158669 -0.96931
1Importing countries: Germany (AL), Canada (CA), China (CH), United States (EUA), France (FR), Italy (IT), United Kingdom (RE), Russia (RU) and Rest of the World (RDM1).
Thus, a 10% increase in the price of Brazilian panels, all other things being held constant, reduces by 0.04918% the total quantity China imports from Brazil, there being thus a decline in the Chinese market in the same proportion.
The import substitution effect indicates that 0.01512% of the panel total China was importing from Brazil should shift to being bought from a competitor country. Yet the Chinese market shrank at a higher rate (0.004918) than the rate of imports substitution (0.001512), causing a drop in the rate of sales from the competitor country(ies) to China, of 0.0034. This explains the magnitude and negative sign of cross-price elasticity of Brazil with respect to China.
It should be noted that the net effect is clearly dependent on the magnitude of the elasticity of substitution (σi) and of the price elasticity of total import demand for panels (ηi). As in this study σi was lower than ηi in all markets, the cross-price elasticity was also negative in
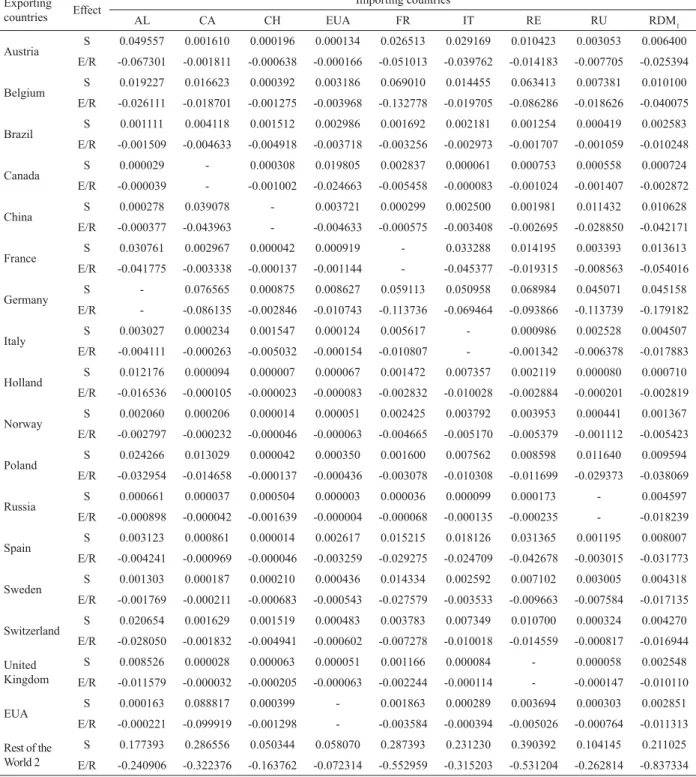
all of them. Where, in a given market, there is an increase in the price of panels from exporting country h, all other things being held constant, the decrease in the total quantity of panels imported by that market will be greater than the increase in the quantity imported, induced by the substitution of panels from country h for panels from country j. Substitution effects and market reduction (or expansion) effects for all markets are illustrated in Table 6.
Table 6 – Decomposition of cross-price elasticities of import demand for fi berboard panels of importing countries into import substitution (S) and market expansion (E/R) effects.
Tabela 6 – Decomposição das elasticidades-preço cruzadas da demanda de importação de painéis de fi bra de madeira dos países importadores em efeitos substituição de importações (S) e expansão (E/R) do mercado.
Exporting
countries Effect
Importing countries
AL CA CH EUA FR IT RE RU RDM1
Austria S 0.049557 0.001610 0.000196 0.000134 0.026513 0.029169 0.010423 0.003053 0.006400
E/R -0.067301 -0.001811 -0.000638 -0.000166 -0.051013 -0.039762 -0.014183 -0.007705 -0.025394
Belgium S 0.019227 0.016623 0.000392 0.003186 0.069010 0.014455 0.063413 0.007381 0.010100
E/R -0.026111 -0.018701 -0.001275 -0.003968 -0.132778 -0.019705 -0.086286 -0.018626 -0.040075
Brazil S 0.001111 0.004118 0.001512 0.002986 0.001692 0.002181 0.001254 0.000419 0.002583
E/R -0.001509 -0.004633 -0.004918 -0.003718 -0.003256 -0.002973 -0.001707 -0.001059 -0.010248
Canada S 0.000029 - 0.000308 0.019805 0.002837 0.000061 0.000753 0.000558 0.000724
E/R -0.000039 - -0.001002 -0.024663 -0.005458 -0.000083 -0.001024 -0.001407 -0.002872
China S 0.000278 0.039078 - 0.003721 0.000299 0.002500 0.001981 0.011432 0.010628
E/R -0.000377 -0.043963 - -0.004633 -0.000575 -0.003408 -0.002695 -0.028850 -0.042171
France S 0.030761 0.002967 0.000042 0.000919 - 0.033288 0.014195 0.003393 0.013613
E/R -0.041775 -0.003338 -0.000137 -0.001144 - -0.045377 -0.019315 -0.008563 -0.054016
Germany S - 0.076565 0.000875 0.008627 0.059113 0.050958 0.068984 0.045071 0.045158
E/R - -0.086135 -0.002846 -0.010743 -0.113736 -0.069464 -0.093866 -0.113739 -0.179182
Italy S 0.003027 0.000234 0.001547 0.000124 0.005617 - 0.000986 0.002528 0.004507
E/R -0.004111 -0.000263 -0.005032 -0.000154 -0.010807 - -0.001342 -0.006378 -0.017883
Holland S 0.012176 0.000094 0.000007 0.000067 0.001472 0.007357 0.002119 0.000080 0.000710
E/R -0.016536 -0.000105 -0.000023 -0.000083 -0.002832 -0.010028 -0.002884 -0.000201 -0.002819
Norway S 0.002060 0.000206 0.000014 0.000051 0.002425 0.003792 0.003953 0.000441 0.001367
E/R -0.002797 -0.000232 -0.000046 -0.000063 -0.004665 -0.005170 -0.005379 -0.001112 -0.005423
Poland S 0.024266 0.013029 0.000042 0.000350 0.001600 0.007562 0.008598 0.011640 0.009594
E/R -0.032954 -0.014658 -0.000137 -0.000436 -0.003078 -0.010308 -0.011699 -0.029373 -0.038069
Russia S 0.000661 0.000037 0.000504 0.000003 0.000036 0.000099 0.000173 - 0.004597
E/R -0.000898 -0.000042 -0.001639 -0.000004 -0.000068 -0.000135 -0.000235 - -0.018239
Spain S 0.003123 0.000861 0.000014 0.002617 0.015215 0.018126 0.031365 0.001195 0.008007
E/R -0.004241 -0.000969 -0.000046 -0.003259 -0.029275 -0.024709 -0.042678 -0.003015 -0.031773
Sweden S 0.001303 0.000187 0.000210 0.000436 0.014334 0.002592 0.007102 0.003005 0.004318
E/R -0.001769 -0.000211 -0.000683 -0.000543 -0.027579 -0.003533 -0.009663 -0.007584 -0.017135
Switzerland S 0.020654 0.001629 0.001519 0.000483 0.003783 0.007349 0.010700 0.000324 0.004270
E/R -0.028050 -0.001832 -0.004941 -0.000602 -0.007278 -0.010018 -0.014559 -0.000817 -0.016944
United Kingdom
S 0.008526 0.000028 0.000063 0.000051 0.001166 0.000084 - 0.000058 0.002548
E/R -0.011579 -0.000032 -0.000205 -0.000063 -0.002244 -0.000114 - -0.000147 -0.010110
EUA S 0.000163 0.088817 0.000399 - 0.001863 0.000289 0.003694 0.000303 0.002851
E/R -0.000221 -0.099919 -0.001298 - -0.003584 -0.000394 -0.005026 -0.000764 -0.011313
Rest of the World 2
S 0.177393 0.286556 0.050344 0.058070 0.287393 0.231230 0.390392 0.104145 0.211025
Table 7 – Decomposition of own-price elasticities of import demand for fi berboard panels of importing countries into imports substitution (S) and market expansion (E/R) effects.
Tabela 7 –Decomposição das elasticidades-preço diretas da demanda de importação de painéis de fi bra de madeira dos países importadores em efeitos substituição de importações (S) e expansão (E/R) do mercado.
Exporting
countries Effect
Importing countries
AL CA CH EUA FR IT RE RU RDM1
Austria S -0.908443 -0.934390 -0.699804 -0.317866 -0.684487 -0.730831 -0.854577 -0.527947 -0.336600
E/R -0.067301 -0.001811 -0.000638 -0.000166 -0.051013 -0.039762 -0.014183 -0.007705 -0.025394
Belgium S -0.938773 -0.919377 -0.699608 -0.314814 -0.641990 -0.745545 -0.801587 -0.523619 -0.332900
E/R -0,026111 -0,018701 -0,001275 -0,003968 -0,132778 -0,019705 -0,086286 -0,018626 -0,040075
Brazil S -0,956889 -0,931882 -0,698488 -0,315014 -0,709308 -0,757819 -0,863746 -0,530581 -0,340417
E/R -0,001509 -0,004633 -0,004918 -0,003718 -0,003256 -0,002973 -0,001707 -0,001059 -0,010248
Canada S -0,957971 - -0,699692 -0,298195 -0,708163 -0,759939 -0,864247 -0,530442 -0,342276
E/R -0,000039 - -0,001002 -0,024663 -0,005458 -0,000083 -0,001024 -0,001407 -0,002872
China S -0,957722 -0,896922 - -0,314279 -0,710701 -0,757500 -0,863019 -0,519568 -0,332372
E/R -0,000377 -0,043963 - -0,004633 -0,000575 -0,003408 -0,002695 -0,028850 -0,042171
France S -0,927239 -0,933033 -0,699958 -0,317081 - -0,726712 -0,850805 -0,527607 -0,329387
E/R -0.041775 -0.003338 -0.000137 -0.001144 - -0.045377 -0.019315 -0.008563 -0.054016
Germany S -0.958000 -0.859435 -0.699125 -0.309373 -0.651887 -0.709042 -0.796016 -0.485929 -0.297842
E/R - -0.086135 -0.002846 -0.010743 -0.113736 -0.069464 -0.093866 -0.113739 -0.179182
Italy S -0.954973 -0.935766 -0.698453 -0.317876 -0.705383 - -0.864014 -0.528472 -0.338493
E/R -0.004111 -0.000263 -0.005032 -0.000154 -0.010807 - -0.001342 -0.006378 -0.017883
Holland S -0.945824 -0.935906 -0.699993 -0.317933 -0.709528 -0.752643 -0.862881 -0.530920 -0.342290
E/R -0.016536 -0.000105 -0.000023 -0.000083 -0.002832 -0.010028 -0.002884 -0.000201 -0.002819
Norway S -0.955940 -0.935794 -0.699986 -0.317949 -0.708575 -0.756208 -0.861047 -0.530559 -0.341633
E/R -0.002797 -0.000232 -0.000046 -0.000063 -0.004665 -0.005170 -0.005379 -0.001112 -0.005423
Poland S -0.933734 -0.922971 -0.699958 -0.317650 -0.709400 -0.752438 -0.856402 -0.519360 -0.333406
E/R -0.032954 -0.014658 -0.000137 -0.000436 -0.003078 -0.010308 -0.011699 -0.029373 -0.038069
Russia S -0.957339 -0.935963 -0.699496 -0.317997 -0.710964 -0.759901 -0.864827 - -0.338403
E/R -0.000898 -0.000042 -0.001639 -0.000004 -0.000068 -0.000135 -0.000235 - -0.018239
Spain S -0.954877 -0.935139 -0.699986 -0.315383 -0.695785 -0.741874 -0.833635 -0.529805 -0.334993
E/R -0.004241 -0.000969 -0.000046 -0.003259 -0.029275 -0.024709 -0.042678 -0.003015 -0.031773
Sweden S -0.956697 -0.935813 -0.699790 -0.317564 -0.696666 -0.757408 -0.857898 -0.527995 -0.338682
E/R -0.001769 -0.000211 -0.000683 -0.000543 -0.027579 -0.003533 -0.009663 -0.007584 -0.017135
Switzerland S -0.937346 -0.934371 -0.698481 -0.317517 -0.707217 -0.752651 -0.854300 -0.530676 -0.338730
E/R -0.028050 -0.001832 -0.004941 -0.000602 -0.007278 -0.010018 -0.014559 -0.000817 -0.016944
United Kingdom
S -0.949474 -0.935972 -0.699937 -0.317949 -0.709834 -0.759916 - -0.530942 -0.340452
E/R -0.011579 -0.000032 -0.000205 -0.000063 -0.002244 -0.000114 - -0.000147 -0.010110
EUA S -0.957837 -0.847183 -0.699601 - -0.709137 -0.759711 -0.861306 -0.530697 -0.340149
E/R -0.000221 -0.099919 -0.001298 - -0.003584 -0.000394 -0.005026 -0.000764 -0.011313
Rest of the World 2
S -0.780607 -0.649444 -0.649656 -0.259930 -0.423607 -0.528770 -0.474608 -0.426855 -0.131975
A 10% increase in the price of panels offered by the United States, all other things being held constant, causes a 0.9992% reduction in imports by Canada, by virtue of the reduction in the total quantity of panels bought by Canada (market reduction effect). And 8.4718% of the total volume of panels Canada was importing from the United States is now going to be imported from the competitor country(ies) (product substitution effect). The resulting effect is a 9.471% decline in panel sales from United States into Canada, explaining the sign and magnitude of the price elasticity of the United States with respect to the Canadian market (-0.9471).
Considering the case of the United Kingdom, which is the country showing the weakest participation in the total value of panels imported by the Canadian market (0.0003%), a 10% increase in the price of panels there, all other things being held constant, will cause only a 0.00032% drop in the total imported by Canada. A greater impact will be created by the substitution of panels from the United Kingdom for panels from other countries, in other words, 9.3597% of panels Canada imports from the United Kingdom will be bought from other sources. The result is a 9.36% drop in panel sales from United Kingdom into Canada, explaining the sign and magnitude of the price elasticity of the United Kingdom with respect to the Canadian market.
4 CONCLUSIONS
In Germany, Canada, China, France, Italy, United Kingdom and China, the demand was price elastic, while in the United States the demand was price inelastic, suggesting that, given its large participation in the international market as buyer of fi berboard panels, the United States may affect prices depending on its choice of supply source.
Except in Germany and in the United States, price and income elasticities in the remaining importing countries were higher than one, suggesting that in such markets fi berboard panels can be considered a superior good.
In Germany, China and United Kingdom, the total import demand for fi berboard panels was more sensitive to variations in price than in income, while in the remaining importing countries the reverse happened.
The own-price elasticity of demand for fi berboard panels, distinguished by country of origin, was higher than one in almost all markets, except in Germany and in the United Kingdom.
The negative cross-price elasticity values suggest that fi berboard panels imported from other exporting countries are complementary products.
5 ACKNOWLEDGMENTS
The authors wish to thank the National Council for Scientifi c and Technological Development (CNPq) for granting the scholarship to the second author and for providing fi nancial support to the fi rst author by means of the Edital Universal.
6 REFERENCES
ABBOTT, P. C.; PAARLBERG, P. L. Modeling the impact of the 1980 grain embargo. In: UNITED STATES OF AMERICA. Department of Agriculture. Embargoes, surplus disposal and U. S. agriculture. Washington, 1986. chap. 11, p. 45-63. (Agricultural Economic Report, 64).
ARMINGTON, P. S. The geographic pattern of trade and the effects price changes. International Monetary Fund Staff Papers,Washington, v. 16, p. 179-199, Aug. 1969a.
ARMINGTON, P. S. A theory of demand for products distringuished by place of production. International Monetary Fund Staff Papers,Washington, v. 16, p. 159-178, Aug. 1969b.
BABULA, R. A. An Armington model of U. S. cotton exports. The Journal of Agricultural Ecnomics Research, London, v. 39, n. 4, p. 12-22, Apr. 1987.
BALL, R. J. (Ed.). The international linkage of national economics models. New York: North-Holland, 1973. 246 p.
BARROS, G. S. C. Economia da comercialização agrícola. Piracicaba: FEALQ, 1987. 306 p.
CHOU, J. J.; BUONGIORNO, J. United States demand for hardwood plywood imports by country of origen. Forest Science, Bethesda, v. 19, n. 2, p. 225-237, Feb. 1983.
CRUZ, E. S. Análise do comércio mundial de celulose e papel. 2001. 145 p. Dissertação (Mestrado em Floresta de Produção) – Universidade Federal de Lavras, Lavras, 2001.
FOOD AND AGRICULTURE ORGANIZATION. Base de dados FAOSTAT.Disponível em: <http://apps.fao.org>. Acesso em: 17 nov. 2008.
GALLANT, A. R.; GOEBEL, J. J. Nonlinear regression with autoregressive errors. Journal of the American Statistical Association, Washington, v. 71, n. 365, p. 961-967, Mar. 1976.
GOLDSTEIN, M.; KHAN, M. S. Large versus small price changes and the demannd for imports. International Monetary Fund Staff Papers, Washington, v. 23, n. 1, p. 200-225, Mar. 1976.
GRENNES, T.; JOHNSON, P. R.; THURSBY, M. The economcs of world grain trade. Englewood Cliffs: Praeger, 1979. 129 p.
JOHNSON, P. R.; GRENNES, T.; THURSBY, M. Trade models with differentiated producs. American Journal of Agricultural Economics, Saint Paul, v. 61, p. 120-127, June 1979.
KHAN, M. S. Import and export demand in developing countries. Internacional Monetary Fund Staff Papers, Washington, v. 21, n. 4, p. 678-693, Nov. 1974.
OLIVEIRA, A. D. Análise das possíveis mudanças comerciais e estruturais do mercado internacional de celulose. 1995. 131 f. Tese (Doutorado em Ciências Florestais) – Universidade Federal de Viçosa, Viçosa, 1995.
OLIVEIRA, A. D.; SILVA, O. M.; REZENDE, J. L. P. Importação de celulose: demandas diferenciadas por local de origem. Nova Economia, Belo Horizonte, v. 6, n. 1, p. 165-194, jul. 1996.
PENSON, J.; BABULA, R. Japanese monetary policies and U. S. agricultural exports. Journal of Agricultural Economics Research, London, v. 40, n. 1, p. 11-18, May 1998.
RIBEIRO, I. S. A. Análise do mercado internacional de compensado. 2003. 177 p. Dissertação (Mestrado em Ciências Florestais) – Universidade Federal de Lavras, Lavras, 2003.
SARRIS, A. H. European community enlargement and world trade in fruits an vegetables. American Journal of Agricultural Economics, Lexington, v. 65, n. 2, p. 235-246, May 1983.
SILVA, M. J. Selo Verde pode virar barreira não-tarifária. O Papel, São Paulo, v. 54, n. 9, p. 14-16, set. 1993.
SILVA, O. M. The international market for frozen concentrated orange juice: prospects for Brazil. 1990. 137 f. Thesis (Ph.D. in Economy) - North Carolina State University, Raleigh, 1990.
TURNOVISKY, S. J. International trading relationships for a small country: the case of New Zealand. Canadian Journal of Economics, Toronto, v. 1, n. 4, p. 772-790, Nov. 1968.
WILSON, J. F.; TAKACS, W. E. Differential responses to price and exchange rate infl uences in the foreign trade of selected industrial countries. Reviews EconomicStudies, Bristol, v. 61, n. 2, p. 267-279, May 1979.