Contents
Executive summary ... 3
Management problem ... 4
Relevance of the management problem for business organizations ... 6
Literature review ... 8
Data sources and methods used to collect data ... 11
Data treatment and analysis ... 14
Conclusions ... 17
Main learning’s ... 21
Executive summary
Considering the actual maturity of the Portuguese Telecommunication market, it has
become more lucrative for Telecom companies to significantly invest in a customer
relationship model based on retention than to invest efforts in consistently achieve growth
through the acquisition of new customers.
In order to successfully retain customers, it is crucial to identify what are the main drivers
related to the risk to potentially churn (i.e. proportion of subscribers who leave an operator
during a given time period) and what actions can be undertaken in order to avoid customers
to leave/switch to competitors.
To achieve it while being cost effective, retention efforts must be adjusted to the risk and
value of each client. To do so, it is necessary to segment the active customer base in terms
of context and consumption patterns that can predict an intention to churn, may it be
voluntary or involuntary and. By doing so, Telecom operators assure that resources are
invested in strategies that will result in significant return on investment, while strengthening
their competitive positioning.
In this context, churn management has become a fundamental management tool for
telecom operators. The definition of a conceptual framework to understand the causes and
predicting customers intention to churn is crucial to reduce the overall churn rate. This
report intends to describe the methodological approach used in designing a specific churn
management model for one of the biggest Portuguese Telecom player. The approach used
translated into the identification of behavior patterns by analyzing both contextual and
historical data, going one step further than the traditional approaches focused only on data
mining techniques (i.e. analysis of historical data generated from billing and contract
transactions) . From that, segmented strategies where designed, aimed to tackle the specific
Management problem
Currently, churn costs to European and U.S. telecom operators more than €4 billion per year,
representing churners a huge burden to the commercial operation of any operator.
(Kentritas, S. (ND). Customer Relationship Management: The SAS Perspective). Moreover,
operators with high churn rates (30% or plus per year) do not manage to have a return for
new customer since it takes in average three years to recuperate the acquisition cost.
Modisette identified three different types of churn according to the cause that lead clients
to switch/cancel their subscription with a telecom operator: unavoidable churn, involuntary
churn and voluntary churn (Modisette, L. (1999). Milking wireless churn for profit.
Telecommunications, Debham, Feb). Unavoidable churn happens whenever customers dye
or move away from the company’s operating area. This is the “natural” churn that every
telecom operator faces and that cannot or is hardly predictable and upon no management
practices can be undertaken in order to mitigate it. Involuntary churn happens when a
subscriber is disconnected by the operator due to lack of payment. Service disconnection
due to theft or fraud is also considered to be involuntary churn. Finally, voluntary churn is a
service disconnection decision taken by the customer who wishes to switch from one
operator to the other.
Schmitt also proposed the categorization of churn according to two variables: financial/non
financial and voluntary/involuntary churn (Schmitt, J. (1999). Churn: Can carriers cope?
Telecommunications, Debham, Feb). Financial churn is originated from bad-debt customers
while non-financial churn is originated by paying customers. On the other hand, voluntary
churn is the churn originated by the own will of the customer while involuntary churn is
Schmitt, J. (1999). Churn: Can carriers cope? Telecommunications, Debham, Feb)
The churn rate in the analyzed Portuguese telecom operator means an annual revenue loss
of around 30M€. The main responsible for that loss comes from the involuntary churn rate
(from now on designated as non-payment churn - NP Churn), being an issue of major
concern to the company.
Thus, it became crucial to the company to understand the profile of the clients deactivated
for non-payment in order to predict default risk and assess possible improvement
opportunities that could reduce the overall churn rate. The profile assessment focused on
identifying which context, consumption pattern, payment profile and satisfaction index
could influence the probability or not to default the company. Additionally, there was also
the need to design a segmented management model, where customers would be classified
in terms of risk and value, to proceed with more accurate and effective retention and
Relevance of the management problem for business organizations
The increased maturity and market liberalization in the Telecom industry in general, where
it is now usual to see all carriers competing across a multitude of services – from mobile to
fixed voice, from broadband to TV – has changed the industry making it more fierce than
ever. Switching from carrier to carrier has become more and more attractive, as promotions
have been an incentive for customers.
In this context churn has become a major concern for Telecom operators. There are now
critical issues that must be addressed in order for operators to maintain their market
competitiveness. How can we predict which clients are more leaned to switch? How can we
detect those clients? How can we predict when that change will happen?
In Europe, the monthly churn rate for mobile operators varies between 25 to 30 percent a
year. Considering that in average each lost customer represents around 500€ in lost
revenues, there is a high interest in investing in retention. Empirical studies show that
acquiring new subscribers is five times more expensive than retaining existing clients
(Berson et al. 2000; Wei and Chiu 2002; Hung, Yen and Wang 2006; Ahn, Han and Lee 2006).
It is evident that for mobile operators to succeed nowadays in mature markets such as the
Portuguese one, emphasis must be put on retaining more than acquiring. As such, effective
churn management models have become an important competitive tool, and crucial to the
customer relationship management. Those are able to predict with some certainty what is
the typical profile of clients that present a high probability of churning and those who
present more loyalty/stability, while identifying the main causes related to churn.
Therefore, churn management models are the base to define retention strategies. First
because it allows to understand what customers do a operator really want to retain? Is it
worth to invest effort in managing the life cycle of a customer unprofitable or that present a
very low margin? What win-back strategies must be employed for each type of client?
acquired. Knowing the profile of churners, it is easier to know which customers to attract
and to which extent can we improve the value proposition. How can we be cost-effective in
acquiring new clients?
Nonetheless, predicting customer churn isn’t a fairly easy task even more when considering
the involuntary churn, were customers don’t even signal their intention to leave the carrier.
Customers simply stop paying their invoices until they are completely disconnected.
Traditional management techniques are focused on identifying which groups of customers
are more prone to defect than others (Marco Richeldi and Alessandro Perrucci (2002).
Churn Analysis Case Study. Telecom Italia Lab). To do so, data mining techniques are the
most common used tool, since such techniques allow to identify churn patterns according to
historical transactional data (e.g. billing). But the growing complexity of the Telecom market
and the competitive urge as put a bigger emphasis in looking at the reasons that lead
customers to churn more than identifying when and who will churn.
As such, modern churn management models are focused not only in the data mining
techniques but also in the analysis of contextual data as the path to improve customer
satisfaction and therefore loyalty. Predicting who and when customers will churn is a crucial
tool for telecommunications companies to implement successful retention strategies.
Reviewing processes or customer incentive scheme can lead to higher retention capabilities.
Also, identifying causes of churn, may it be the lack of financial resources, insatisfaction with
the service or better offers from the competition is also important to assess what
Literature review
Data mining is described as a way to extract customer sensitive information from large
databases in a way that predictive informations are identified and isolated. The SAS Institute
describes data mining as “the process of selecting, exploring, and modeling large amounts of
data to uncover previously unknown patterns for a business advantage” (LU, Junxiang
(2001). Predicting Customer Churn in the Telecommunications – An application of Survival
Analysis Modeling Using SAS. Kansas – USA, Sprint Communication Company).
Many fields of study have used data mining techniques in order to solve managerial issues.
The technique has been used in several different industries in order to identify certain
specific patterns, and has been increasingly been used by telecommunication companies.
Research literature on data mining tools for predicting churn patterns are mainly focused on
using specific techniques like clusterization or decisions trees to identify links among several
sets of data. Understanding those links allow to identify specific behavioral patterns that
translate into a given probability to churn (Tsau Young Lin,Ying Xie,Anita Wasilewska (ND).
Data Mining: Foundations and Practice.).
Wei and Chang used data mining techniques in order to identify a specific customer group
who would be more responsive into subscribing to additional fixed landlines (Wei and Chang
(2000). Telecommunication Data Mining for Target Marketing. Journal of computer). To do
so, they have analyzed individual call patterns in order to indentify patterns that would
match the defined criteria’s for the target group. The results of the data mining have
showed great success since the target identified by the research was three times more
responsive than the rest of the customers into subscribing to additional fixed landlines.
Anand, S. S., Patricj, A. R., Hughes, J. G., and Bell D. A. have defined a data mining
methodology for cross-sales in the financial sector (Anand, S. S., Patricj, A. R., Hughes, J.
G.,and Bell D. A. (1998). A data mining methodology for cross-sales. Knowledge-based
systems, 10, 449-461). The conceptual frameworks relied on identifying customers common
characteristics and define rules that would cater a unique set of different outcomes in terms
of cross-sales potential. Moreover, the researchers identified, during the data mining
potential to be applied in other service sectors, something also referred by Anand et Al
when assessing the data mining application in a specific context.
On the other hand, and focusing in a more broad concept of customer relationship
management, Hung, Yen and Wang (2006) describe churn management as a practice based
on two main analytical processes: a first step based on identifying which type of customers
are prone to churn and a second step focused on designing a reactive strategy to retain
clients when they decide to desert.
Nonetheless, academic research has shown that the traditional approach based on data
mining techniques is a limited tool to face the challenge of retaining customers in the
current context. Data mining techniques are seen as a way to act on the consequences
rather than to act on the cause itself. As such, more than who and when, the challenge is to
understand why.
From a management perspective, the process to understand the causes that lead the
customers to churn are restricted in terms of the resources employed in this sort of complex
analysis (Berson 2000; Wei and Chiu 2002; Hung, Yen and Wang 2006; Ahn, Han and Lee
2006; Sohn and Kim 2008;Owczarczuk 2010; Bose and Chen 2009). Nowadays, identifying
the causes that lead customer to churn is a crucial component for the customer relationship
management and is seen as a very demanding task since churn related causes depend on a
wide variety of reasons related to each customer context (Koustuv Dasgupta, Rahul Singh,
Balaji Viswanathan, Dipanjan Chakraborty, Sougata Mukherjea, Amit A. Nanavati. Social Ties
and their Relevance to Churn in Mobile Telecom Networks. IBM India Research Lab.). To
deeply understand what motivates certain customers to churn and others not, it is
important to analyze more than just the data related to consumption patterns, focusing also
on contextual data such as region of origin or activation channel.
As such, the project undertaken at one of the leading Portuguese Telecom company has
used not only an approach based on data mining techniques, but also on identifying and
acting upon the main causes of churn. Considering the relevant literature review, a
segmenting the customer base and define probability of default and (2) main causes of
Data sources and methods used to collect data
In order to analyze churn indicators using data mining techniques and identify the main
causes of churn, both quantitative and qualitative data was collected.
The quantitative analysis was critical to sustain the project early hypotheses and was one of
the main activities of the project. A set of different indicators were analyzed in order to (1)
typify the profile of clients deactivated by non-payment and (2) typify the profile of the
current active base of postpaid customers. To do so, two main types of data were collected:
1. Billing and collection indicators
Evolution of postpaid billing
Evolution of provisions for uncollectable debts
Evolution of bad dept and its distribution in terms of number of days (60,90 and
more than 90 days)
2. Client data (both for deactivated clients and active clients in June 2010)
Client identification data (e.g. NIF; Account number; Service number)
Client “natural attributes” (e.g. Type of client; Contract duration; Sale channel)
Client consumption data (e.g. Average revenue per user (ARPU); Minutes of
usage (MOU))
Satisfaction index (e.g. Number and type of complaints)
Collection data (e.g. Payment record data)
All the collected data was desegregated by client segment and the considered time horizon
was minimum one year (July 2009 to June 2010) in order to isolate possible seasonability
effects.
The data was directly extracted from the internal Data Warehouse and then analyzed using
data treatment software (mainly Access) and other statistical software, since no internal
reports considered this specific information as part of the monitored KPIs. Due to the extent
consuming activity and a very sensitive activity to realize, since the resulting data would be
from then on considered as the valid internal benchmark.
In terms of the qualitative analysis carried on, it was critical to assess the main causes that
lead clients to be deactivated by non-payment. Additionally, it was also important to
understand what additional procedures could be implemented in order to facilitate the
payment management.
In order to do so, two set of different types of clients were interviewed via phone: 1256
clients whose invoice was due and 1.415 clients who had been deactivated by non-payment
(after all collection procedures failed). To them two additional questions (close format) were
asked along with the other collection/deactivation procedures:
1. What were the main reasons for the delay in the payment?
Didn’t receive the invoice
Invoice was wrong
Client pretended a invoice duplicate
Service was defective/had problems
Does not have financial resources to pay
Forgot
Has a non-resolved complaint
Other (open answer)
2. What procedures could make your (the client) payment management easier?
Phone contact from the operator
More warnings (via SMS or email)
Payment agreements
Extension of the payment term
Other (open answer)
In addition to both the quantitative and qualitative analysis, an extensive benchmark with
The benchmark considered 5 other European operations that demonstrated consistent
indicators in at least one or more indicators relevant to the analysis carried on in the
Portuguese operation (e.g. Bad debt; Direct Debit payment penetration; Involuntary churn).
In order to gather the data, video conferences with each one of the operations was held
with the local credit managers/churn managers and data regarding the above issues was
collected:
Rationale for the good indicators (e.g. Low bad debt rate despite high level of
acceptance and low level direct debit payments)
Organizational structure
Collection procedures
Data treatment and analysis
In terms of data treatment, the project was very demanding due to the extent of data to be
analyzed and sources from which the data was extracted.
One major issue regarding the treatment of data was the constant need to cross-check the
extracted data with other sources of information in order to validate each source. The fact
that different information was extracted from different sources (e.g for the same client,
account informations and service informations were extracted from different sources)
meant that a huge work of cleaning the information base was needed previous to the data
analysis. As such, one of the main challenges was to stabilize the analyzed indicators (i.e.
monthly active customer base greatly differed from source to source). Deviations had to be
identified and isolate in order to get the same base across sources and therefore manage to
achieve comparable and congruent analysis.
According to several work hypotheses that were defined early on during the project, a
different set of analysis were carried on in order to identify the profile of churners and the
context related attributes that had a high correlation with the involuntary churn rate
(Appendix 1):
1. Analysis of the churn and revenue contribution per segment (i.e. Consumer, SOHO,
SME and Government), identifying which segments were crucial to address in order to
effectively reduce involuntary churn rate and revenue loss.
Analysis of the individual contribution of each postpaid segment to the overall
involuntary churn rate, identifying the segment that most contributed to the
non-payment churn rate.
Analysis of the individual contribution of each postpaid segment to the overall
postpaid billing, identifying the most important segment in terms of revenue
generator.
The matrix considering those two analysis allowed to identify priority targets to
address
Analysis of the impact of the origin of the client in terms of the probability of
defaulting, considering the percentage of total deactivations, involuntary churn rate
and standard deviation per district.
Analysis of the impact of the activation channel ( i.e. direct vs indirect channel) and
sub-channel in terms of the probability of defaulting, considering the percentage of
total deactivations, involuntary churn rate and standard deviation per channel.
Analysis of the impact of the type of payment method chosen by the customer ( i.e.
Direct Debit or other methods) in terms of the probability of defaulting, considering
the percentage of total deactivations, involuntary churn rate and standard deviation
per payment method.
Analysis of the impact of the type of handset ( i.e. 2/2,5G vs 3/3,5G) in terms of the
probability of defaulting, considering the percentage of total deactivations,
involuntary churn rate and standard deviation per type of handset.
Analysis of the probability of defaulting according to the life cycle of the client (e.g.
early defaulting; defaulting when near contract end), analyzing unusual deactivation
patterns during the key moments of the client lifecycle.
3. Analysis of the customers consumption data
Analysis of the involuntary churn rate per type of product (i.e. Voice, Mobile
broadband or ADSL) and within each type of pricing plan.
Analysis of unusual consumption patterns in terms of MOU and ARPU (i.e. high
increases/decreases of consumption near deactivation) that can denote a high
probability of defaulting.
Analysis of the probability of defaulting according to the client score and indirectly
client value (i.e. higher scores mean higher client value for the company). The
analysis meant to identify if the client management matched its value for the
company in terms of effort to retention.
4. Analysis of the customers satisfaction index
Analysis of the impact of the satisfaction index in the probability of defaulting.
Clients with pending complaints have different collection procedures, being
therefore clearly identifiable. As for, assessing the involuntary churn rate of this
Identification of the main problems (e.g. technical assistance; billing) related to
customer insatisfaction, measured by percentage of total complaints by motive.
5. Analysis of the customers collection data
Analysis of the recurrence level of customers who enter in collection procedures (i.e.
is there always the same customers?)
Breakdown of the number of customers per collection procedures:
Analysis of the volume in each step – letters, SMS and calls - (from warning
the customer to total deactivation)
Identification of the collection procedures that most impact the customers in
terms of intention to pay.
6. Analysis of the main causes of non-payment
Qualitative analysis of the main causes for non-payment from the customer
perspective, contrasting it with the preliminary work hypotheses.
Identification of potential improvement opportunities for the payment management
model and collection procedures that could be translated into more payment
Conclusions
The completion of the quantitative and qualitative analysis allowed to identify which were
the main causes to churn and attributes of the clients who were deactivated for
non-payment. In summary, the analysis concluded that:
There are significant differences of non-payment churn rates in terms of the district
of origin of the client. Those can be explained mainly to economic differences of
each region, especially relevant in the SOHO and SME segments. As such, the place
of origin as been considered as an important aspect to predict possible default
patterns.
There are significant differences of non-payment churn rates in terms of acquisition
channel. The indirect channel presents a much higher non-payment churn rate than
the one of the direct channel. This difference is once more very relevant for the
SOHO and SME segment. This difference can be explained by the difference of sales
skills and type of clients approached. The fact that the direct channel is a channel
that is much more trained and prepared to sell, and that only approaches the
high-end SME (that naturally have a lesser default probability) allows it to a have better
performance in terms of non-payment churn rate. Therefore, the channel of
acquisition has been considered as an important criterion for the non-payment
churn for its high correlation and standard deviation.
In terms of correlation of the client score (attributed according to the client value to
the company) with the non-payment churn rate, the quantitative analysis showed
that there is an asymmetry of the client value and its retention rate. The churn rate
increases from the low to the middle score and then decreases from the middle
score to the high score. As such, there might be an improvement opportunity to
adequate the service/monitoring of each client to its value.
Although there are no big churn rate differences in the Voice and ADSL products, the
Mobile Broadband clearly stands out with almost the double churn rate than the
other products. This is clearly related to specificity of the product itself. Unlike he
specific attributes of the product that don’t make it easily replaceable. As such, the
probability of default increases dramatically, even more when considering that those
customers are hard to reach in order to implement the collection procedures (most
of the clients don’t have an alternative phone number – the only registered phone
number is the one associated with the mobile broadband service). The type of
product has been considered highly correlated to the probability of churning for
non-payment.
The type of payment is highly correlated with the non-payment churn. The Direct
debit method can present as much as 10 times less probability of default than other
means of payment. Although it is not clear is this a cause or a consequence (i.e. are
clients who adhere to direct debit naturally better payers, or is it the payment
method who dictates if the customer will or not be a good payer?), the direct debit
presents many vantages compared to other ways of payment. Not only it reduces
the churn probability but also increases the company available cash flow since
payment are almost always due on time and never enter in the collection process
(saving operational costs to the operator).
Depending on the life cycle of the client, there are specific periods where the
probability of non-payment churn increases dramatically. The two main critical
moments where default occurs is (1) during the first 3 months of life (i.e. after
activation) of a customer. During this period many situations can happen, from
activating a client with clear fraud intentions to unsatisfied customers who refuse to
pay (e.g. the services are not correctly activated/not working properly), that lead to
increase churn rates and (2) near contract ending since from the ending of the
contract onwards no more penalties are applied to customers who decide to leave
(i.e. they simply have to pay the overdue last invoice and change operator). In this
case it is crucial to successfully lead a customer life cycle management program that
guarantees and effective monitoring o each client during the critical moments of its
life cycle. In this case also the client antiquity is seen as a crucial information in order
to assess the customer probability of defaulting.
In terms of consumption pattern, more than 50% of customers that were
deactivated for non-payment presented a very unusual consumption pattern the
registered a drastic reduction of the consumption (i.e a reduction of more than 50%
of the usual average monthly consumption) there was also a significant number of
cases were the consumption increased dramatically (i.e. an increase of more than
100% of the usual average monthly consumption). In this last case, and although in
some cases that difference can be explained by real communication needs variance,
in most of the cases are related to clients who are fraud since they already know that
they are being disconnected for non-payment. This is one of the clearest indicators
of probability of default that was encountered during the analysis, and is a trigger
that must be constantly monitorized in order to pre-identify churner and take
counter-measures.
There is a high correlation of clients who have pending complaints and the
probability of being disconnected for non-payment. Additionally the analysis showed
that from the clients disconnected for non-payment, more than 50% had had at least
one complaint in the 6 months previous to the deactivation. This high correlation can
be attributable mainly to two main causes: (1) the operator fails to satisfy the client
in terms of their complaints. The insatisfaction may arise from the fact that the
problem ends up not being solved or simply because the solution takes too long. (2)
some clients already are aware of the special collection policies for customers with
pending complaints (that are less strict) and therefore use that strategy in their favor
to continue to use the service without paying/having a broader payment time. Once
more, the complaint factor is seen as very relevant factor when assessing the
probability of a customer to eventually churn.
In terms of the collection procedures, there is a high number of repeats, meaning
that the customers whose invoice pass the due date are mostly all same. This can be
explained by the fact that most of the customers already are aware of the collection
procedures and timings, using it in their favor in order to delay as much as possible
the due payment. This happens mainly because the segmentation level of collection
procedures is not broad enough and mainly because it is static, allowing customer to
be aware of each collection step. Nonetheless, the quantitative analysis as allowed
to identify that early collection procedures have a much bigger impact in clients,
Finally, the qualitative analysis allowed to identify that most customers who are
deactivated for non-payment claim that the major problem was related to the fact
that they forgot to pay, despite the time lag between the invoice and all the
reminders. As ways to improve their payment management capacity of was referred
that more contacts via phone would be an effective mean to increase. But more
interesting than the affirmative questions was to assess that a very few percentage
of clients actually referred financial problems as one of the main problems of their
non-payment.
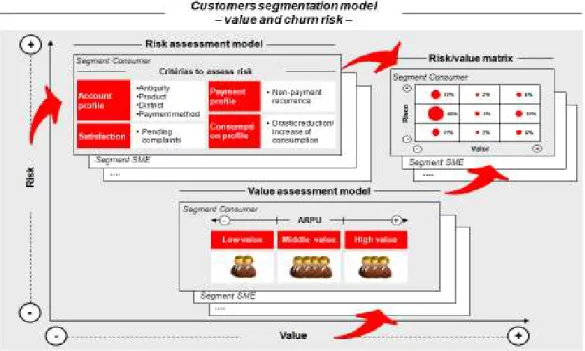
After having identified the attributes that most correlate to the involuntary churn rate and
the main causes of associated to non-payment, it was possible to segment the customer
base according to the risk/value of each customer (Figure 3) and define segmented actions
(Appendix 2).
Main learning’s
I considered this project has a very instructive one from different point of views.
First it allowed me to define a clear framework, adaptable to other similar type of projects,
to identify causes, understand consequences and define actions through data mining
techniques and context analysis. It was critical for the success of the project to trace early
hypotheses of what could eventually be related to the involuntary churn rate. From that
point develop a quantitative and qualitative approach to validate/dismiss criteria’s and
identify the typical profile of a “non-payment churner”. Finally to identify
operational/commercial/financial improvement opportunities that can lead to better
retention and financial performance.
Second, it allowed to get in touch with the Telecom industry in Portugal and have a broader
understanding of certain limitations imposed both externally and internally. Although
Portugal has a very competitive Telecom market, recognized has one of the most innovative
in the world, it is also true that there are some cultural and procedural limitations vis-à-vis
References
LU, Junxiang (2001). Predicting Customer Churn in the Telecommunications – An
application of Survival Analysis Modeling Using SAS. Kansas – USA, Sprint
Communication Company.
Koustuv Dasgupta, Rahul Singh, Balaji Viswanathan, Dipanjan Chakraborty, Sougata
Mukherjea, Amit A. Nanavati. Social Ties and their Relevance to Churn in Mobile
Telecom Networks. IBM India Research Lab.
Marco Richeldi and Alessandro Perrucci (2002). Churn Analysis Case Study. Telecom
Italia Lab
Tsau Young Lin,Ying Xie,Anita Wasilewska (ND). Data Mining: Foundations and
Practice.
Anand, S. S., Patricj, A. R., Hughes, J. G.,and Bell D. A. (1998). A data mining
methodology for cross-sales. Knowledge-based systems, 10, 449-461.
Kentritas, S. (ND). Customer Relationship Management: The SAS Perspective.
Wei and Chang (2000). Telecommunication Data Mining for Target Marketing.
Journal of computer.
Modisette, L. (1999). Milking wireless churn for profit. Telecommunications,
Debham, Feb