ABSTRACT
This paper examines the impact of Sovereign rating changes on the aggregate stock and bond market returns both in emerging and developed countries. Rating downgrades in emerging mar-kets are associated with significant negative wealth effects both in the stock and bond mar-kets. Moreover, the effects of rating down-grades persist up to six-months after the event. In contrast, upgrades in emerging markets con-vey no information. Rating changes in devel-oped markets have no significant impact on either stock and bond market returns. Rating agencies act pro-cyclically, downgrading coun-tries in bad times and, consequently, contribut-ing to the instability in emergcontribut-ing markets.
JEL Classification: F30; G14; G15
Keywords: Sovereign ratings; Stock markets; Bond markets; Event study
1. INTRODUCTION
This paper studies the long-run performance of Sovereign rating changes on the aggregate stock and bond market in both emerging and developed countries. We analyse separately the market response to upgrades and downgrades in each market and country.
The current study is motivated by the fact that, investors, in particularly fund managers, are increasingly focused on international diversifi-cation due to financial market integration. Thus, it is important to understand country risk and to be able to reliably assess the risk of investing in different national markets. The formation of international portfolios requires a range of fun-damental inputs for asset allocation decision and for active investment strategies. Furthermo-re, there are major information events that may affect the top-down choice of the basic alloca-tion of funds to different regions and naalloca-tional markets. The change of Sovereign ratings is one such key event that may trigger substantial recompositions of international portfolios.
Rating agencies have also been pointed out as promoters of financial instability. Their pro-cyclical behavior, upgrading countries in good times and downgrading them in bad times, may have contributed to magnifying the boom-bust pattern in stock markets. Even if rating agencies do not behave pro-cyclically, their announce-ments may still trigger market moveannounce-ments. This is because many institutional investors can only hold investment grade instruments (i.e. securi-ties with ratings above a certain threshold).
L
ONG
-R
UN
P
ERFORMANCE
OF
S
OVEREIGN
R
ATING
C
HANGES
C
LÁUDIA
C. C
ORREIA
*M
IGUEL
A. F
ERREIRA
*** - BANCO Santander de Negócios. | ISCTE Business School
Thus, changes in ratings, downgrading (upgrading) Sovereign debt below (above) investment grade, may have a drastic impact on prices because these rating changes can poten-tially affect the pool of investors. Rating chan-ges may also unveil new (private) information about a country and consequently they may fuel rallies or downturns. This effect is likely to be stronger in emerging markets where problems of asymmetric information and transparency are more severe.
Studies of Sovereign rating changes have mostly focused on the effects of ratings on the instruments being rated or on the instruments of the institutions being rated. This is the case of Cantor and Packer (1996), who examine the effects of Sovereign ratings on emerging mar-ket bond yield spreads. They conduct an event study using a short-run window (up to 20 days after the event) and find evidence that rating agencies’ opinions affect market spreads. A statistically significant government bond yield change in the expected direction follows the announcement of changes in the agencies’ Sovereign risk opinions. They also find that the impact of rating announcements on spreads is much stronger for below-investment-grade than for investment-grade Sovereigns. Furthermore, rating announcements that are more fully antici-pated have a larger impact than those that are less anticipated.
Sy (2001) studies the relationship between emerging markets Sovereign spreads and ratings on their long-term foreign currency denominate debt ratings. Using panel data he finds that there is a negative association bet-ween Sovereign spreads and ratings, which has been strengthened over the years. There is an
increasing dispersion of spreads for similar rated countries during crisis. This indicates that there is increasing discrimination between countries during episodes of market turbulence which is not based on credit ratings but on other factors which investors rely on to differentiate between countries.
There is recent literature that examines whether changes in bond ratings affect asset markets other than bonds. There may be various chan-nels of spillover that allow news on one particu-lar market to affect yields of other securities. For example, in the case of the downgrade of Sovereign bonds, stock markets can be adver-sely affected because governments may raise taxes on firms (and hurt firms’ future stream of profits) to neutralize the adverse budget effect of higher interest rates on government bonds triggered by the downgrade.
Dichev and Piotroski (2001) analyze the impact of bond rating changes on individual stocks. They find evidence of significant negative abnormal stock returns following downgrades, especially at subsequent earnings announce-ments. This suggests that the market does not fully anticipate the predictable future changes in earnings. Stock prices appear to under-react to the ratings change announcement, and conti-nue to drift in the direction of the announce-ment return for up to one year after the announ-cement.
219 : CADERNOS DO MERCADO DE VALORES MOBILIÁRIOS
stocks, also apply at the aggregate country level. They employ an event study methodology to detect the abnormal returns resulting from an upgrade or downgrade announcement, both on foreign and local currency ratings. There is lit-tle evidence of abnormal stock returns behavior following rating upgrades over a short-run event window (up to ten days after the event), while for rating downgrades (only for foreign currency downgrades but not for local currency downgrades) the impact is significantly negati-ve. They also conclude that, irrespective of whether returns are denominated in domestic currencies or US dollars, the wealth impact of a Sovereign rating downgrade holds. Moreover, emerging markets do not appear to be particu-larly more sensitive to Sovereign rating change than developed countries.
Changes in ratings of assets from one country can trigger contagious movements in other countries. These cross-country contagion effects can be large, as was the case of the spil-lover effects of the Russian default on develo-ped and developing countries. Rating agencies may contribute to these co-movements in finan-cial markets around the world.
Cross-country and also cross-security spillover effects of rating changes are examined by Kaminsky and Schmukler (2002). Their study contributes to the literature on contagion and international transmission of shocks by exami-ning the effect of domestic vulnerability, as measured by the ratings of credit agencies, on the extent of international spillovers. They con-duct an event study to analyze the evolution of a country’s bond market spread (i.e. Sovereign bond yield spread relative to the U.S. Treasu-ries) and stock market spread (domestic stock return relative to the U.S. stock market return)
in a short-run window (10 days) around an upgrade or downgrade of an actual rating or outlook.
They find that both rating and outlook changes significantly affect bond and stock markets, with yield spreads increasing and stock returns declining in response to a downgrade. Rating changes also contribute to contagion or spillo-ver effects, with rating changes of bonds of one emerging market triggering changes in both yield spreads and stock returns of other emer-ging economies. Lastly, their results suggest that rating agencies act pro-cyclically, down-grading countries in bad times and updown-grading them in good times. In this sense, rating agen-cies might add instability to financial markets in emerging economies.
markets of other emerging market economies although the spillover effects tend to be re-gional.
Gande and Parsley (2002) examine the nature of cross-border financial market linkages. They focus on the transmission of news concerning Sovereign credit ratings, to Sovereign bonds issued by other countries. In particular, they concentrate on the spillover of a change in the Sovereign debt rating or the credit outlook of one country, to interest rate spreads on Sove-reign debt for other countries. They find evi-dence of asymmetric spillover effects, i.e., posi-tive ratings events abroad have no discernable impact on Sovereign spreads, whereas negative ratings events abroad are associated with an increase in spreads.
This paper contributes to the literature on Sov-ereign ratings by examining both the short and long-run effects of rating changes on own coun-try aggregate stock and bond markets. We measure the aggregate stock and bond market impact of Sovereign rating changes using an event study methodology. We examine the evo-lution of stock market spreads (domestic stock market returns relative to a benchmark) and bond market spreads (Sovereign bond yield spreads relative to a benchmark) following an upgrade or downgrade of an actual Sovereign rating. We include rating changes for both emerging and developed countries, which al-lows us to study the possibility of different im-pact across countries based on their degree of economic development.
Event studies can also provide evidence on whether rating agencies act pro-cyclically, downgrading countries during bad times and upgrading them during good times. Event
studies can also bring to the forefront whether the actions of rating agencies have sustained or merely transitory effects on financial markets and if these effects are likely to be stronger in emerging markets, where problems of asymme-tric information and transparency are more severe.
Our findings should be of great interest to investors and particularly managed investment funds, who are increasingly focused on interna-tional diversification, since a change in Sove-reign ratings is a key event regarding the asset allocation decision.
Our main results can be summarized as follows. First, we find that rating downgrades have a significantly negative impact on own national aggregate financial markets, especially in emer-ging markets. Rating changes significantly affect emerging countries’ bond and stock mar-kets, with bond yield spreads increasing and stock returns declining considerably in response to a downgrade. The short-run impact of rating changes in developed countries is restricted to bond markets. Thus, while the negative effect of sovereign debt rating downgrades does spill over to other assets markets in emerging coun-tries, this is not the case in developed markets.
Second, in contrast to downgrades, rating upgrades do not have a significant impact on financial markets’ subsequent returns. Conse-quently, our findings largely echo those already documented that upgrades do not have a great wealth impact, while downgrades have signifi-cant impact.
221 : CADERNOS DO MERCADO DE VALORES MOBILIÁRIOS
information about emerging countries. This result is novel in the literature and contrasts with the findings in Brooks et al. (2002) where there is no significant difference between the impact in developed and emerging countries. The conflicting results can be explained by a different sample period and methodology.
Fourth, we study the performance of rating changes over several event windows up to two-year after the rating announcement. This is the first study of the long-run impact of Sovereign rating changes for horizons greater than one-month. We find that the negative wealth impact of a Sovereign rating downgrade persists up to six months after the rating downgrade both in the aggregate stock and bond markets.
Finally, we add to the existent evidence on the role of rating agencies during financial crises, as we find that Sovereign rating downgrades occur after market downturns supporting that rating agencies have a pro-cyclical behavior and, consequently, may contribute to additional financial instability.
The remainder of this paper is organized as fol-lows. Section 2 describes the data. Section 3 presents the methodology used in our analysis. Section 4 presents the empirical. Section 5 con-cludes.
2. DATA DESCRIPTION
The data set consists of stock and bond spreads of the developed and emerging markets. The emerging markets used in our study are Poland, Czech Republic, Hungary, Bulgaria, Turkey, Russia, Brazil, Argentina, Mexico, Peru, Philip-pines, Venezuela, Chile, Colombia, South Korea, China, Indonesia, Malaysia, Taiwan, Israel and South Africa. The developed markets
are Portugal, Spain, Italy, Greece, France, Bel-gium, The Netherlands, Germany, Austria, Ire-land, FinIre-land, Canada, Denmark, New ZeaIre-land, Sweden, United Kingdom, Australia, Japan, Norway and Switzerland.
Aggregate stock prices of both developed and emerging markets are collected from Datas-tream. Stock market price indexes for each country are measured in U.S. dollars. The U.S. stock index is used as the benchmark over which we calculate the spreads.
Bond market spreads for the developed markets are calculated using the ten-year government bond zero coupon rates, collected from Bloomberg. We use zero coupon rates rather than bond yields as they control for different durations caused by different bond cash-flow structures. We focus on the ten-year yields be-cause their liquidity is usually higher than that of other maturities. We use the U.S. Treasuries as the benchmark, reflecting not only the higher liquidity of the U.S. government bond market, but also the perceived reduced risk of U.S. gov-ernment bonds relative to the bonds of other countries.
We use Sovereign stripped spreads obtained from JP Morgan for the emerging markets. In particular, the yield spread index for each country is given by the Emerging Market Bond Indices (EMBI), the EMBI+ or the EMBI Glo-bal, according to their availability.
bonds. The EMBI+ tracks total returns for U.S. dollar-denominated Brady bonds, loans, Euro-bonds, and U.S. dollar-denominated local mar-kets instruments. Alternatively, EMBI Global tracks total returns for U.S. dollar-denominated Brady Bonds, Eurobonds, traded loans, and local market debt instruments issued by Sove-reign and quasi-SoveSove-reign entities1.
We investigate the own-country impact of
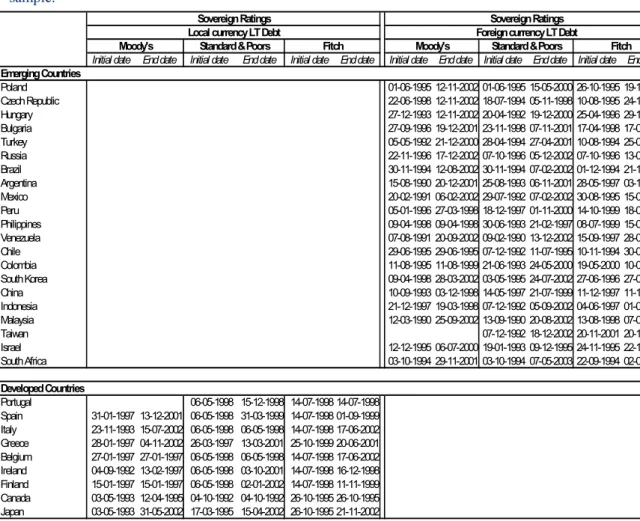
Sovereign rating changes on the stock and bond market return of countries using the population of all rating change announcements for the period January 1, 1990 through June 6, 2003 by three specialized rating agencies, namely, Stan-dard & Poors, Moodys and Fitch. Table 1 dis-plays the series availability for each country and their time coverage. Table 2 reports the time span of rating change events included in the sample for each country and by rating agency2.
1- The EMBI indices have several features that are useful for our analysis. They control for floating coupons, unusual features, and principal collateral and rolling interest guarantees. All instruments included in the indices must have a minimum $500 face value and satisfy a liquidity criteria. Thus, the spreads used in our analysis have similar liquidity. All bonds included in the index have a remaining maturity greater than 2.5 years and average maturity of country indices is comparable.
2- Standard & Poors generated the first set of ratings in 1961 and has been a major force in Sovereign ratings since that time. Moody’s began rating the credit-worthiness of countries in 1974. Fitch entered the market considerably later in 1994. Each agency has a similar coverage of countries and all are relatively active in assessing Sovereign rating.
Table 1- Bond and Stock Market Data Availability
This table displays the availability of stock market index returns and bond yields and spreads for each country and their time coverage.
Stock Index 10 year EMBI Spreads EMBI+ Spreads EMBIG Spreads
(USD) zero coupon
rate
Initial date End date Initial date End date Initial date End date Initial date End date Initial date End date
Emerging Countries
Poland 01-03-1994 31-12-2002 30-11-1994 28-06-2002 31-12-1997 06-06-2003 31-12-1997 06-06-2003
Czech Republic 09-11-1993 31-12-2002
Hungary 21-06-1991 31-12-2002 29-01-1999 06-06-2003
Bulgaria 30-11-1994 28-06-2002 31-12-1997 06-06-2003 31-12-1997 06-06-2003
Turkey 01-01-1990 31-12-2002 31-12-1997 06-06-2003 31-12-1997 06-06-2003
Russia 20-06-1994 31-12-2002 04-01-1999 28-06-2002 31-12-1997 06-06-2003 31-12-1997 06-06-2003
Brazil 04-07-1994 31-12-2002 31-12-1991 28-06-2002 31-12-1997 06-06-2003 31-12-1997 06-06-2003
Argentina 01-01-1990 31-12-2002 30-04-1993 28-06-2002 31-12-1997 06-06-2003 31-12-1997 06-06-2003
Mexico 01-01-1990 31-12-2002 31-12-1991 28-06-2002 31-12-1997 06-06-2003 31-12-1997 06-06-2003
Peru 03-01-1994 31-12-2002 30-05-1997 28-06-2002 31-12-1997 06-06-2003 31-12-1997 06-06-2003
Philippines 01-01-1990 31-12-2002 31-12-1991 30-01-1997 31-12-1997 06-06-2003 31-12-1997 06-06-2003
Venezuela 02-01-1990 31-12-2002 31-12-1991 28-06-2002 04-01-1999 06-06-2003 31-12-1997 06-06-2003
Chile 01-01-1990 31-12-2002 01-06-1999 06-06-2003
Colombia 10-03-1992 31-12-2002 31-12-1997 06-06-2003
South Korea 01-01-1990 31-12-2002 30-04-1998 06-06-2003 31-12-1997 06-06-2003
China 26-07-1993 31-12-2002 31-12-1997 06-06-2003
Indonesia 02-04-1990 31-12-2002
Malaysia 01-01-1990 31-12-2002 31-12-1997 06-06-2003
Taiwan 01-01-1990 31-12-2002
Israel 01-01-1993 31-12-2002
South Africa 01-01-1990 31-12-2002 31-12-1997 06-06-2003
Developed Countries
Portugal 02-01-1990 31-12-2002 11-12-1994 31-12-2002
Spain 01-01-1990 31-12-2002 09-06-1993 31-12-2002
Italy 01-01-1990 31-12-2002 28-04-1997 31-12-2002
Greece 01-01-1990 31-12-2002 10-01-2001 31-12-2002
Belgium 01-01-1990 31-12-2002 11-12-1994 31-12-2002
Ireland 01-01-1990 31-12-2002 27-02-1994 31-12-2002
Finland 01-01-1990 31-12-2002 07-09-1998 31-12-2002
Canada 01-01-1990 31-12-2002 20-06-1997 31-12-2002
Japan 01-01-1990 31-12-2002 16-04-1991 31-12-2002
Benchmark
223 : CADERNOS DO MERCADO DE VALORES MOBILIÁRIOS
Table 2- Rating Changes Data Availability
This table displays the rating series availability for each country and their time coverage. Initial date is the date of the first change included in the sample. End date is the date of the last changes included in the sample.
Sovereign Ratings Sovereign Ratings
Local currency LT Debt Foreign currency LT Debt
Moody's Standard & Poors Fitch Moody's Standard & Poors Fitch
Initial date End date Initial date End date Initial date End date Initial date End date Initial date End date Initial date End date
Emerging Countries
Poland 01-06-1995 12-11-2002 01-06-1995 15-05-2000 26-10-1995 19-11-1998
Czech Republic 22-06-1998 12-11-2002 18-07-1994 05-11-1998 10-08-1995 24-11-1997
Hungary 27-12-1993 12-11-2002 20-04-1992 19-12-2000 25-04-1996 29-11-2000
Bulgaria 27-09-1996 19-12-2001 23-11-1998 07-11-2001 17-04-1998 17-04-1998
Turkey 05-05-1992 21-12-2000 28-04-1994 27-04-2001 10-08-1994 25-03-2003
Russia 22-11-1996 17-12-2002 07-10-1996 05-12-2002 07-10-1996 13-05-2003
Brazil 30-11-1994 12-08-2002 30-11-1994 07-02-2002 01-12-1994 21-10-2002
Argentina 15-08-1990 20-12-2001 25-08-1993 06-11-2001 28-05-1997 03-12-2001
Mexico 20-02-1991 06-02-2002 29-07-1992 07-02-2002 30-08-1995 15-01-2002
Peru 05-01-1996 27-03-1998 18-12-1997 01-11-2000 14-10-1999 18-04-2001
Philippines 09-04-1998 09-04-1998 30-06-1993 21-02-1997 08-07-1999 15-03-2001
Venezuela 07-08-1991 20-09-2002 09-02-1990 13-12-2002 15-09-1997 28-06-2002
Chile 29-06-1995 29-06-1995 07-12-1992 11-07-1995 10-11-1994 30-08-1995
Colombia 11-08-1995 11-08-1999 21-06-1993 24-05-2000 19-05-2000 10-01-2002
South Korea 09-04-1998 28-03-2002 03-05-1995 24-07-2002 27-06-1996 27-06-2002
China 10-09-1993 03-12-1998 14-05-1997 21-07-1999 11-12-1997 11-12-1997
Indonesia 21-12-1997 19-03-1998 07-12-1992 05-09-2002 04-06-1997 01-08-2002
Malaysia 12-03-1990 25-09-2002 13-09-1990 20-08-2002 13-08-1998 07-08-2002
Taiwan 07-12-1992 18-12-2002 20-11-2001 20-11-2001
Israel 12-12-1995 06-07-2000 19-01-1993 09-12-1995 24-11-1995 22-10-2001
South Africa 03-10-1994 29-11-2001 03-10-1994 07-05-2003 22-09-1994 02-05-2003
Developed Countries
Portugal 06-05-1998 15-12-1998 14-07-1998 14-07-1998
Spain 31-01-1997 13-12-2001 06-05-1998 31-03-1999 14-07-1998 01-09-1999 Italy 23-11-1993 15-07-2002 06-05-1998 06-05-1998 14-07-1998 17-06-2002 Greece 28-01-1997 04-11-2002 26-03-1997 13-03-2001 25-10-1999 20-06-2001 Belgium 27-01-1997 27-01-1997 06-05-1998 06-05-1998 14-07-1998 17-06-2002 Ireland 04-09-1992 13-02-1997 06-05-1998 03-10-2001 14-07-1998 16-12-1998 Finland 15-01-1997 15-01-1997 06-05-1998 02-01-2002 14-07-1998 11-11-1999 Canada 03-05-1993 12-04-1995 04-10-1992 04-10-1992 26-10-1995 26-10-1995 Japan 03-05-1993 31-05-2002 17-03-1995 15-04-2002 26-10-1995 21-11-2002
A credit rating represents an assessment of the overall creditworthiness of an obligor in terms of both its capacity and willingness to meet its financial commitments as they fall due. Sove-reign credit risk analysis may be divided into two broad components, specifically economic and political risk. Economic risk deals with the government’s ability to repay its obligations on time and is a function of both qualitative and quantitative factors, while political risk addres-ses the Sovereign’s willingness to repay its outstanding debt on time. Accordingly, rating agencies provide an evaluation of a country’s
Table 4 presents a summary of rating agency activity over the period of analysis. For the emerging countries we use the long-term foreign currency ratings and for the developed countries we use long-term local currency ratings. There are no rating changes for France, The Netherlands, Germany, Austria, Denmark, New Zealand, Sweden, United Kingdom, Aus-tralia, Norway and Switzerland during the sam-ple period, consequently these countries are not included in the analysis.
Our sample only includes rating upgrades (downgrades) that did not have a subsequent upgrade (downgrade) in the 20 days following the initial change. This prevents events that occur shortly after the initial event influencing our results. There are 182 events between January 1, 1990 and June 6, 2003. Table 4 splits the events in developed and emerging countries. As expected, there are much more rating chan-ges in emerging countries (156 events) than in developed countries (26 events). Table 4 also
splits the sample into upgrades and downgra-des. There are more positive events (110) than negative events (76). In particular, in the case of emerging countries there are 94 upgrades and 62 downgrades.
Table 5 analyzes whether a rating change is usually followed by another rating change in a twelve-month period after the initial event. We find that for emerging market downgrades, the-re is a subsequent downgrade less than twelve months after the initial event in 56% of the cases. In the case of emerging markets upgrade, the percentage of subsequent upgrades in a twelve-month period is slightly smaller (49%).
3. METHODOLOGY
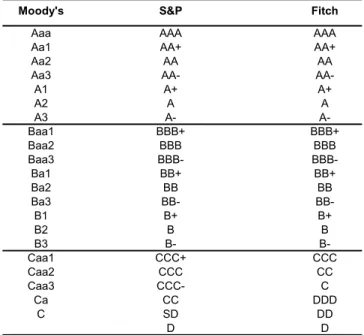
We study the dynamic response of financial markets following a rating change using an event study methodology. Event studies can show whether the actions of rating agencies have sustained or merely transitory effects on financial markets. Event studies can also Table 3- Comparison of Rating Agencies’ Credit Rating Measures
This table summarizes the credit rating measures applied by three leading agencies: Standard & Poors (S&P), Moody's and Fitch.
Moody's S&P Fitch
Aaa AAA AAA
Aa1 AA+ AA+
Aa2 AA AA
Aa3 AA-
AA-A1 A+ A+
A2 A A
A3 A-
A-Baa1 BBB+ BBB+
Baa2 BBB BBB
Baa3 BBB-
BBB-Ba1 BB+ BB+
Ba2 BB BB
Ba3 BB-
BB-B1 B+ B+
B2 B B
B3 B-
B-Caa1 CCC+ CCC
Caa2 CCC CC
Caa3 CCC- C
Ca CC DDD
C SD DD
225 : CADERNOS DO MERCADO DE VALORES MOBILIÁRIOS
provide evidence on whether rating agencies act pro-cyclically, downgrading countries during bad times and upgrading them during good times.
Following Kaminski and Schmukler (2002), we examine the impact of rating changes on stock market spreads (domestic stock markets return relative to a benchmark) and bond market spreads (Sovereign bond yield spreads relative to a benchmark) over different horizons around an upgrade or downgrade of an actual rating. Brooks et al. (2002) study the impact of rating changes in stock market returns using abnormal returns derived from the market model. Later,
we test the robustness of our stock market results also using abnormal returns calculated using the market model.3
Stock market spreads are calculated using U.S. dollar denominated domestic stock returns rela-tive to the U.S. stock market return (benchmark). Daily stock market spreads (abnormal returns) for each event in each country are calculated as follows:
(1) whereRi,tis the geometric U.S. dollar return on stock index of country i on day t and RUS,t is the corresponding geometric return of the U.S. stock market index.
Table 4- Number of Upgrades and Downgrades by Rating Agency and Country
This table displays the number of changes in ratings of long-term sovereign debt. The sample excludes subsequent rating changes that occur on the twenty days after the previous rating change.
Country Total Ratings
Changes Upgrades Downgrades
Poland 6 6 0
Czech Republic 4 2 2
Hungary 10 10 0
Bulgaria 5 5 0
Turkey 10 2 8
Russia 13 7 6
Brazil 10 8 2
Argentina 11 3 8
Mexico 5 5 0
Peru 4 1 3
Philippines 2 2 0
Venezuela 13 2 11
Chile 3 3 0
Colombia 4 1 3
South Korea 14 11 3
China 3 2 1
Indonesia 15 5 10
Malaysia 14 10 4
Taiwan 1 0 1
Israel 4 4 0
South Africa 5 5 0
Sub-total 156 94 62
Portugal 2 2 0
Spain 3 3 0
Italy 2 2 0
Greece 3 3 0
Belgium 2 1 1
Ireland 2 2 0
Finland 3 3 0
Canada 1 0 1
Japan 8 0 8
Sub-total 26 16 10
Total 182 110 72
t US t i t
i R R
AR, , ,
Bond market spreads for developed countries are given by the difference between the 10-year zero coupon bond U.S. dollar rate of return of local government debt of each country relati-vely to the U.S. Treasuries 10-year zero coupon bond rate of return. Daily market bond spreads (abnormal returns) for each event in each deve-loped country are given by:
(2) whereYi,tis the 10-year zero coupon bond yield on market i on day t in local currency, YUS,t is
the corresponding 10-year zero coupon yield on the U.S. government bond market on day t, and Si/US,tis the exchange rate of one unit of country
i currency for U.S. dollars on day t.
For emerging markets we use the EMBI, which are calculated using U.S. Dollar denominated debt and the U.S. Treasuries as benchmark. Daily market bond spreads are then calculated in the following way:
(3)
where Spreadi,t is the difference between country i government debt yields (U.S.
dollar-denominated) and U.S. government debt yields on day t. Notice that given the negative relation
between bond yields and prices, a positive (negative) abnormal return represents a negati-ve (positinegati-ve) rate of return.
Table 5- Number of Subsequent Upgrades and Downgrades in a One-year Horizon
The table displays the number of changes in ratings of long-term sovereign debt that occur less than one year after the previous rating change of the same sign. The sample excludes subsequent rating changes that occur on the twenty days after the previous rating change.
C o u n try R atin g s
U p g rad es D o w n g rad es
P oland 4 0
C zech R epublic 0 1
H ungary 8 0
B ulgaria 4 0
T urk ey 0 3
R us sia 6 5
B razil 3 1
A rgentina 1 6
M ex ic o 3 0
P eru 0 1
P hilippines 0 0
V enezuela 0 5
C hile 1 0
C olom bia 0 1
S outh K orea 8 2
C hina 0 0
Indonesia 1 7
M alays ia 4 3
T aiw an 0 0
Is rael 1 0
S outh A frica 2 0
S u b -to tal 46 35
P ortugal 1 0
S pain 1 0
Italy 1 0
G reece 1 0
B elgium 0 0
Ireland 0 0
F inland 1 0
C anada 0 0
J a p a n 0 6
S u b -to tal 5 6
T o tal 51 41
¸ ¸ ¹ · ¨ ¨ © § ¸ ¸ ¹ · ¨ ¨ © § ¸ ¸ ¹ · ¨ ¨ © § , 1 , 1 , / , / 1 , ,
, ln ln ln
227 : CADERNOS DO MERCADO DE VALORES MOBILIÁRIOS
In order to capture the effect of an upgrade or downgrade on the evolution of spreads around the time of the event and in the long-run we use five different time horizon windows. Each of these windows starts on the tenth day prior to the event and ends, respectively, one-, three-, six-, twelve-, and twenty-four months after the event.
Of course, other factors which also affect the evolution of spreads might take place at the same time. We do not control for those factors and we assume that on average there is no parti-cular bias in the event studies. We expect that those other factors influence spreads both posi-tively and negaposi-tively in a random way.
We use rating changes by the three rating agen-cies (Moody’s, S&P and Fitch) indifferently. To prevent events by the same agency (or by a different agency) that occur shortly before the event we are analyzing) from influencing the cumulative returns in the windows, for our study we take into account only the first upgra-de or downgraupgra-de that occurs within a window of 20 days.
The impact of rating changes is analyzed using cumulative abnormal return (CAR), which
is given by the sum of the daily abnormal returns on each event window, i.e.,
(4) where t1 is the first day of the event window andt2 is the last day of the event window.
We analyze the impact of rating announcements by taking the average of the AR and CAR across
events:
(5)
(6) where is the average abnormal returns of the events on day t, is the average cumulative
abnormal returns of the events on day t, and N
is the number of events.
The statistical significance of the average AR
and CAR is assessed following Boehmer,
Musumeci and Poulsen (1991). The t-statistic is calculated by dividing the average event-period abnormal return by its contemporaneous cross-sectional standard error. This cross cross-sectional estimate of the standard deviation is the valid event when there is an event-induced change in the volatility. The estimated variances are esti-mated as follows:
(7)
(8) where is the variance of the average
abnormal returns of the events on day t and
is the variance of the average cumulative abnormal returns of the events on day t.
The t-statistics for the average AR and CAR are given respectively by:
(9)
(10) which are asymptotically normally distributed with mean zero and variance one.
¦
2 1, 2
1, )
( t t t t i
i t t AR
CAR
¦
N i t i t AR N AR 1 , 1¦
2 1 ) , (1 2 tt t t AR t t CAR t AR t CAR
¦
N i t t it AR AR
N N AR Var 1 2 , ) ( ) 1 ( 1 ) (
¦
2 1 ) ( )) , (( 1 2 t
t t t AR Var t t CAR Var ) (ARt Var
)) , ( (CAR t1 t2
4. EMPIRICAL RESULTS
This section presents both the short- and long-run impact of credit rating changes on the aggregate stock and bond markets in emerging and developed countries. To capture whether these changes persistently affect the investors’ mood, we rely on an event-study methodology. We examine the long-run performance of asset markets around the time of rating changes using several different horizons: one-, three, six-, twelve-, and twenty-four months after the event. If there is more than one event within a 20-day window, we look only at the one that occurred first.
The maximum number of rating changes in the emerging markets (long-term foreign currency denominated debt ratings) examined is 156 (94 upgrades and 62 downgrades) as shown in Table 4. For the developed countries (long-term local currency debt rating changes), the number of rating changes is 26 (16 upgrades and 10 downgrades).
Standard event-study methodology requires linking rating events to abnormal returns. We consider the spreads between the instruments of each country and the benchmark instruments of the reference country (U.S. for both the emer-ging and the developed markets). For stock markets, we use the difference between each country stock market index return (calculated in U.S. dollars) and the U.S. stock market index returns. For emerging bond markets, we use de EMBI index spreads, which are measured rela-tive to the U.S. Treasuries. For the developed bond markets, we use the spread between the rates of return of 10-year zero coupon bonds (calculated in U.S. dollars).
4.1. Short-Run Performance
Tables 6 displays the short-run stock market reaction to Sovereign rating changes using an event window that starts ten days before the event and ends ten days after the event. Table 6 reports both daily abnormal returns and cumu-lative abnormal returns calculated as the diffe-rence between each stock market returns and the U.S. stock market daily returns. Table 7 presents similar results for the bond market reaction to changes in ratings. Panel A shows the emerging markets’ impact while Panel B refers to the impact in developed markets.
Panel A of Table 6 shows that rating downgra-des have a significant short-run wealth effect in the emerging stock markets. Average cumulati-ve abnormal returns show a strong negaticumulati-ve value in the days leading up to the rating chan-ge and also after the rating chanchan-ge. Averachan-ge CARs are significant at the 5% significance level from eight days before the event up to ten days after the event. Specifically, average abnormal returns show significant decreases prior to the rating change on days -10, -8, -7 and -6, suggesting that information on rating downgrades or information on which rating agencies base their rating decisions is public and has an impact in the market a few days before the event happens. On the day just after the rating change (day 1) average ARs is also significant, denoting the presence of some pri-vate information available only to ratings agen-cies that has, as a consequence of the rating change, come into the public domain.
229 : CADERNOS DO MERCADO DE VALORES MOBILIÁRIOS
Table 6
Short-Run Stock Market Reaction to Rating Changes
This table reports average abnormal returns (AR) and cumulative abnormal returns (CAR) as measures of stock market short-run reaction to rating changes. *, ** and *** denote statistical significance at 10%, 5% and 1% level, respectively. N is the number of available events.
Panel A - Emerging Stock Markets
Event Upgrades Downgrades
Day AR t-stat CAR t-stat AR t-stat CAR t-stat
-10 -0.0025 -0.7866 -0.0025 -0.7866 -0.0077 -1.7770 * -0.0077 -1.7770 *
-9 -0.0009 -0.3276 -0.0034 -0.8105 -0.0073 -1.0486 -0.0151 -1.8305 *
-8 -0.0042 -1.5562 -0.0076 -1.5215 -0.0074 -1.7321 * -0.0224 -2.4216 **
-7 0.0002 0.0691 -0.0074 -1.2872 -0.0107 -2.1892 ** -0.0332 -3.1646 ***
-6 -0.0049 -1.7592 * -0.0122 -1.9240 * -0.0122 -2.1087 ** -0.0454 -3.7896 ***
-5 0.0032 0.9681 -0.0091 -1.2710 0.0021 0.3598 -0.0433 -3.2365 ***
-4 -0.0007 -0.2539 -0.0098 -1.2771 -0.0090 -1.5652 -0.0523 -3.5917 ***
-3 0.0029 1.3453 -0.0068 -0.8584 0.0045 0.9040 -0.0478 -3.1056 ***
-2 0.0020 1.0422 -0.0048 -0.5879 -0.0077 -1.1389 -0.0555 -3.3010 ***
-1 0.0008 0.2367 -0.0041 -0.4626 -0.0101 -1.4410 -0.0656 -3.6013 ***
0 -0.0008 -0.3636 -0.0049 -0.5378 -0.0036 -0.6882 -0.0692 -3.6515 ***
1 -0.0018 -0.5696 -0.0066 -0.6928 -0.0170 -3.0088 *** -0.0862 -4.3597 ***
2 -0.0008 -0.4289 -0.0074 -0.7611 -0.0077 -1.3679 -0.0939 -4.5675 ***
3 -0.0040 -1.9109 * -0.0115 -1.1479 0.0090 1.4692 -0.0849 -3.9598 ***
4 0.0020 0.5325 -0.0095 -0.8876 0.0013 0.2301 -0.0836 -3.7737 ***
5 -0.0010 -0.4157 -0.0105 -0.9567 -0.0069 -1.3028 -0.0906 -3.9735 ***
6 -0.0009 -0.3354 -0.0114 -1.0094 0.0057 1.5625 -0.0849 -3.6780 ***
7 -0.0005 -0.2023 -0.0118 -1.0295 -0.0052 -1.1729 -0.0901 -3.8339 ***
8 0.0014 0.6310 -0.0104 -0.8884 -0.0077 -1.3427 -0.0978 -4.0426 ***
9 -0.0002 -0.1224 -0.0106 -0.8968 -0.0084 -1.6129 -0.1062 -4.2917 ***
10 -0.0012 -0.5273 -0.0118 -0.9824 -0.0016 -0.2974 -0.1078 -4.2595 ***
N = 89 N = 62
Panel B - Developed Stock Markets
Event Upgrades Downgrades
Day AR t-stat CAR t-stat AR t-stat CAR t-stat
-10 -0.0041 -1.0793 -0.0041 -1.0793 -0.0015 -0.3232 -0.0015 -0.3232
-9 0.0002 0.0422 -0.0039 -0.6750 0.0098 1.7109 * 0.0083 1.1095
-8 0.0004 0.1154 -0.0035 -0.5089 0.0006 0.1023 0.0088 0.9485
-7 -0.0077 -1.6937 * -0.0112 -1.3654 0.0014 0.2592 0.0102 0.9518
-6 0.0024 1.0482 -0.0088 -1.0267 -0.0008 -0.1700 0.0095 0.8131
-5 0.0039 1.3218 -0.0049 -0.5398 0.0036 1.0246 0.0131 1.0773
-4 0.0047 1.2197 -0.0001 -0.0132 0.0042 1.0495 0.0173 1.3495
-3 0.0057 1.4086 0.0056 0.5247 -0.0071 -1.6506 * 0.0101 0.7497
-2 0.0025 0.7508 0.0081 0.7247 0.0127 3.4572 *** 0.0228 1.6310
-1 0.0022 0.5224 0.0103 0.8629 -0.0019 -0.4424 0.0209 1.4282
0 -0.0052 -1.0057 0.0051 0.3894 0.0068 1.6303 0.0277 1.8196 *
1 -0.0023 -0.5125 0.0027 0.1982 0.0007 0.1246 0.0284 1.7536 *
2 0.0042 0.9243 0.0069 0.4762 -0.0016 -0.5244 0.0268 1.6258
3 -0.0054 -1.6297 0.0015 0.0995 -0.0008 -0.2314 0.0260 1.5486
4 -0.0038 -0.5494 -0.0023 -0.1425 -0.0017 -0.4265 0.0244 1.4121
5 0.0045 0.9649 0.0022 0.1298 -0.0009 -0.1360 0.0235 1.2690
6 -0.0051 -1.3515 -0.0029 -0.1648 -0.0075 -1.5675 0.0160 0.8366
7 -0.0003 -0.0768 -0.0032 -0.1776 0.0021 0.6352 0.0180 0.9308
8 -0.0029 -0.6552 -0.0061 -0.3285 0.0045 1.0747 0.0225 1.1359
9 -0.0026 -1.0067 -0.0087 -0.4671 -0.0045 -1.1919 0.0180 0.8932
10 0.0066 1.3799 -0.0021 -0.1102 -0.0091 -1.7546 * 0.0089 0.4282
Table 7
Short-Run Bond Market Reaction to Rating Changes
This table reports average abnormal returns (AR) and cumulative abnormal returns (CAR) as measures of bond market short-run reaction to rating changes. *, ** and *** denote statistical significance at 10%, 5% and 1% level, respectively. N is the number of available events.
Panel A - Emerging Bond Markets
Event Upgrades Downgrades
Day AR t-stat CAR t-stat AR t-stat CAR t-stat
-10 -0.0001 -0.0310 -0.0001 -0.0310 0.0131 1.0379 0.0131 1.0379
-9 0.0012 0.1999 0.0010 0.1445 0.0097 1.5625 0.0228 1.6219
-8 -0.0029 -0.6296 -0.0019 -0.2214 0.0102 1.4808 0.0330 2.1093 **
-7 -0.0029 -0.6220 -0.0048 -0.4956 -0.0064 -1.0878 0.0266 1.5873
-6 -0.0070 -1.2962 -0.0118 -1.0602 0.0120 1.6933 * 0.0385 2.1215 **
-5 -0.0022 -0.6205 -0.0140 -1.1996 0.0227 2.3183 ** 0.0613 2.9683 ***
-4 -0.0010 -0.2050 -0.0150 -1.1895 0.0221 3.1852 *** 0.0834 3.8278 ***
-3 0.0098 2.4518 ** -0.0052 -0.3905 0.0217 3.3846 *** 0.1050 4.6266 ***
-2 0.0052 0.8029 0.0000 0.0012 0.0007 0.0871 0.1058 4.3619 ***
-1 -0.0056 -1.2654 -0.0056 -0.3621 0.0067 0.7441 0.1125 4.3475 ***
0 -0.0264 -3.0897 *** -0.0320 -1.8171 * 0.0154 1.6396 0.1279 4.6460 ***
1 0.0059 1.0427 -0.0261 -1.4100 0.0046 0.4644 0.1325 4.5279 ***
2 -0.0018 -0.3789 -0.0279 -1.4600 0.0114 1.5337 0.1439 4.7663 ***
3 0.0051 1.0008 -0.0228 -1.1543 0.0085 1.2596 0.1524 4.9264 ***
4 -0.0119 -2.4365 ** -0.0347 -1.7063 * 0.0043 0.4574 0.1567 4.8492 ***
5 0.0005 0.1227 -0.0343 -1.6515 * -0.0095 -1.1497 0.1472 4.4146 ***
6 -0.0040 -0.6215 -0.0382 -1.7611 * 0.0027 0.4646 0.1499 4.4294 ***
7 0.0068 0.5872 -0.0314 -1.2750 -0.0001 -0.0120 0.1498 4.2912 ***
8 -0.0015 -0.3047 -0.0329 -1.3099 0.0091 1.0435 0.1589 4.4162 ***
9 -0.0082 -1.0108 -0.0410 -1.5571 0.0062 0.7282 0.1651 4.4651 ***
10 0.0115 1.3242 -0.0296 -1.0662 -0.0047 -0.6834 0.1604 4.2628 ***
N = 66 N = 41
Panel B - Developed Bond Markets
Event Upgrades Downgrades
Day AR t-stat CAR t-stat AR t-stat CAR t-stat
-10 -0.0025 -0.5140 -0.0025 -0.5140 0.0075 1.0333 0.0075 1.0333
-9 -0.0045 -1.6366 -0.0070 -1.2596 0.0318 3.8518 *** 0.0393 3.5796 ***
-8 -0.0018 -0.7729 -0.0088 -1.4607 -0.0228 -5.1881 *** 0.0165 1.3965
-7 0.0039 0.7801 -0.0049 -0.6266 -0.0351 -5.3312 *** -0.0186 -1.3774
-6 0.0007 0.2461 -0.0042 -0.5072 0.0265 3.0333 *** 0.0079 0.4881
-5 -0.0031 -1.2887 -0.0074 -0.8490 -0.0163 -2.1272 ** -0.0084 -0.4732
-4 0.0046 1.1444 -0.0028 -0.2874 0.0291 2.8045 *** 0.0207 1.0037
-3 -0.0005 -0.1237 -0.0033 -0.3128 -0.0248 -2.6853 *** -0.0041 -0.1829
-2 -0.0034 -1.3946 -0.0066 -0.6209 -0.0024 -0.3905 -0.0065 -0.2772
-1 -0.0013 -0.4074 -0.0079 -0.7107 0.0010 0.1531 -0.0055 -0.2254
0 -0.0081 -2.0950 ** -0.0160 -1.3586 0.0267 3.0704 *** 0.0212 0.8214
1 -0.0003 -0.0704 -0.0163 -1.3176 -0.0130 -2.5985 ** 0.0083 0.3139
2 0.0073 2.5461 ** -0.0090 -0.7076 -0.0036 -0.6514 0.0047 0.1743
3 -0.0033 -1.2154 -0.0122 -0.9441 0.0376 3.4065 *** 0.0423 1.4565
4 -0.0019 -0.6781 -0.0141 -1.0660 -0.0005 -0.1015 0.0418 1.4224
5 0.0009 0.2280 -0.0132 -0.9499 0.0028 0.3494 0.0446 1.4642
6 0.0024 0.7463 -0.0108 -0.7588 0.0207 3.3583 *** 0.0654 2.1020 **
7 -0.0009 -0.2480 -0.0117 -0.7960 0.0375 3.7748 *** 0.1028 3.1501 ***
8 -0.0017 -0.4110 -0.0134 -0.8787 0.0149 3.1318 *** 0.1177 3.5689 ***
9 0.0013 0.5080 -0.0121 -0.7837 0.0143 1.7261 * 0.1320 3.8818 ***
10 0.0031 0.8886 -0.0090 -0.5690 0.0214 2.6538 *** 0.1534 4.3886 ***
231 : CADERNOS DO MERCADO DE VALORES MOBILIÁRIOS
spreads relative to the U.S. stock market index are not statistically significantly around the announcement date. Panel B of Table 6 shows that for developed countries, average abnormal returns are not statistically significant following both rating upgrades and downgrades.
Table 7 reports similar findings in aggregate bond markets. Downgrades have a significant negative return effect (recall that the table reports a positive impact in yields) in emerging markets’ bond average CARs, from six days before the event up to ten days after the event. Significant increases in average ARs from day –6 to –3 can be observed. Panel B shows that rating downgrades also have some negative impact in developed markets, with significant average ARs on some days before and after the event. Average CARs are significant at the 5% significance level on day –9 and after the event, from day 6 to 10.
Conversely, there is weak evidence that rating upgrades have an impact on either emerging or developed bond markets, even though there are significant ARs in the emerging markets in the day of the upgrade, as well as on day 4 after the event. In developed markets ARs are only sig-nificant on day of the event announcement and on day 2 after the event. CARs are not signifi-cant at the conventional significance level in either emerging or developed markets following rating upgrades.
Overall, we find that rating downgrades have a significant negative impact on the performance of the country’s stock and bond markets relative to the U.S. market, especially in emerging countries. The impact on developed markets is smaller and significant only in the government bond markets. While the negative effect of
sovereign rating downgrade in the bond market does spill over to other assets markets in emer-ging countries, this does not seem to be the case in developed markets.
This is the first study of the impact of sovereign ratings that finds a significant difference bet-ween the effect of rating changes in emerging and developed markets. Brooks et al. (2002) find no significant difference between the effect of rating changes in emerging and developed countries. The conflicting results can be explai-ned by a different sample period and methodo-logy. We study rating changes focusing on the 1990’s, while Brooks et al. (2002) consider rating changes starting in 1973. The earlier sample period is characterized by a smaller level of financial integration among developed countries and also by a smaller number of deve-loped countries. Also, some emerging countries had their status raised to developed during the 1990’s (e.g. Portugal and Greece). In addition, we directly address this issue by dividing the sample (rating changes) by the country level of development, while Brooks et al. (2002) test for a different impact using a dummy variable for emerging countries in a cross-sectional regres-sion.
4.2. Long-Run Performance
Table 8
Long-Run Stock Market Reaction to Rating Changes
This table reports cumulative abnormal returns (CAR) as measures of stock market long-run reaction to rating changes. *, ** and *** denote statistical significance at 10%, 5% and 1% level, respectively. N is the number of available events.
Panel A - Emerging Stock Markets
1 month 3 months 6 months 12 months 24 months
Sovereign upgrades
CAR -0.0028 -0.0057 -0.0264 -0.0819 -0.3823
t-statistic -0.1677 -0.2296 -0.7791 -1.7336 * -5.0397 ***
N = 89 87 85 81 61
Sovereign downgrades
CAR -0.1311 -0.2288 -0.2861 -0.1356 -0.2132
t-statistic -3.5683 *** -4.1537 *** -4.1714 *** -1.5089 -1.6221
N = 62 61 60 53 42
Panel B - Developed Stock Markets
1 month 3 months 6 months 12 months 24 months
Sovereign upgrades
CAR 0.0175 -0.0349 -0.0181 -0.1041 -0.1772
t-statistic 0.5871 -0.7034 -0.2512 -0.8612 -1.0177
N = 13 13 13 10 7
Sovereign downgrades
CAR 0.0266 -0.0262 -0.0351 -0.1476 -0.1177
t-statistic 0.7650 -0.4435 -0.4309 -1.2116 -0.6134
233 : CADERNOS DO MERCADO DE VALORES MOBILIÁRIOS
Table 9
Long-Run Bond Market Reaction to Rating Changes
This table reports cumulative abnormal returns (CAR) as measures of bond market long-run reaction to rating changes. *, ** and *** denote statistical significance at 10%, 5% and 1% level, respectively. N is the number of available events.
Panel A - Emerging Bond Markets
1 month 3 months 6 months 12 months 24 months
Sovereign upgrades
CR -0.0381 -0.1305 -0.1021 -0.1594 -0.3053
t-statistic -1.0503 -2.3903 ** -1.4999 -1.3334 -1.1843
N = 66 65 58 54 30
Sovereign downgrades
CR 0.2482 0.3424 0.3968 0.0366 -0.4150
t-statistic 4.6470 *** 4.4367 *** 3.8196 *** 0.3014 -2.1720 **
N = 41 40 35 31 21
Panel B - Developed Bond Markets
1 month 3 months 6 months 12 months 24 months
Sovereign upgrades
CAR -0.0242 -0.0067 0.0402 0.1374 0.2869
t-statistic -1.1099 -0.1885 0.7864 1.7145 * 2.3247 **
N = 16 15 12 9 7
Sovereign downgrades
CAR 0.0332 0.0298 -0.0205 0.1343 0.3711
t-statistic 0.6668 0.3345 -0.1552 0.7073 1.2372
the U.S. stock market index. Table 9 reports similar information for the government bond market. The bond market abnormal return is given by the difference between the rate of return of 10-year zero coupon bonds between the developed country and the U.S., or in the case of emerging countries, by the rate of return calculated from the EMBI spread relative to the U.S. Treasuries. Panel A refers to the impact in emerging markets while Panel B refers to the impact in developed markets.
Panel A of Table 8 shows evidence that rating upgrades have no significant impact on emer-ging stock markets, while downgrades have a significant negative impact at the 1% level for the one-, three- and six-month windows. The impact for horizons longer than six-month is still considerably negative, but not significant at the 5% level. In contrast, the long-run results in Panel B of Table 8 supports the short-run fin-ding that there is no significant impact in deve-loped stock markets following rating downgra-des and upgradowngra-des.
Table 9 presents the government bond market long-run reaction to rating changes. Panel A of Table 9 shows a significant negative return res-ponse at the 1% significance level (recall that the table reports a positive yield impact) of emerging bond markets following a rating downgrade until six months after the event. This result is consistent with the negative short-run impact found in emerging bond markets. Rating upgrades have a positive return impact in emerging bond markets. However, the impact is generally not statistically significant, with the exception of the three-month window. This is again consistent with the short-run impact in emerging bond markets.
The results in Panel B of Table 9 for developed countries show that bond markets are not signi-ficantly affected either by rating downgrades or upgrades. Recall that rating downgrades present a negative impact in developed government bond markets using a ten-day window around the rating change announcement.
In summary, our results show that upgrades do not have a significant wealth impact either in emerging and developed countries financial markets. In contrast, sovereign debt downgra-des have a negative short-run return performan-ce in the sovereign bond markets of developed countries and, especially, emerging countries. While this negative performance spills over to stock markets in emerging countries, the negati-ve performance is only significant in bond mar-kets in the case of developed countries. Further-more, the short-run performance persists up to six months after the event in both the bond and stock markets of emerging countries.
235 : CADERNOS DO MERCADO DE VALORES MOBILIÁRIOS
Figure 1
Emerging Stock Markets Reaction
Figures plot the dynamics of stock market spreads in emerging markets when foreign currency sovereign debt ratings change.
Panel A.1 - Upgrade 6-month Panel A.2 - Downgrade 6-month
-0.04 -0.03 -0.02 -0.01 0 0.01 0.02
-10 0 10 20 30 40 50 60 70 80 90 100 110 120 130 140 150 160 170 180 -0.35
-0.3 -0.25 -0.2 -0.15 -0.1 -0.05 0
-10 0 10 20 30 40 50 60 70 80 90 100 110 120 130 140 150 160 170 180
Panel B.1 - Upgrade 24-month Panel B.2 - Downgrade 24-month
-0.45 -0.4 -0.35 -0.3 -0.25 -0.2 -0.15 -0.1 -0.05 0 0.05
-10 30 70 110 150 190 230 270 310 350 390 430 470 510 550 590 630 670 710 -0.4 -0.35 -0.3 -0.25 -0.2 -0.15 -0.1 -0.05 0
-10 30 70 110 150 190 230 270 310 350 390 430 470 510 550 590 630 670 710
Figure 2
Developed Stock Markets Reaction
Figures plot the dynamics of stock market spreads in developed markets when local currency sovereign debt ratings change.
Panel A.1 - Upgrade 6-month Panel A.2 - Downgrade 6-month
-0.04 -0.03 -0.02 -0.01 0 0.01 0.02 0.03
-10 0 10 20 30 40 50 60 70 80 90 100 110 120 130 140 150 160 170 180 -0.07 -0.06 -0.05 -0.04 -0.03 -0.02 -0.01 0 0.01 0.02 0.03
-10 0 10 20 30 40 50 60 70 80 90 100 110 120 130 140 150 160 170 180
Panel B.1 - Upgrade 24-month Panel B.2 - Downgrade 24-month
-0.3 -0.25 -0.2 -0.15 -0.1 -0.05 0 0.05
-10 30 70 110 150 190 230 270 310 350 390 430 470 510 550 590 630 670 710 -0.18 -0.16 -0.14 -0.12 -0.1 -0.08 -0.06 -0.04 -0.02 0 0.02 0.04
Figure 3
Emerging Bond Markets Reaction
Figures plot the dynamics of bond market spreads in emerging markets when foreign currency sovereign debt ratings change.
Panel A.1 - Upgrade 6-month Panel A.2 - Downgrade 6-month
-0.14 -0.12 -0.1 -0.08 -0.06 -0.04 -0.02 0 0.02
-10 0 10 20 30 40 50 60 70 80 90 100 110 120 130 140 150 160 170 180 0 0.05 0.1 0.15 0.2 0.25 0.3 0.35 0.4 0.45
-10 0 10 20 30 40 50 60 70 80 90 100 110 120 130 140 150 160 170 180
Panel B.1 - Upgrade 24-month Panel B.2 - Downgrade 24-month
-0.35 -0.3 -0.25 -0.2 -0.15 -0.1 -0.05 0 0.05
-10 30 70 110 150 190 230 270 310 350 390 430 470 510 550 590 630 670 710 -0.5 -0.4 -0.3 -0.2 -0.1 0 0.1 0.2 0.3 0.4 0.5
-10 30 70 110 150 190 230 270 310 350 390 430 470 510 550 590 630 670 710
Figure 4
Developed Bond Markets’ Reaction
Figures plot the dynamics of bond market spreads in developed markets when local currency sovereign debt ratings change.
Panel A.1 - Upgrade 6-month Panel A.2 - Downgrade 6-month
-0.04 -0.03 -0.02 -0.01 0 0.01 0.02 0.03 0.04 0.05 0.06
-10 0 10 20 30 40 50 60 70 80 90 100 110 120 130 140 150 160 170 180 -0.05
0 0.05 0.1 0.15 0.2 0.25 0.3 0.35 0.4 0.45
-10 0 10 20 30 40 50 60 70 80 90 100 110 120 130 140 150 160 170 180
Panel B.1 - Upgrade 24-month Panel B.2 - Downgrade 24-month
-0.1 -0.05 0 0.05 0.1 0.15 0.2 0.25 0.3 0.35
-10 30 70 110 150 190 230 270 310 350 390 430 470 510 550 590 630 670 710 -0.1
0 0.1 0.2 0.3 0.4 0.5
237 : CADERNOS DO MERCADO DE VALORES MOBILIÁRIOS
From the evolution of emerging stock and bond markets following rating downgrades, we con-clude that rating agencies behave pro-cyclically. Rating agencies decide to downgra-de when a country’s financial markets are already having a negative performance (during the ten days prior to the rating announcement). We interpret this result as evidence of pro-cyclical behaviour of rating agencies. Alternati-vely, the behavior of prices in the days prece-ding rating changes could also reflect an antici-pation effect. Market participants anticipate the rating downgrades, and consequently markets incorporate this information in the prices even before the rating announcement.
After the rating downgrade announcement, the negative market reaction persists for six months, both in stock and bond emerging mar-kets. This negative performance persists after twelve and twenty four months following the downgrade in the case of the bond and stock market in emerging countries.
This evidence supports the hypothesis that rating agencies contribute to amplifying the boom-bust pattern in emerging markets, and that downgrades tend to occur when emerging market are already collapsing.
4.3. Robustness Checks
To examine the robustness of our results for the impact of rating changes in emerging stock market performance, we replicate the event study using an alternative model to calculate the abnormal returns. The most common approach in individual stocks event studies is to use the market model; see, for example, Brown and Warner (1980). Daily risk adjusted abnormal stock market returns are calculated using the market model:
(11) where Rit is the return on the stock market of country i on day t, Rmt is the corresponding
return on the U.S. stock market index on day t,
and aiand bi are the market model parameters. Notice that our stock market spreads (difference between country’s and US stock market returns) are given by a special case of the mar-ket model with ai= 0 andbi= 1.
The market model parameters are estimated using weekly stock market returns from the country’s with rating change and from the benchmark (U.S.) in the six months prior to the event announcement (beginning 130 days prior to the event and ending 11 days before the event announcement). We use weekly returns (as opposed to daily) to avoid the non-synchronous estimation bias that arises from different trading hours across countries.
Table 10 reports the short-run performance of emerging stock markets following rating chan-ges using risk adjusted abnormal returns. The results show that our main findings are not changed by the use of risk adjusted abnormal returns. Rating downgrades in the emerging markets are associated with statistically signifi-cant negative CARs at the 5% level from day -6 until day 10, while rating upgrades do not have any short term impact on stock markets returns.
We also replicate our long-run impact results in emerging stock markets using abnormal returns derived from the market model. Table 11 shows the results that are consistent with our main results using stock market spreads. There is a statistically significant response at the 1% level on emerging stock markets until six-month after a rating downgrade. While downgrades have a negative and persistent effect in emerging stock markets, upgrades do not have a significant effect.
) (
,
,t it i i mt
i R R
Table 10
Short-Run Emerging Stock Market Reaction to Rating Changes: Market Model
This table reports average abnormal returns (AR) and cumulative abnormal returns (CAR) as measures of the emerging stock market short-run reaction to rating changes. Abnormal returns are derived from the market model. *, ** and *** denote statistical significance at 10%, 5% and 1% level, respectively. N is the number of available events.
Event Upgrades Downgrades
Day AR t-stat CAR t-stat AR t-stat CAR t-stat
-10 -0.0029 -0.8633 -0.0029 -0.8633 -0.0108 -0.9340 -0.0108 -0.9340
-9 -0.0017 -0.6616 -0.0046 -1.0876 -0.0094 -0.7847 -0.0202 -1.2135
-8 -0.0040 -1.4469 -0.0086 -1.7021 * -0.0112 -0.8947 -0.0315 -1.5076
-7 -0.0002 -0.0522 -0.0087 -1.4992 -0.0139 -1.1190 -0.0454 -1.8679 *
-6 -0.0049 -1.7267 * -0.0136 -2.1014 ** -0.0148 -1.1379 -0.0602 -2.1839 **
-5 0.0037 0.9360 -0.0099 -1.3007 -0.0040 -0.3017 -0.0642 -2.0996 **
-4 -0.0002 -0.0742 -0.0101 -1.2200 -0.0114 -0.9092 -0.0756 -2.2875 **
-3 0.0012 0.5142 -0.0090 -1.0407 -0.0002 -0.0171 -0.0758 -2.1264 **
-2 0.0019 0.7942 -0.0070 -0.7828 -0.0112 -0.8432 -0.0870 -2.2869 **
-1 0.0007 0.1992 -0.0063 -0.6555 -0.0130 -0.9334 -0.0999 -2.4684 **
0 -0.0029 -1.3498 -0.0092 -0.9374 -0.0077 -0.6396 -0.1076 -2.5484 **
1 -0.0025 -0.7728 -0.0117 -1.1302 -0.0203 -1.5351 -0.1279 -2.8911 ***
2 0.0030 1.2259 -0.0087 -0.8152 -0.0131 -1.0467 -0.1410 -3.0668 ***
3 -0.0037 -1.4174 -0.0124 -1.1287 0.0058 0.4351 -0.1352 -2.8263 ***
4 0.0014 0.3160 -0.0110 -0.9294 -0.0011 -0.0787 -0.1363 -2.7408 ***
5 -0.0020 -0.6392 -0.0130 -1.0627 -0.0080 -0.6203 -0.1443 -2.8086 ***
6 0.0001 0.0166 -0.0129 -1.0275 0.0006 0.0494 -0.1437 -2.7124 ***
7 -0.0019 -0.7785 -0.0149 -1.1578 -0.0050 -0.4012 -0.1487 -2.7320 ***
8 -0.0004 -0.1580 -0.0153 -1.1648 -0.0119 -0.8983 -0.1607 -2.8671 ***
9 -0.0010 -0.4772 -0.0163 -1.2235 -0.0124 -0.9776 -0.1731 -3.0122 ***
10 0.0001 0.0456 -0.0162 -1.1970 -0.0083 -0.6924 -0.1814 -3.0901 ***
N = 85 N = 61
Table 11
Long-Run Emerging Stock Market Reaction to Rating Changes: Market Model
This table reports cumulative abnormal returns (CAR) as measures of the emerging stock market long-run reaction to rating changes. Abnormal returns are derived from the market model. *, ** and *** denote statis-tical significance at 10%, 5% and 1% level. N is the number of available events.
1 month 3 months 6 months 12 months 24 months
Sovereign upgrades
CAR -0.0044 -0.0023 0.0140 0.0730 0.4051
t-statistic -0.2305 -0.0819 0.3488 1.2541 * 4.1653 ***
N = 85 83 81 77 57
Sovereign downgrades
CAR -0.2690 -0.5727 -1.0520 -0.0453 -1.2472
t-statistic -3.2692 *** -4.4117 *** -5.9051 *** -0.1796 -2.8285 ***
239 : CADERNOS DO MERCADO DE VALORES MOBILIÁRIOS
Figure 5 shows stock markets’ response to foreign currency debt ratings change, using
cumulative abnormal derived from the market model, for the emerging countries.
Figure 5
Emerging Stock Markets Reaction: Market Model
Figures plot the dynamics of stock market spreads in emerging markets when foreign currency sovereign debt ratings change. Abnormal returns are derived from the market model.
Panel A.1 - Upgrade 6-month Panel A.2 - Downgrade 6-month
-0.02 -0.01 0 0.01 0.02 0.03 0.04 0.05
-10 0 10 20 30 40 50 60 70 80 90 100 110 120 130 140 150 160 170 180 -1.2
-1 -0.8 -0.6 -0.4 -0.2 0
-10 0 10 20 30 40 50 60 70 80 90 100 110 120 130 140 150 160 170 180
Panel B.1 - Upgrade 24-month Panel B.2 - Downgrade 24-month
-0.05 0 0.05 0.1 0.15 0.2 0.25 0.3 0.35 0.4 0.45 0.5
-10 30 70 110 150 190 230 270 310 350 390 430 470 510 550 590 630 670 710 -1.4 -1.2 -1 -0.8 -0.6 -0.4 -0.2 0
-10 30 70 110 150 190 230 270 310 350 390 430 470 510 550 590 630 670 710
5. CONCLUSION
Financial integration has made investors, and particularly fund managers, increasingly inte-rested in international diversification. The for-mation of international portfolios requires a range of fundamental inputs in the asset alloca-tion decision. In particular, a change in Sove-reign ratings is one such key event that may trigger substantial recomposition of internatio-nal portfolios.
This paper contributes to the literature on the effects of credit ratings on financial markets by examining the impact of Sovereign rating chan-ges on the country’s bond and stock markets.
This is the first study to examine not only the short-run impact of rating changes, but also to analyze the long-run impact in both developed and emerging financial markets.
developed markets only the government bond market is affected. Moreover, we find that the effects of rating downgrades in both stock and bond emerging markets persist up to six months after the event. In fact, the effect in the develo-ped countries is felt only in the bond markets and in the days around a downgrade.
241 : CADERNOS DO MERCADO DE VALORES MOBILIÁRIOS
REFERENCES
Boehmer, E., J. Musumeci and A. Poulsnm, 1991, Even-study methodology under conditions of event-induced variance, Journal of Financial Economics 30, 253-272.
Brooks, R., R. Faff, D. Hillier and J. Hillier, 2002, The national market impact of sovereign rating changes,Journal of Banking and Finance, forthcoming.
Brown, S. and J. Warner, 1980, Measuring security price performance, Journal of Financial Economics 8, 205-258.
Cantor, R. and F. Packer, 1996, Determinants and Impact of Sovereign Credit Ratings, Economic Policy Review, 37-53.
Dichev, I. and J. Piotroski, 2001, The long-run stock returns following bond rating changes, Journal of Finance 56, 173-203.
Gande, A. and D. Parsley, 2002, News Spillovers in the Sovereign Debt Market, Journal of Financial Economics, forthcoming.
Kaminsky, G. and S. Schmukler, 2002, Emerging Markets Instability: Do Sovereign Ratings Affect Country Risk and Stock Returns?, World Bank Economic Review 16, 171-195
Kräussl, R., 2003, Do Changes in Sovereign Credit Ratings Contribute to Financial Contagion in
Emerging Market Crises?, Working Paper, Center for Financial Studies, Johann Wolfgang Goethe-Universität.