Est. Econ., São Paulo, vol. 42, n.3, p. 433-456, jul.-set. 2012
ISSN 0101-4161
A Panel Data Investigation of Real Exchange Rate Misalignment
and Growth
♦Flávio Vilela Vieira Professor - Instituto de Economia da Universidade Federal de Uberlândia (UFU) e Pesquisador do CNPq - Endereço para contato: Av. João Naves de Ávila, 2121 - Campus Santa Mônica, Bloco J - Uberlândia - MG - CEP: 38400-902 - E-mail: [email protected]
Ronald MacDonald Adam Smith Chair of Political Economy - Department of Economics - University of Glasgow Adam Smith Building - University of Glasgow, G12 8RT - Glasgow - UK
Email: [email protected]
Recebido em 11 de julho de 2011. Aceito em 06 de junho de 2012.
Abstract
The paper investigates the role of real exchange rate misalignment on long-run growth for a set of ninety countries using time series data from 1980 to 2004. We first estimate a panel data model (fixed and random effects) for the real exchange rate in order to pro-duce estimates of the equilibrium real exchange rate and this is then used to construct measures of real exchange rate misalignment. We provide an alternative set of estimates of RER misalignment using panel cointegration methods. The results for the two-step System GMM panel growth models indicate that the coefficients for real exchange rate misalignment are positive for different model specification and samples, which means that a more depreciated (appreciated) real exchange rate helps (harms) long-run growth. The estimated coefficients are higher for developing and emerging countries.
Keywords
economic growth, real exchange rate misalignment, panel data analysis
JEL Classiication
F31, O47, C33
Resumo
O trabalho investiga o papel do desalinhamento da taxa de câmbio real no crescimento de longo prazo para um conjunto de noventa países para o período de 1980 a 2004. Primeiramente estima-se um modelo de dados em painel (efeitos fixos e aleatórios) para a taxa de câmbio real, no intuito de se obter estimações da taxa de câmbio real de equilíbrio que são utilizadas para construir as medidas de desalinhamento da taxa de câmbio real. O trabalho utiliza também estimações adicionais do desalinhamento da
taxa de câmbio real com base em análise de cointegração em painel. Os resultados dos modelos de crescimento em painel (two-step System GMM) indicam que os coeficientes do desalinhamento da taxa de câmbio real são positivos para diferentes especificações e amostras, indicando que uma taxa de câmbio real mais depreciada (apreciada) estimula (prejudica) o crescimento de longo prazo. Os coeficientes estimados são maiores para os países emergentes e em desenvolvimento.
Palavras-Chave
crescimento econômico, desalinhamento da taxa de câmbio real, análise de painel
1. Introduction
The real exchange rate does not normally feature in economic growth models, particularly those founded in the neoclassical tra-dition. Its role has, however, been highlighted by the literature on export-led growth since one of the policy recommendations in this literature is that it is crucially important that the price of export goods and services is at a level that makes it attractive to shift re-sources into their production. Other studies in the real exchange rate and growth literature are devoted to examining the effect of real exchange volatility on trade and investment and ultimately on growth. High real exchange rate volatility is also part of the inves-tigation on the occurrence of currency crises episodes and how this can have a negative impact on growth.
A Panel Data Investigation of Real Exchange Rate Misalignment and Growth 435
Est. Econ., São Paulo, vol. 42, n.3, p. 433-456, jul.-set. 2012
This paper empirically investigates the relationship between real exchange rate misalignment and long-run economic growth for a set of almost one hundred countries using panel data techniques, including fixed and random effects, panel cointegration and system GMM. One of the main empirical contributions of the paper is to test different model specifications for the long-run equilibrium real exchange rate and then use these to obtain estimated real exchange rate misalignments and assess how robust the results are when they are included as an explanatory variable in the panel growth model. We have also estimated the growth models using System GMM and correct for the case of too many instruments which is an important econometric issue and has not to our knowledge been considered in this literature before.
The empirical results indicate that the coefficients for different me-asures of real exchange rate misalignment are positive for all estima-ted models and statistically significant for most model specifications and different samples, meaning that a more depreciated real exchan-ge rate enhances long-run growth. The estimated coefficients for real exchange rate misalignment are higher for developing countries in most models, suggesting that the benefits for such countries are greater in terms of fostering long-run growth. The paper is divided in four sections, including the introduction and concluding remarks. Section two develops a literature review on real exchange rate mi-salignment and growth. Section three is dedicated to the empirical results including the estimation of the real exchange rate misalign-ments and the panel growth models for the complete sample and for a set of developing and emerging economies.
2. Real Exchange Rate Misalignment and Growth: A Literature Review
The literature on real exchange rate equilibrium goes back to the 1960s (Balassa, 1964) and the second half of the first decade of the new century has shown an increase in the number of empirical studies on real exchange rate misalignment and growth.1 The notion
1 See Rodrik (2008), Eichengreen (2008), Berg and Miao (2010), Gala and Lucinda (2006),
of real exchange rate equilibrium is normally associated with the combination of external (current account sustainability) and internal (intertemporal equilibrium in the goods market) balance. The litera-ture on exchange rate misalignment has not reached a consensus in terms of how misalignment is measured, since part of the literature is based on deviations from PPP while other studies focus on the deviation of the real exchange rate from some equilibrium level.2 Another issue that is frequently examined in the literature on real exchange rate misalignment is the notion that overvaluation proces-ses that last for a significant period of time are good indicators of possible currency crises (Frankel and Rose, 1996) and ultimately have an impact on relative price adjustment and create a negative correlation with growth.
One of the early studies on exchange rate misalignment and growth is Razin and Collins (1997) who argue that the policy of keeping the real exchange rate depreciated is generally associated with com-petitive devaluation policies to stimulate a country’s export sector. Edwards (1989) investigates the relationship between real exchange rates and growth and one of the main findings is that inadequate (misaligned) real exchange rates are associated with relative price distortions in the tradable and non-tradable goods sectors and the outcome is a non-optimum allocation of resources among different sectors of the economy, which has a negative impact on growth.3
Rodrik (2008) is one of the recent studies on real exchange rate mi-salignment and growth, with estimation results for a set of 184 coun-tries and time series data from 1950 to 2004. The author develops an index to measure the degree of real exchange rate undervaluation adjusted for the Balassa-Samuelson effect using real per capita GDP (RGDPCH - Penn World Table) data. The main empirical result is that growth is higher in countries with more undervalued real ex-change rates and the effect is linear and similar for both under and overvaluation, implying that an overvalued real exchange rate hurts
2
See Edwards and Savastano (1999) for a review of the literature on exchange rate misalignment. 3 See Clark and MacDonald (1988) for a description of the BEER (Behavioral Equilibrium
A Panel Data Investigation of Real Exchange Rate Misalignment and Growth 437
Est. Econ., São Paulo, vol. 42, n.3, p. 433-456, jul.-set. 2012
growth while an undervalued rate fosters growth. The magnitude and statistical significance of the estimated coefficient for real ex-change rate undervaluation is higher for developing countries due to the fact that such countries are often characterized by institutional fragility and market failures.4
Berg and Miao (2010) develop an empirical investigation on real ex-change rate misalignment and growth in order to compare the results with Rodrik (2008) and what they call the Washington Consensus (WC) view, which is based on a fundamental equilibrium exchange rate model (FEER).5 Their main result suggests that both views are observationally equivalent for the main growth regressions but there are some identification problems since the determinants of real ex-change rate misalignments are also likely to be explanatory variables in the growth regression. The empirical findings support those from Rodrik (2008) in the sense that undervaluation helps foster long-run growth and overvaluation has the opposite effect, a result that it is not consistent with the WC view. The authors argue that once they disentangle the direct and the indirect effects of the factors that drive growth the evidence is in favor of the WC view.
Eichengreen (2008) develops a historical review of the literature on real exchange rate and growth, focusing attention on possible chan-nels through which the real exchange rate might have an impact on long-run economic growth. The author argues in favor of a more de-preciated real exchange rate as long as this is not associated with hi-gher exchange rate volatility. The combination of a depreciated real exchange rate and low volatility is regarded as a favorable combina-tion for developing and emerging economies, where a more dynamic export sector is usually an important part of the process for achie-ving higher and sustained economic growth rates.6 The main policy
4 Rodrik (2008) incorporates other variables in the growth models (panel and cross-section
regressions), including: lagged growth, initial income level (convergence), institutions (Rule of Law), government consumption, terms of trade, inflation, gross domestic saving, years of education, time and country dummies.
5
The first measure of real exchange rate misalignment( PPP it
) is the same as in Rodrik (2008),
using RGDPCH to capture the Balassa-Samuelson effect, while the second measure ( FEER it
)
is based on the FEER view and incorporates additional variables (terms of trade, openness, investment and government consumption).
recommendation therefore is for such countries is to keep their real exchange rate at a competitive level and with lower volatility since they are relevant for jump-starting growth based on development experiences, such as the high growth East Asian economies.
The work developed by Aguirre and Calderón (2006) is among those using a measure of exchange rate misalignment based on the re-siduals from a FEER regression and they use dynamic panel and cointegration analysis for a set sixty countries with data from 1965 to 2003. The empirical evidence suggests that the effect of RER misalignment on growth is non-linear, which means that when real exchange rate depreciation is too high the impact on growth is nega-tive but when it is small or moderate it can be growth enhancing.7
Gala and Lucinda (2006) developed a dynamic panel data analy-sis using Difference and System GMM techniques, for a set of 58 countries from 1960 to 1999, with a measure of real exchange rate misalignment incorporating the Balassa-Samuelson effect and other control variables for the growth regression such as physical and hu-man capital, institutional environment, inflation, the output gap and terms of trade shocks. The main empirical evidence supports the argument that a real depreciated (appreciated) exchange rate is as-sociated to higher (lower) growth rates.
One of the main contributions of our empirical estimates in the next section is to extend the determinants of real exchange rates inclu-ding not only differences in per capita income but also the terms of trade, net foreign assets and government consumption.8 We have also estimated the growth models using System GMM and correcting for too many instruments (Tables 3 and 6) based on the Hansen-Diff test (p-value close to one) which has not been reported in recent studies (Rodrik, 2008; Berg and Miao, 2010).
7 Hausmann et. al (2005) also investigate a non-linear relationship for real exchange rate misa-lignment and growth for eighty episodes when growth accelerates by at least two percentage points and that acceleration lasts for at least eight years. Their main empirical finding is that real exchange rate depreciation is one of the factors associated with the occurrence of such growth accelerating episodes.
8 Berg and Miao (2010) include terms of trade, openness, government consumption and
A Panel Data Investigation of Real Exchange Rate Misalignment and Growth 439
Est. Econ., São Paulo, vol. 42, n.3, p. 433-456, jul.-set. 2012
3. The Empirics of Real Exchange Rate Misalignment and Growth
In this section we outline the empirics of measuring real exchange rate misalignments and the estimation of per capita GDP growth models using System GMM.
3.1 Real Exchange Rate Misalignment and Growth: Panel Data Esti-mation
In calculating the real exchange rate we follow the procedure sugges-ted by Rodrik (2008) and use data from the Penn World Tables 6.2 for the nominal exchange rates (XRAT) and PPP conversion factors (PPP) to calculate a real exchange rate (RER): 9
it
=
L
it it(1)
where i is a country index and t is an index for (5-year) time periods; XRAT and PPP are expressed as national currency units per U.S. dollar; L indicates that the variable is in logs.
When RER is greater than one it means that the value of the cur-rency is lower (more depreciated) than is indicated by purchasing--power parity. Given the so called Balassa-Samuelson (BS) effect, we know that non-traded goods are also cheaper in poorer countries, which requires an adjustment to take this into account. In order to capture the BS effect we run a regression of RER on per capita GDP (RGDPCH):
LRER
RGDPCH + f + u
it
=
α
+
β
L
it t it(2)
where ft is a time fixed effect and uit is the error term.
The estimation of Equation (2) provides the estimated coefficient for and if the coefficient is negative and statistically significant this can be taken as an indication of the relevance of the BS effect (Table 1, Model 1). The final step in constructing an index of un-dervaluation (misalignment) is to calculate the difference between the actual real exchange rate from Equation (1) and the exchange
9 The definition of real exchange rate as units of domestic currency relative to the U.S. dollar
rate adjusted by the BS effect from Equation (2), which we call Mis1.
We have used other model specifications in order to obtain additio-nal measures of RER misalignment and we use the Hausman test to select which one is the preferred estimation. The data refers to a set of ninety countries, where twenty four are developed countries and the remaining sixty six countries are developing and emerging coun-tries. The time series dimensions of our data set are 1980-2004.
The seven different model specifications used in Table 1 and the motivation for the inclusion of the explanatory variables is based on theoretical and empirical lessons from the literature on real exchan-ge rate determinants. The real GDP per capita (LRGDPCH) is in-cluded to capture the Balassa-Samuelson effect where countries with relative higher levels of per capita GDP are supposed to experience a real exchange rate appreciation over time, which is associated to a negative estimated coefficient. The net foreign asset (NFAGDP) variable is used as a proxy to capture external (current account) ad-justment and countries with better current account position should face real exchange appreciation over time, which is associated with a negative estimated coefficient. Terms of trade (LTT) improve-ments are associated to higher ratios of export to import prices and
ceteris paribus, with better trade performance and real exchange rate appreciation over time (negative estimated coefficient). Finally, the inclusion of government consumption (LGOV) seeks to capture changes in the composition of demand since it is generally thought to fall more heavily on non-traded goods and given that such goods are more supply inelastic, the outcome is a real exchange rate appre-ciation (negative estimated coefficient).
A Panel Data Investigation of Real Exchange Rate Misalignment and Growth 441
Est. Econ., São Paulo, vol. 42, n.3, p. 433-456, jul.-set. 2012
statistically significant in different model specifications and with the expected coefficient signs.
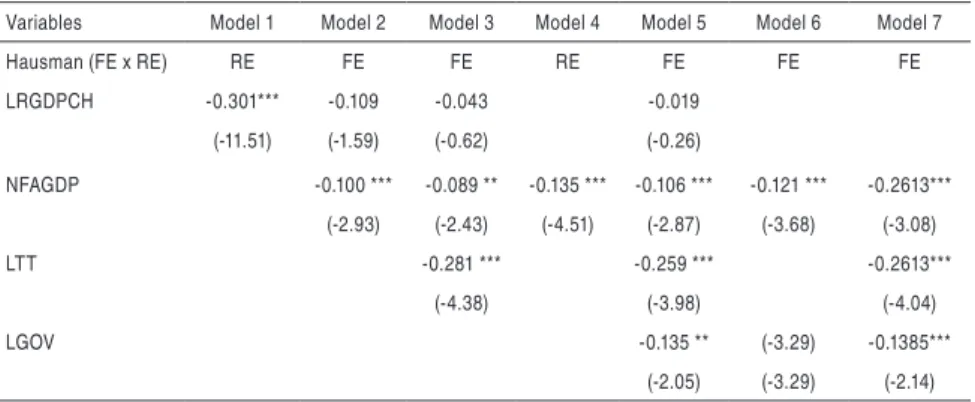
Table 1 - Model Estimation for Real Exchange Rate (log)
Variables Model 1 Model 2 Model 3 Model 4 Model 5 Model 6 Model 7
Hausman (FE x RE) RE FE FE RE FE FE FE
LRGDPCH -0.301*** -0.109 -0.043 -0.019
(-11.51) (-1.59) (-0.62) (-0.26)
NFAGDP -0.100 *** -0.089 ** -0.135 *** -0.106 *** -0.121 *** -0.2613***
(-2.93) (-2.43) (-4.51) (-2.87) (-3.68) (-3.08)
LTT -0.281 *** -0.259 *** -0.2613***
(-4.38) (-3.98) (-4.04)
LGOV -0.135 ** (-3.29) -0.1385***
(-2.05) (-3.29) (-2.14)
Notes: t-stat (FE) and z-stat (RE) in parenthesis. RE and FE refers to Random and Fixed effect estimation. *, ** and *** indicates significance at 10%, 5% and 1% Econometric Software - Stata 10
We consider this first set of results as an indication that empirical studies such as Rodrik (2008), who uses only LRGDPCH as an ex-planatory variable to estimate the equilibrium real exchange rate and then calculate the real exchange rate misalignment (undervalu-ation), should be extended to include other determinants of the real exchange rate. In order to measure real exchange rate misalignment we then subtract the actual real exchange rate from its estimated value using the coefficients from Table 1 (Mis1, Mis2, Mis3, Mis4, Mis5, Mis6 and Mis7). The main purpose of this transformation is to investigate the role of such measures of RER misalignment in our growth models for the complete (Table 2) and developing and emer-ging (Table 3) samples, based on a two-step robust System GMM estimation.
develop a system of regressions in differences and levels. The ins-truments for the regression in differences are the lagged levels of the explanatory variables and the instruments for the regression in levels are the lagged differences of explanatory variables. These are considered as appropriate instruments under the assumption that although there may be correlation between the levels of explanatory variables and the country specific effect, there is no correlation be-tween those variables in differences and the country specific effect.
The objective here is to first estimate a simple growth model for each of our seven measures of RER misalignment and then include the lagged dependent variable and initial income level. The next step is to estimate an extended model for each measure of RER misalig-nment including other variables such as: years of education (human capital), law and order (institutions), government consumption (fiscal discipline) and inflation (macroeconomic stability).10
The estimated results for the complete sample reported in Table 2 show that all estimated coefficients for the RER misalignment are positive, meaning that a more depreciated real exchange rate helps foster long-run growth. The results are robust since most of the co-efficients are statistically significant for different measures of RER misalignment and model specification. For the models where misa-lignment is an explanatory variable with lagged growth and initial income, the estimated coefficients range from 0.204 to 0.085 and the average is 0.146, while for the extended models the range is from 0.103 to 0.026 with an average RER misalignment of 0.071, which is half of the average for the simple models. If we consider the ave-rage coefficients for RER misalignment for the simple and extended models, a 10% increase in real exchange rate misalignment increases growth from a range of 0.7% to 1.4% over a five year period, which means that the average annual increase in growth varies from 0.14% to 0.28%.
10 The choice of different growth model specifications reported on Tables 2, 3 and 6 is based
A P a n e l D a ta In v e st ig a tio n o f R e a l E x c h a n g e R a te M is a lig n m e n t a n d G ro w th 443 E st. E co n., S ã o P au lo , vo
l. 42, n.3, p
. 433-456, j
u
l.-s
et
. 2012
Table 2 - Real GDP Growth and Real Exchange Rate Misalignment (Complete Sample) System GMM
Models 1 2 3 4 5 6 7 8 9 10 11 12 13 14
GrowthPPPlag 0.194*** 0,105 0.189*** 0,099 0.228*** 0,097 0.193*** 0,09 0.233*** 0.163** 0.197*** 0.177** 0.234*** 0.163** (2,88) (1,55) (2,69) (1,45) (3,06) (1,38) (2,67) (1,22) (3,19) (2,07) (2,83) (2,16) (3,18) (2,07) Initial Income 0.053*** 0,003 0.087*** 0,014 0.068** -0,002 0.101*** 0,022 0.072** -0,025 0.097*** 0,009 0.073** -0,025 (2,87) (0,09) (3,15) (0,42) (2,17) (-0.09) (3,14) (0,73) (2,39) (-0.63) (3,32) (0,34) (2,39) (-0.62) Mis 1 0.204*** 0.103*
(3,82) (1,83)
Mis 2 0.196*** 0.100* (3,72) (1,83)
Mis 3 0.085* 0,026
(1,69) (0,53)
Mis 4 0.185*** 0.092*
(3,58) (1,80)
Mis 5 0.089* 0,041
(1,80) (1,13)
Mis 6 0.179*** 0.096**
(3,50) (2,36)
Mis 7 0.088* 0,041
(1,78) (1,13)
Educ 0,078 0,085 0.092** 0.084* 0,063 0,045 0,064
(1,42) (1,50) (1,98) (1,73) (1,07) (0,81) (1,08) Law 0,034 0.034* 0.033** 0.034* 0.039*** 0.032*** 0.039***
(1,64) (1,70) (2,04) (1,67) (2,66) (2,74) (2,66) Gov -0.111** -0.103* -0.127*** -0.106**
(-2.15) (-1.92) (-2.85) (-2.14)
Inf -1,60E-05 -1,10E-05 -2,40E-05 -1,10E-05 -2,50E-05 -8,76E-06 -2,00E-05 (-0.68) (-0.4) (-0.9) (-0.42) (-0.67) (-0.25) (-0.68) AR(2) 0,59 0,403 0,533 0,392 0,45 0,263 0,516 0,405 0,417 0,259 0,538 0,313 0,417 0,258 Hansen 0,151 0,207 0,142 0,299 0,125 0,363 0,143 0,292 0,13 0,296 0,17 0,442 0,126 0,295 Hansen-Diff 0,721 0,433 0,705 0,48 0,928 0,806 0,73 0,459 0,828 0,675 0,85 0,85 0,815 0,675 Number of Groups 80 71 80 71 80 71 80 71 80 71 80 71 80 71 Number of Instruments 37 73 37 73 37 73 37 73 37 64 37 64 37 64
Note: t-stat in parenthesis. *, ** and *** indicates significance at 10%, 5% and 1% respectively. System GMM 2-step Robust Estimation with Time Dummies
Table 3 reports the estimated results for developing and emerging countries and it shows that all estimated coefficients for RER mi-salignment are positive, indicating that a more depreciated real ex-change rate helps foster long-run growth.
A P a n e l D a ta In v e st ig a tio n o f R e a l E x c h a n g e R a te M is a lig n m e n t a n d G ro w th 445 E st. E co n., S ã o P au lo , vo
l. 42, n.3, p
. 433-456, j
u
l.-s
et
. 2012
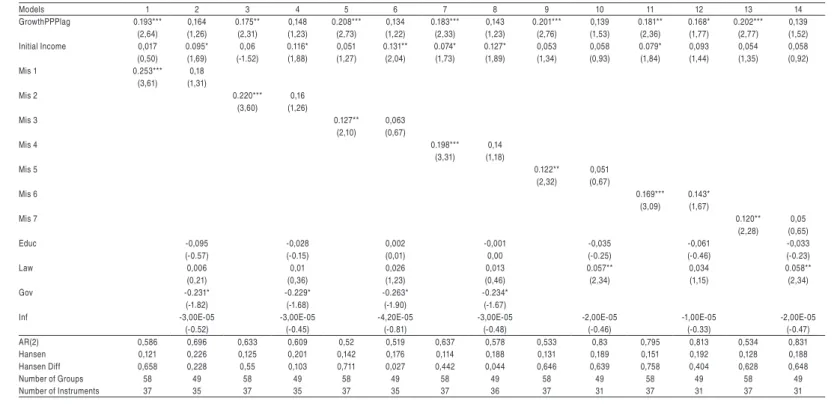
Table 3 - Real GDP Growth and Real Exchange Rate Misalignment (Developing and Emerging) System GMM
Models 1 2 3 4 5 6 7 8 9 10 11 12 13 14
GrowthPPPlag 0.193*** 0,164 0.175** 0,148 0.208*** 0,134 0.183*** 0,143 0.201*** 0,139 0.181** 0.168* 0.202*** 0,139 (2,64) (1,26) (2,31) (1,23) (2,73) (1,22) (2,33) (1,23) (2,76) (1,53) (2,36) (1,77) (2,77) (1,52) Initial Income 0,017 0.095* 0,06 0.116* 0,051 0.131** 0.074* 0.127* 0,053 0,058 0.079* 0,093 0,054 0,058 (0,50) (1,69) (-1.52) (1,88) (1,27) (2,04) (1,73) (1,89) (1,34) (0,93) (1,84) (1,44) (1,35) (0,92) Mis 1 0.253*** 0,18
(3,61) (1,31)
Mis 2 0.220*** 0,16 (3,60) (1,26)
Mis 3 0.127** 0,063
(2,10) (0,67)
Mis 4 0.198*** 0,14
(3,31) (1,18)
Mis 5 0.122** 0,051
(2,32) (0,67)
Mis 6 0.169*** 0.143*
(3,09) (1,67)
Mis 7 0.120** 0,05
(2,28) (0,65) Educ -0,095 -0,028 0,002 -0,001 -0,035 -0,061 -0,033 (-0.57) (-0.15) (0,01) 0,00 (-0.25) (-0.46) (-0.23)
Law 0,006 0,01 0,026 0,013 0.057** 0,034 0.058**
(0,21) (0,36) (1,23) (0,46) (2,34) (1,15) (2,34) Gov -0.231* -0.229* -0.263* -0.234*
(-1.82) (-1.68) (-1.90) (-1.67)
Inf -3,00E-05 -3,00E-05 -4,20E-05 -3,00E-05 -2,00E-05 -1,00E-05 -2,00E-05 (-0.52) (-0.45) (-0.81) (-0.48) (-0.46) (-0.33) (-0.47) AR(2) 0,586 0,696 0,633 0,609 0,52 0,519 0,637 0,578 0,533 0,83 0,795 0,813 0,534 0,831 Hansen 0,121 0,226 0,125 0,201 0,142 0,176 0,114 0,188 0,131 0,189 0,151 0,192 0,128 0,188 Hansen Diff 0,658 0,228 0,55 0,103 0,711 0,027 0,442 0,044 0,646 0,639 0,758 0,404 0,628 0,648 Number of Groups 58 49 58 49 58 49 58 49 58 49 58 49 58 49 Number of Instruments 37 35 37 35 37 35 37 36 37 31 37 31 37 31
Note: t-stat in parenthesis. *, ** and *** indicates significance at 10%, 5% and 1% respectively.
Models 2, 4, 6, 8, 10, 12 and 14 are estimated with the Collapse Command from Stata 10 in order to deal with too many instruments
System GMM 2-step Robust Estimation with Time Dummies
Comparing the results for the complete sample and the developing and emerging countries, it is clear that the estimated coefficients for RER misalignment are higher for developing and emerging coun-tries, suggesting that a policy based on sustaining a depreciated real exchange rate has a long-run impact on growth that is magnified for such countries. Our first set of empirical results on the role of RER misalignment for long-run growth supports the findings from other recent studies, such as Rodrik (2008), Berg and Miao (2010), Aguirre and Calderón (2006), Gala and Lucinda (2006) and Eichengreen (2008) in the sense that an undervalued real ex-change rate is beneficial for long-run growth, while the opposite is true for an overvalued real exchange rate. On the other hand, our estimated models have provided additional empirical evidence that long-run equilibrium exchange rates should not be modeled only as a function of real per capita GDP (Rodrik, 2008), but should include other determinants, such as the terms of trade, net foreign assets and government consumption.
3.2 Real Exchange Rate Misalignment and Growth: Panel Unit Roots and Cointegration
The aim of this section is to use panel cointegration analysis to cal-culate the RER misalignment and then estimate the panel growth models to see how robust the results are when compared to those from the previous section in terms of the magnitude and significance of the estimated coefficients.
3.2.1 Unit Roots and Panel Cointegration Tests
A Panel Data Investigation of Real Exchange Rate Misalignment and Growth 447
Est. Econ., São Paulo, vol. 42, n.3, p. 433-456, jul.-set. 2012
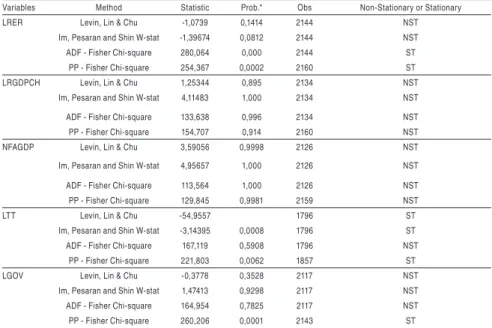
terms of trade and government consumption there are mixed results regarding the non-stationarity of each variable.11
Table 4 - Panel Unit Roots Tests
Variables Method Statistic Prob.* Obs Non-Stationary or Stationary LRER Levin, Lin & Chu -1,0739 0,1414 2144 NST
Im, Pesaran and Shin W-stat -1,39674 0,0812 2144 NST ADF - Fisher Chi-square 280,064 0,000 2144 ST PP - Fisher Chi-square 254,367 0,0002 2160 ST LRGDPCH Levin, Lin & Chu 1,25344 0,895 2134 NST Im, Pesaran and Shin W-stat 4,11483 1,000 2134 NST ADF - Fisher Chi-square 133,638 0,996 2134 NST PP - Fisher Chi-square 154,707 0,914 2160 NST NFAGDP Levin, Lin & Chu 3,59056 0,9998 2126 NST Im, Pesaran and Shin W-stat 4,95657 1,000 2126 NST ADF - Fisher Chi-square 113,564 1,000 2126 NST PP - Fisher Chi-square 129,845 0,9981 2159 NST LTT Levin, Lin & Chu -54,9557 1796 ST Im, Pesaran and Shin W-stat -3,14395 0,0008 1796 ST ADF - Fisher Chi-square 167,119 0,5908 1796 NST PP - Fisher Chi-square 221,803 0,0062 1857 ST LGOV Levin, Lin & Chu -0,3778 0,3528 2117 NST Im, Pesaran and Shin W-stat 1,47413 0,9298 2117 NST ADF - Fisher Chi-square 164,954 0,7825 2117 NST PP - Fisher Chi-square 260,206 0,0001 2143 ST
* Probabilities for Fisher tests are computed using an asymptotic Chi-square distribution. All other tests assume asymptotic normality.
Im, Pesaran and Shin; ADF - Fisher and PP - Fisher - Null Hypothesis: Unit Root (Individual Unit Root process).
Levin, Lin & Chu Test - Null Hypothesis: Unit Root (common Unit Root process). Automatic lag length selection based on Modified Schwarz Criteria and Bartlett kernel. Econometric Software - Eviews 6.
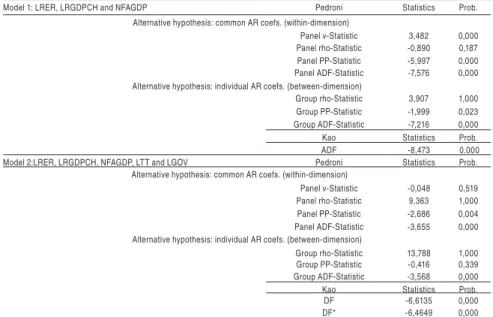
The recent literature has focused on tests of cointegration in a panel setting and we provide the results in Table 5 for two panel cointe-gration tests based on Pedroni (1999) (2004) and Kao (1999), where both are Engle-Granger based tests. The cointegration tests proposed by Pedroni (1999) (2004) allow for heterogeneous intercepts and trend coefficients across cross-sections, with different methods of constructing statistics for testing the null hypothesis of no cointe-gration. There are two alternative hypotheses: the homogenous alter-native which is called the within-dimension test, or panel statistics test, and the heterogeneous alternative referred to as the between-dimension, or group statistics test. This type of panel cointegration
11 We have also used the Hadri (2000) unit root test, where stationarity is the null hypothesis
test has the advantage over others that it allows for heterogeneous variances across countries at each point in time allowing to pool the long-run information contained in the panel, while permitting the short-run dynamics to vary among different groups. The Kao (1999) test follows the same basic approach but specifies cross-section spe-cific intercepts and homogeneous coefficients in the first-stage re-gressors. The panel cointegration results from Table 5 provide us with evidence of cointegration since most of Pedroni test statistics reject the null hypothesis of no cointegration for the two estimated models and the same interpretation can be drawn from the Kao test statistics where the null is rejected in both cases.12
Table 5 - Panel Cointegration Tests: Pedroni and Kao
Model 1: LRER, LRGDPCH and NFAGDP Pedroni Statistics Prob. Alternative hypothesis: common AR coefs. (within-dimension)
Panel v-Statistic 3,482 0,000 Panel rho-Statistic -0,890 0,187 Panel PP-Statistic -5,997 0,000 Panel ADF-Statistic -7,576 0,000 Alternative hypothesis: individual AR coefs. (between-dimension)
Group rho-Statistic 3,907 1,000 Group PP-Statistic -1,999 0,023 Group ADF-Statistic -7,216 0,000 Kao Statistics Prob. ADF -8,473 0.000 Model 2:LRER, LRGDPCH, NFAGDP, LTT and LGOV Pedroni Statistics Prob. Alternative hypothesis: common AR coefs. (within-dimension)
Panel v-Statistic -0,048 0,519 Panel rho-Statistic 9,363 1,000 Panel PP-Statistic -2,686 0,004 Panel ADF-Statistic -3,655 0,000 Alternative hypothesis: individual AR coefs. (between-dimension)
Group rho-Statistic 13,788 1,000 Group PP-Statistic -0,416 0,339 Group ADF-Statistic -3,568 0,000 Kao Statistics Prob. DF -6,6135 0,000 DF* -6,4649 0,000 Null Hypothesis: No Cointegration.
Pedroni Test: Automatic lag length selection based on SIC with a max lag of 4. Kao Test: Automatic lag length selection based on SIC: 5 for model 1 and 0 for model 2. Pedroni and Kao Tests: Newey-West automatic bandwidth selection and Bartlett kernel. Pedroni and Kao Tests - Trend assumption: No deterministic trend.
Econometric Software - Eviews 6.
12 The choice of the two model specifications for the cointegration analysis developed in Table
A Panel Data Investigation of Real Exchange Rate Misalignment and Growth 449
Est. Econ., São Paulo, vol. 42, n.3, p. 433-456, jul.-set. 2012
Having estimated the panel unit root and cointegration tests we then estimate a vector error correction model (VECM) for the two model specifications reported in Table 5 (Models 1 and 2) in or-der to obtain the two measures of real exchange rate misalignment (MisCoint 1 and MisCoint 2) as the difference between the actual and predicted real exchange rate.13
3.2.2 Growth and Real Exchange Rate Misalignment: System GMM Estimation
The results for our two-step System GMM growth model are repor-ted in Table 6 using the two measures of RER from the VECM and they indicate that the estimated coefficients are positive and the results are robust for different models and sets of countries. This evidence therefore supports the previous estimated results (Tables 2 and 3) that a more depreciated real exchange rate enhances long-run growth.
Another feature from the System GMM growth model is that for the complete sample the estimated coefficients for the two measures of RER misalignment are statistically significant, regardless of which model specification is used, while this is not the case for the develo-ping and emerging market countries sample due to the fact that the Hansen-Diff statistics on previously estimated models suggest that we need to collapse the number of instruments.14
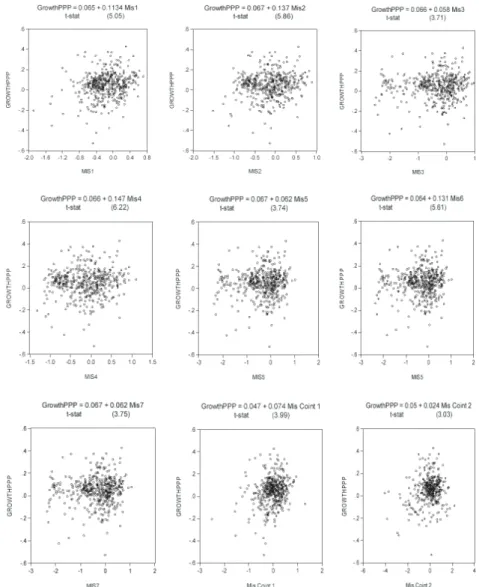
13 Figure 1A (appendix) shows the estimated coefficients and significance for a panel
regres-sion (fixed effects) of real GDP growth and each one of our nine measures of RER misa-lignment and it is clear that the coefficients are positive and statistically significant for all estimated models.
14 We did not report the results for developing and emerging countries without collapsing the
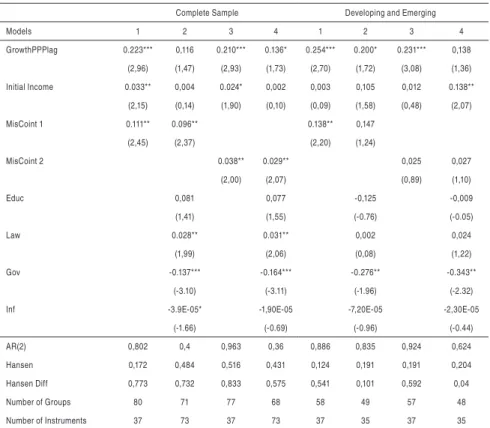
Table 6 - Real GDP Growth - System GMM (Using Panel Cointegration to Estimate Real Exchange Rate Misalignment)
Complete Sample Developing and Emerging
Models 1 2 3 4 1 2 3 4
GrowthPPPlag 0.223*** 0,116 0.210*** 0.136* 0.254*** 0.200* 0.231*** 0,138 (2,96) (1,47) (2,93) (1,73) (2,70) (1,72) (3,08) (1,36) Initial Income 0.033** 0,004 0.024* 0,002 0,003 0,105 0,012 0.138** (2,15) (0,14) (1,90) (0,10) (0,09) (1,58) (0,48) (2,07) MisCoint 1 0.111** 0.096** 0.138** 0,147
(2,45) (2,37) (2,20) (1,24)
MisCoint 2 0.038** 0.029** 0,025 0,027 (2,00) (2,07) (0,89) (1,10) Educ 0,081 0,077 -0,125 -0,009 (1,41) (1,55) (-0.76) (-0.05) Law 0.028** 0.031** 0,002 0,024 (1,99) (2,06) (0,08) (1,22) Gov -0.137*** -0.164*** -0.276** -0.343**
(-3.10) (-3.11) (-1.96) (-2.32) Inf -3.9E-05* -1,90E-05 -7,20E-05 -2,30E-05
(-1.66) (-0.69) (-0.96) (-0.44) AR(2) 0,802 0,4 0,963 0,36 0,886 0,835 0,924 0,624 Hansen 0,172 0,484 0,516 0,431 0,124 0,191 0,191 0,204 Hansen Diff 0,773 0,732 0,833 0,575 0,541 0,101 0,592 0,04 Number of Groups 80 71 77 68 58 49 57 48 Number of Instruments 37 73 37 73 37 35 37 35 Note: t-stat in parenthesis. *, ** and *** indicates significance at 10%, 5% and 1% respectively. Mis Coint 1 includes LRER and two non-stationary variables (LRGDPCH and NFAGDP). Mis Coint 2 includes LRER and four variables (LRGDPCH, NFAGDP, LTT and LGOV).
Models 2 and 4 for Developing and Emerging use the Collapse command from Stata 10 to correct for too many instruments.
System GMM 2-step Robust Estimation with Time Dummies. Econometric Software - Stata 10.
In terms of the magnitude of the estimated coefficients for the two measures of RER misalignment, there are significant differences for the complete and developing / emerging samples, where for the for-mer the coefficients for MIsCoint1 varies from 0.111 to 0.096 and from 0.138 to 0.147 for the latter. For MisCoint2 the estimated coefficients vary from 0.038 to 0.029 for the complete sample and from 0.025 to 0.027 for developing and emerging economies.
A Panel Data Investigation of Real Exchange Rate Misalignment and Growth 451
Est. Econ., São Paulo, vol. 42, n.3, p. 433-456, jul.-set. 2012
period in the range of 0.29% to 1.1% for the complete sample, which translates into annual increases in growth of 0.06% and 0.22%. For developing and emerging market countries a 10% increase in RER misalignment increases growth over a five year period in the range of 0.25% to 1.4%, resulting in annual increases in growth in the range of 0.05% to 0.28%.15
One final task is to test for non-linearity, taking the same growth regression from Table 6 for our two measures of RER misalignment, and using the squared values of misalignment. The resulting estima-ted coefficients are negative suggesting that higher levels of RER mi-salignment reduce long-run growth, but there is no statistical signi-ficance in either sample of countries and model specification.16 We have not found evidence of non-linearity in the relationship between RER misalignment and growth, which corroborates recent results (Rodrik, 2008) but there is no consensus in the empirical literature since previous studies such as Aguirre and Calderon (2006) and Razin and Collins (1997) have found the existence of non-linearities.
4. Concluding Remarks
The empirical literature on growth and real exchange rate misalign-ment using panel data analysis has developed substantially in the recent past and the evidence suggests that the more depreciated is a country’s real exchange the faster is its long-run growth. This result seems to be more significant and robust for emerging and developing countries where institutional fragility and lack of macroeconomic stability is a common feature over the past decades.
The main empirical contribution of our work has been to expand the determinants of the real exchange rate in order to calculate different measures of misalignment and to use two different econometric me-thodologies (fixed / random effects and panel cointegration analysis) for a set of almost one hundred countries with time series data from 1980 to 2004.
15 One comparison that can be made for the estimated coefficients of RER misalignments
re-lates to two sets of estimates which use the same model specification: one is between Mis2 and MisCoint1 and the second is for Mis5 and MisCoint2. See Tables 2, 3 and 6.
16 The estimated coefficients for MisCoint 1 and MisCoint 2 squared are not reported due to
Our empirical estimation of the System GMM panel growth models has shown that all estimated coefficients for the real exchange rate misalignment are positive, which means that a more real depreciated exchange rate helps real GDP growth while the opposite is true for a real exchange rate appreciation. The results are robust in terms of statistically significant coefficients for different samples and mo-dels and the estimated coefficients are higher for developing and emerging market economies. The estimated coefficients from all of our nine measures of real exchange rate misalignment suggest that a 10% increase (depreciation) in real exchange rate misalignment can increase annual per capita GDP growth by up to 0.3%.
Finally, we can say that our results are in accordance with those re-ported in recent studies, such as Rodrik (2008) and Berg and Miao (2010), although we find that exchange rate misalignment has a big-ger impact on economic growth than that reported in these studies. The crucial policy recommendation to stem from our work, which is especially relevant for developing and emerging market economies, is that such economies should avoid periods of long lasting real ex-change rate appreciation and instead adopt economic policies that are able to keep the real exchange rate at a competitive level, which most of the time should be associated with a more depreciated real exchange rate relative to its equilibrium level.
References
AGHION, P.; BACCHETTA, P.; RANCIERE, R.; ROGOFF, K. Exchange Rate Volatility and Productivity Growth: The Role of Financial Development. NBER Working Paper No. 12117, 2006. AGUIRRE, A.; CALDERÓN, C. Real Exchange Rate Misalignments and Economic Performance.
Central Bank of Chile, Economic Research Division, Working Paper 315, 2006.
ARELLANO, M.; BOND, S. Some Tests of Speciication for Panel Data: Monte Carlo Evidence and
an Application to Employment Equations. Review of Economic Studies 58(2), p.277-297, 1991.
ARELLANO, M.; BOVER, O. Another Look at the Instrumental-Variable Estimation of
Error-Com-ponents Models. Journal of Econometrics 68(1), p.29-51, 1995.
BALASSA, B. The Purchasing Power Parity Doctrine: A Reappraisal. The Journal of Political
Eco-nomy, 72, p.584-596, 1964.
BARRO, R. J.; LEE, J.W. International Data on Educational Attainment: Updates and Implications. Center for International Development Working Paper No. 42, Harvard University, 2000. BERG, A.; MIAO, Y. The Real Exchange Rate and Growth Revisited: The Washington Consensus
Strikes Back? IMF Working Paper, 10 (58), 2010.
A Panel Data Investigation of Real Exchange Rate Misalignment and Growth 453
Est. Econ., São Paulo, vol. 42, n.3, p. 433-456, jul.-set. 2012
CHOI, I. Unit Root Tests for Panel Data. Journal of International Money and Finance, 20, p.249-272, 2001. CLARK, P. B.; MACDONALD, R. Exchange rates and economic fundamentals: A methodological
comparison of BEERs and FEERs. IMF Working Paper, 98 (67), 1998.
COUDERT, V.; COUHARD, C. Currency Misalignments and Exchange Rate Regimes in Emerging and Developing Countries. CEPII Working Papers, No. 7, 2008.
EDWARDS, S. Exchange Rate Misalignment in Developing Countries. Baltimore, MD: Johns Hopkins University Press, 1988.
EDWARDS, S.; SAVASTANO, M. Exchange Rates in Emerging Economies: What do We Know? What do We Need to Know? NBER Working Paper No. 7228, 1999.
EICHENGREEN, B. The Real Exchange Rate and Economic Growth. Commission on Growth and Development Working Paper, No. 4, The World Bank, 2008.
FRANKEL, J. A.; ROSE, A. K. Currency crashes in emerging markets: An empirical treatment. Journal
of International Economics, 41(3-4), p.351-366, 1996.
GALA, P.; LUCINDA, C. R. Exchange Rate Misalignment and Growth: Old and New Econometric
Evidence. Revista Economia, p.165-87, 2006.
HADRI, K. Testing for Stationarity in Heterogeneous Panel Data, Econometric Journal, 3, p.148-161, 2000.
HAUSMANN, R.; PRITCHETT, L.; RODRIK, D. Growth Accelerations. Journal of Economic Growth,
10 (4), p.303-329, 2005.
HESTON, A.; SUMMERS, R.; BETTINA, A. Penn World Table Version 6.2, Center for International Comparisons of Production, Income and Prices at the University of Pennsylvania, 2006. http:// pwt.econ.upenn.edu/php_site/pwt_index.php. Accessed 19 February 2010.
IM, K. S.; PESARAN, M. H.; SHIN, Y. Testing for unit roots in heterogeneous panels. Journal of
Econometrics, 115 (1), p.53-74, 2003.
KAO, C. Spurious Regression and Residual-Based Tests for Cointegration in Panel Data. Journal of
Econometrics, 90, p.1-44, 1999.
LANE, P.; MILESI-FERRETTI, G. M. The External Wealth of Nations Mark II: Revised and Extended
Estimates of Foreign Assets and Liabilities 1970-2004. Journal of International Economics, 73,
p.223-250, 2007.
LEVIN, A.; LIN, C. F.; CHU, C. Unit Root Tests in Panel Data: Asymptotic and Finite-Sample Properties. Journal of Econometrics, 108, p.1-24, 2002.
MADDALA, G. S.; WU, S. Comparative Study of Unit Root Tests with Panel Data and a New Simple
Test. Oxford Bulletin of Economics and Statistics, 61 (1), p.631-652, 1999.
PEDRONI, P. Critical Values for Cointegration Tests in Heterogeneous Panels with Multiple Regressors, Oxford Bulletin of Economics and Statistics, 61, p.653-70, 1999.
PEDRONI, P. Panel Cointegration; Asymptotic and Finite Sample Properties of Pooled Time Series
Tests with an Application to the PPP Hypothesis. Econometric Theory, 20, p.597-625, 2004.
RAZIN, O.; COLLINS, S. M. Real Exchange Rate Misalignments and Growth. Real Exchange Rate Misalignments and Growth. NBER Working Paper No. 6174, 1997.
RODRIK, D. The Real Exchange Rate and Economic Growth. Brookings Papers on Economic Activity,
2, p.365–412, 2008.
ROODMAN, D. A Note on the Theme of Too Many Instruments. Oxford Bulletin of Economics and
E st. E co n., S ã o P au lo , vo
l. 42, n.3, p
. 433-456, j
u l.-s et . 2012 F lá v io V ile la V ie ir a e R o n a ld M a c D o n a ld
Table 1A - Variables - Definition, Source and Number of Observations
Variable Deinition Source Obs
LRER Bilateral real exchange (units of domestic currency relative to the U.S. dollar and using CPI ) IFS 450 LRGDPCH Real GDP per capita Heston et al (2010) Penn World Table 6.2 450 NFAGDP Net foreign assets as % of GDP Lane and Milesi-Ferretti (2007) 450
LGOV Government consumption as % of GDP WDI 446
LTT Ratio of export to import prices (2000 = 100) WDI 386 GROWTHPPP Log difference of Real GDP per capita (PPP) growth. WDI 447 Initial Income Real GDP per capita (PPP) level in 1980, 1985, 1990, 1995 and 2000 WDI 447 LEDUC Average number of years of schooling of the population aged above 15 years in 1980, 1985, 1990, 1995, and 2000 Barro and Lee (2000) 394
INF Inlation measured by the consumer price index (annual %). WDI 439
LTRADE Sum of exports and imports of goods and services as a % of GDP WDI 445
LAW The "law" sub-component assesses the strength and impartiality of the legal system, and the "order"
sub-component assesses popular observance of the law (scale from zero to six). International Country Risk Guide 444
Mis 1 Measure of RER misalignment using LRGDPCH 450
Mis 2 Measure of RER misalignment using LRGDPCH and NFAGDP 450 Mis 3 Measure of RER misalignment using LRGDPCH, NFAGDP and LTT 450
Mis 4 Measure of RER misalignment using NFAGDP 450
Mis 5 Measure of RER misalignment using LRGDPCH, NFAGDP, LTT and LGOV 450 Mis 6 Measure of RER misalignment using NFAGDP and LGOV 450 Mis 7 Measure of RER misalignment using NFAGDP, LTT and LGOV 450 MisCoint 1 RER misalignment - Panel Cointegration (LRER, LRGDPCH and NFAGDP) 450 MisCoint 2 RER misalignment - Panel Cointegration (LRER, LRGDPCH, NFAGDP, LTT and LGOV) 389 All measures of RER misalignment are in log L = variable in log
A Panel Data Investigation of Real Exchange Rate Misalignment and Growth 455
Est. Econ., São Paulo, vol. 42, n.3, p. 433-456, jul.-set. 2012 Table 2A - List of Countries - Complete Sample
Figure 1A - Growth and RER Misalignment – Panel Regression (Fixed Effects)