1
A HOLISTIC ATTEMPT TO PREDICTING EXCESS
AFTERMARKET RETURNS OF IPOS OVER A 90-DAY
PERIOD POST IPO
Jasper J.K. van den Heuvel
–
22512
Double Degree Finance
–
Financial Economics (Banking)
Nova School of Business and Economics
Maastricht University School of Business & Economics
Master thesis supervised by:
Dr. Stefan Straetmans (Maastricht University SBE)
Dr. André C. Silva (Nova SBE)
2
ABSTRACT
3
INTRODUCTION
Initial public offerings (IPOs) seem to be the golden apples that make you rich. However, it has proven to be very hard to get in on the IPO action as a small investor. As brokers are looking to sell large amounts of stocks to institutional investors and favor their best customers, it is virtually impossible to get a piece of the IPO pie. Therefore, this research attempts to create a strategy for small-time investors to benefit from IPOs.
Since small-time investors are rarely able to buy the IPO shares at a discount, I research which variables possibly determine the returns over a holding period of 89 days which starts
one day after the stock’s initial listing on the exchange. The rationale for the 89 day holding
period can be explained by Rule 144 of the Securities Exchange Commission (SEC). In a nutshell, by issuing Rule 144, the SEC has restricted the trade of securities owned by any person who directly or indirectly controls the issuer for the first ninety days after the stock’s initial offer date. Even though the SEC does not require firms to have a minimum lock-up period, the inability of these individuals to sell their shares directly at the initial offer date can be regarded as such. Arguably, the introduction of Rule 144 as artificial minimum
holding period leads to an increase of the stock’s supply after the 90th trading day as the
individuals that had been restricted until that day start offloading their holdings. Understandably, this sudden surge in supply affects the stock price in a negative manner.
This research is an attempt to forecast the stock’s excess return over the S&P500 index over
the time period of one day after the stock’s initial offering and the theoretical drop in value
4
RESEARCH QUESTIONS
What factors determine the after-market returns of IPOs? The main goal of this research is to attempt to design a model that by use of a regression predicts the post debut excess return of IPOs after 89 trading days. The model should provide a holistic approach by combining variables from previous research, and by using a more recent dataset than used before. The model will be in the form of a regression:
𝐸𝑥𝑐𝑒𝑠𝑠 𝑟𝑒𝑡𝑢𝑟𝑛𝑡𝐼𝑃𝑂+90 = 𝛼 + 𝛽1(𝐴𝑔𝑒) + ⋯ + 𝛽6(𝑡𝑒𝑐ℎ 𝑑𝑢𝑚𝑚𝑦)
Where 𝑡𝐼𝑃𝑂+90 stands for the IPO date plus 90 trading days.
The first and foremost question to be answered is whether the excess returns over the 90-day holding period are actually larger than the returns of longer holding period, in which investors have started the disposal of their holdings. Since lock-up periods typically range from 90 to 180 days, with outliers lasting as long as three years (Mohan & Chen, 2000), I expect to see at least a significant difference in the average excess return between the 90-day and 100-day holding period as investors start offloading holdings directly at the elimination of the period of restricted trade.
Second, I research the influence of the company’s age-at-IPO on aftermarket performance as researched by Clark (2002). Clark suggests that the company’s age-at-IPO and aftermarket performance are negatively correlated. In his research Clark refers to a model from Jovanovic and Rousseau (2001)0 which views the duration of the pre-IPO waiting phase as the result of a tradeoff between firm learning and the opportunity cost related with delay
5
early investors and creditors assess the firm’s potential, risks and optimal deployment of capital. This learning process is key since their capital investment is irreversible and the leaning process reduces the possibility of a capital mistake. However, the same learning process delays the realization of revenues for the firm, creating an opportunity cost that varies
in size depending on the quality of the idea. Ceteris Paribus, the better the firm’s idea, product
of business model, the greater the opportunity cost of delay and the younger the firm is at IPO.
Third, I research whether accounting-based measures can forecast the aftermarket performance over the holding period of 89 days. Where this research will model the performance of stock returns, Platt (1995) uses accounting-based measures to estimate the probability of failure of the ith company. Platt initially defined a list of 31 ratios that consisted primarily from combinations of balance sheet items1. However, since most of the ratio’s proved ineffective for the estimation of failure, and under the efficient market hypothesis the risk of failure is almost instantly incorporated in pricing decisions, only the following subset of the ratios are tested here: The ratio of interest expense over cash, long-term debt over cash flow from operations, and the ratio of long-term debt over cash flow times the inverse of the prime rate, which is the interest rate typically charged by lenders to their triple-A customers.
The ratio of interest expense to cash should indicate the organization’s ability to repay their
debt. Since interest is paid with available liquid resources, a higher ratio indicates that the organization would have more trouble repaying the debt than organizations with lower ratios. The ratio of long-term debt / cash flow has an implication that is very similar to the ratio of
6
interest expenses over cash; a higher ratio implies a higher debt burden, higher risk of failure and lower performance. By including the prime rate I can research whether the magnitude of the prime rate has an influence on the performance of an IPO. The rationale behind this is that with high prime interest rates large levels of debt should have a negative effect on the
organization’s performance. In contrast, when prime interest levels are low, organizations
that have taken on debt as a cheap source of financing should have better performance levels than organizations that failed to take on the cheap debt. In addition to the subset of ratios taken from Platt (1995), I add the natural logarithm of R&D expenses to the list of tested variables. I expect a positive relationship between R&D expenses and performance as intuitively, increased R&D expenses should lead to increasingly promising products and business models. The final accounting-based variable is taken from Loughran & Ritter (2004) who argue that the amount of assets on the firm’s balance sheet limits the percentage of first-day returns as it reduces the amount of underpricing as the IPO is considered less risky.
Fourth, I examine the influence of the amount of time between the announcement of the IPO and the IPO date on aftermarket performance as researched by Plotnicki & Szyszka (2014). Under bullish market conditions, managers will tend to minimize the time necessary to go public in order to take advantage of high valuations as quickly as possible. In contrast, when the market cools down in the period between IPO-announcement and IPO-date, the
organization’s managers will try to delay the actual IPO until the good market conditions
7
Fifth and finally, I research the relationship between first-day returns and the return over a holding period ranging from the second trading day until the ninetieth trading day as described by Krigman, Shaw & Womack (1999) who find that IPOs that incurred losses during the first day of trading, and extra-hot IPOs will underperform compared to IPOs that showed slightly positive profits during the first day of trading.
LITERATURE REVIEW
Why modelling the performance of IPOs is different from modelling the performance
of other corporate organizations.
Platt (1995) argues that many of the differences between modelling corporate versus IPO survival arise from the reasons why privately held companies go public. The reasons to go public include raising capital and the opportunity for entrepreneurs and investors to cash out of their investment. Demers & Joos (2007): In terms of efficient pricing and risk assessment IPO firms are different by character from firms that have a public trading history; there is a lack of information about IPO firms, and therefore there is greater uncertainty associated with their valuation. Extensive research has been performed on the relationships between specific variables and the performance of IPOs. These researches include –but are not limited to- the relationships between performance and balance sheet items, firm specific
characteristics during and before the IPO such as the company’s age, characteristics of the
8
a recent holistic take that implements the areas described above in one model. The following section reviews some of the previous researches.
A large extent of literature on IPO performance focuses on the initial stages of the IPO and in particularly on underpricing. Underpricing is the pricing of the IPO under its market value which happens for a number of reasons. Underpricing most often occurs because of price uncertainties or the uncertainties about the volatility of the stock price. In addition, since IPO issuers and underwriter tend to have more information about the stock than the rest of the market, a company may decide to underwrite its stock as it is a signal of good intentions. Since supply and demand will eventually drive the stock price upwards towards its real value, IPO returns on the first day of trading are in a way artificially boosted which explains why it is important to include literature on the reasons for IPO underpricing.
Lowry and Shu (2002) examine the implications of litigation risk on IPO underpricing. They argue that there are three reasons that partly explain underpricing: information asymmetry, litigation risk and signaling. According to them, litigation risk has received relatively little attention in empirical research. They argue that firms with higher litigation risk [e.g. the risk of legal action being taken as a result of the firm’s (in-)actions, products or services] are using underpricing as a defense mechanism against losses caused by lawsuits. This argument follows from the hypothesis that underpricing reduces expected
litigation cost. Where a firm’s first weapon against falling subject to litigation cost is to
9
of 1933 provides investors with a standardized manner of calculating potential financial gains based on the difference between the offer price and either the price of the security at the time
of the lawsuit or the security’s sale price. By underwriting more heavily, the firm reduces the
spread between the offer- and trading price and thereby reduces potential damages such as
settlement cost, which in turn reduces the plaintiffs’ incentives to sue substantially. For that
reason, Lowry and Shu find that firms with higher litigation risk tend to turn to underpricing their IPOs more.
10
Platt (1995) analyzes prospectus data of IPOs to develop a model that predicts an
IPO’s survival after the first three years of issuance. Platt defines a list of 32 bankrupt IPO
companies, and 76 survivor IPO companies and gathers data from their respective UPO prospectuses. Platt finds that only 3 out of the original 31 tested ratios - “Interest/Cash”,
“Inventory/Cash flow”, and “Long-term debt/Cash flow” are significant and therefore useful
to predict the IPOs survival. Furthermore, he finds that elevated ratios of Interest/Cash, Inventory/Cash flow, and Long-term debt/Cash flow, all have a negative effect on the IPOs probability of survival which seems rational. One ratio that was not statistically significant but is particularly interesting because of the rationale behind it; the Long-term debt /Cash flow*(1/Prime rate). With large levels of debt at high prime interest rates should have a
negative effect on the organization’s performance. In contrast, when prime interest levels are
low, organizations that have taken the opportunity to load onto cheap debt should perform better than organizations that have failed to do so. It should be noted that Platt’s research only contains a total sample of 108 IPOs. The rather small sample in combination with fact that many IPOs are “packaged” to sell could be the reason that only so little ratios had a significant impact on the estimation.
11
rely more on intangible assets, record accounting losses due to large research and development expenses more regularly and are very often largely equity-financed. Especially relevant for the research at hand to the 90-day returns, is that Demers & Joos suggest that IPO failure can be well estimated by a model that predominantly consists out of accounting variables and that their forecasts for IPO failure are negatively associated with one-year post-IPO abnormal returns. In contrast to the dataset of Platt (1995), the dataset is quite extensive, consisting out of 3973 new issues for the period January 1980 – December 2000. To determine whether a company belongs to the high-tech or non-tech sector, Demers & Joos
use the ratio of R&D expenses over sales. Companies with ratio’s larger than 5% are
considered high-tech firms. A critical note however, is that sales is a very crude measure and rarely a direct value driver. It is difficult to distinguish a ‘tech’ firm from a ‘non-tech’ firm by simply looking at the ratio of R&D over sales. Even categorizing firms by using SIC codes as performed by Loughran & Ritter (2004) may not always lead to the right classification. For example, car manufacturer TESLA (Bloomberg ticker: TSLA:US) who has put substantial effort in research and development to design and market one of the first mass-produced electronic cars was allocated the SIC code 3711 (Motor Vehicles and Passenger Car Bodies) by NASDAQ and is at the same time considered a tech company merely because of its inclusion into the NASDAQ. In contrast, BMW (Bloomberg ticker: BMW:IM) who also considers technology (such its ‘Efficient Dynamics’ technology or its EV-branch ‘i') as a selling point would be merely classified as a car manufacturer. To avoid the problem of a
firm being ‘up for judgment’ as to define it as a tech-company or not, the fact whether the
12
Clark (2002) researches the relationship between the firm’s age-at-IPO and long-run aftermarket performance. Clark suggests that a useful model for understanding why some firms IPO at such young ages is provided by Jovanovic and Rousseau (2001). Jovanovic and Rousseau view the age of the firm at IPO as result of a tradeoff between learning and opportunity cost. Essentially, the management of the firm works on refining the firm’s strategy and products before the firm is ready for its IPO. At the same time, investors and creditors build their assessment of the firm’s risks, potential and optimal capital structure. According to Jovanovic and Rousseau, this pre-IPO learning process is of utmost importance
for both the firm’s managers as well as the investors and creditors as it reduces the possibility
of a capital mistake. On the other hand, the pre-IPO learning process creates an opportunity cost for the firm as it delays the realization of revenues for the firm. The better the idea, the higher the opportunity cost, and the earlier the firm’s IPO. Consistent to prior research on the matter, Clark finds overall negative abnormal returns for the whole sample of IPOs during the period of 1991 to 1997. Just like Demers & Joos (2007), Clark observes that the relationship is different for technology and non-technology firms. Where the relationship between age and returns is slightly positive for non-technology firms, firms that were very young at IPO outperformed firms that were older, particularly during the 1995 – 1997 period. Finally, examining the age at IPO of firms that were previously delisted revealed that younger firms, and young high-tech firms in specific, were more like to suffer from financial difficulty large enough the be delisted.
13
days post the market debut is higher for firms with faster IPO processes and that the increased performance can be explained by the disposition effect. In order to understand the influence of the disposition effect on post debut performance, Plotnicki & Szyszka first explain the underlying reasoning why some firms have shorter IPO processes than others. According to them, managers have utility functions that are similar to the utility functions as described by
Kahneman & Tversky’s prospect theory (1979). The prospect theory describes the investor’s
utility curve during times of profits and losses. When investors hold shares with current market prices higher than the purchasing price, investors will display risk aversive behavior by closing their position in order to lock in a sure profit. Alternatively, when the investor holds stocks with share prices that are currently below the purchasing price, investors become more risk loving and postpone the realization of losses. Linking the prospect theory to IPOs, Plotnicki & Szyszka argue that managers who are considering an IPO derive an initial valuation of their company based on multiples of publicly traded competitors. When bullish
market circumstances post the manager’s initial valuation cause these multiples to improve,
managers consider the increase in value as a gain. As the manager’s utility functions coincide
with the investors’ utility functions under the prospect theory, managers have a concave
14
among investors, Plotnicki & Szyszka argue that the disposition effect is also observed
among corporate managers and that the disposition effect influences the stock’s returns in
the short run of three days post IPO. When managers actively shorten the IPO process in bullish periods, the stock is priced according to the value of the firm around the debut date. If this date is premature, the bullish market conditions drive the market value of the firm further beyond its price at debut. Alternatively, when multiples wane under bearish post announcement circumstances, managers tend to either cancel the IPO altogether or delay until the market returns to a state that is more favorable. When managers choose to continue with the process spite of the bearish market conditions, managers try to maximize the offer price by reducing the discount that is required to attract investors. The lower discount translates in lower post IPO returns.
15
RESEARCH DESIGN
Sample
The backbone of this research is formed by a dataset built by lead of Jay R. Ritter and should be credited as the Field-Ritter dataset of company founding dates, as used in Laura C. Field and Jonathan Karpoff "Takeover Defenses of IPO Firms" in the October 2002 Journal of Finance Vol. 57. No. 5, pp. 1857-1889, and in Tim Loughran and Jay R. Ritter, "Why Has IPO Underpricing Changed Over Time?" in the Autumn 2004 Financial Management Vol. 33, No. 3, pp. 5-37. The dataset contains company names and tickers, and founding dates for 9.902 firms that went public in the U.S. during 1975 – 2014. (Ritter, 2014)
As the vast majority of research only comprises solely out of stock traded on the NASDAQ, I chose this specific dataset as it contains firms that are trading on the NASDAQ as well as the NYSE, allowing for a more holistic market research. In addition, CRSP tickers were already provided, making it easy to determine the appropriate tickers used by Bloomberg.
Firms of which the “Issuer” field obtained from Bloomberg’s data terminal are not
equal or very similar to the company name provided by Ritter are dropped. Stock prices ranging from the closing of the first day of trading and 100 trading days thereafter have been
used to determine the shareholder’s return. To account for dividend payment and stock splits,
16
trading days are dropped. Financial data is gathered from the respective firm’s balance sheet and income statements provided by the use of a Bloomberg terminal. Even though the availability is lower, the data that is present is standardized which allows for better comparisons. A substantial amount of research such as Straetmans & Chaudhry (2013) emphasizes the stylized effect that financial returns are not normally distributed. Instead of assuming that the returns are not normally distributed, I perform a Shapiro – Wilk test in order to check whether the distribution is in fact non-normal.
Figure 1: Tests whether the excess returns follow a normal distribution
The outcome of the test leaves no doubt. With a large samples and a significance of 0.000, the null hypotheses of normality are rejected.
Methodology
As I am attempting to provide a more holistic approach to determine the return over the 90 day period, the following section describes how I will mimic the methodology of researches performed in different areas. To determine which determinants actually have predicting power of performance using the underlying assumptions and data set, I will first carry out parts of the researches on their own. After observing which findings seem statistically relevant for the dataset at hand, I will incorporate these findings in a ‘holistic
17
The influence of the company’s age-at-IPO on aftermarket performance
As stated before, Clark (2002) suggests that managers make a trade-off between benefitting of firm learning and the opportunity cost related with delaying an IPO. Firms with better ideas, products or business models will tend to minimize the opportunity cost of delaying the IPO and will go public at younger ages. Under the assumption that the market is efficient, better business ideas, products and business models are generally associated with promising future returns. For that reason Clark expects to find an overall negative
relationship between a company’s age at IPO and abnormal returns. His study indeed finds
overall a negative relationship between the company’s age at IPO and abnormal returns over a holding period of three years. Just like Jovanovic and Rousseau (2001), Clark recognizes the importance of making a distinction between tech- and non-tech firms. Both researches find that technology firms publicly offered at significantly younger ages. Therefore, instead of dedicating an entire research question to this this matter, the dataset used in this research is split by using a dummy variable that takes the value “1” when the stock is traded on the actual NASDAQ or a NASDAQ related exchange such as the AMEX.
To dig deeper than just the mean ages at IPO, I use a correlation matrix to determine
the relationship between “Age at IPO” and the returns. As there is evidence that excess
18
have occurred later than 1997 or since the start of the financial crisis. This nourishes the need to control for these possibly distorting IPOs and therefore the correlation matrix is run again. Once to exclude IPOs that occurred after 2008, and another time to exclude IPOs after 1997. I will run extra regressions in order to compare the differences.
The influence of accounting-based measures on aftermarket performance
The following section describes the influence of a set of accounting-based measures on aftermarket performance. These measures are the ratio interest expense over cash, the ratio of long term debt over cash flow from operations, the ratio of long term debt over cash flow from operations times the inverse of the prime rate, the logarithm of R&D expenses, and the logarithm of total assets. These variables were taken from Platt (1995) except for the logarithm of assets - taken from Loughran & Ritter (2004) – and the logarithm of R&D expenses.
For the ratio interest rate expense / cash, and the long term debt over cash flow, I expect to find the similar results as Platt (1995), who finds that elevated ratios of Interest/Cash, Inventory/Cash flow, and Long-term debt/Cash flow, all have a negative effect on the IPOs probability of survival. I assume that the probability of survival reflected by the individual
firm’s ratios is almost immediately incorporated in the stock price through supply and
19
The influence of the length of the cooling-off period on aftermarket performance
Before testing whether the disposition effect also affects returns 90 days post IPO, I will first test whether the state of the market prior to the announcement and pricing dates has an influence on the duration of the IPO process for firms in this particular dataset. For that purpose, the return on the S&P500 index over 30, 60, and 90 trading days before the announcement date and initial offering date are used to proxy the state of the market and market sentiment for IPOs. Since the market rate 90 days prior to the announcement date shows the largest absolute coefficient (under equal significance levels), I have set up a regression model that takes the following form:
𝐶𝑖 = 𝛼𝑅𝑠𝑝90𝑖 + 𝜀𝑖
Where 𝐶𝑖 is the length of the cooling-off period in days for the i-th IPO case, 𝑅𝑠𝑝90𝑖 is the return of the S&P500 index over the 90 days prior to the announcement date measured in basis points, and 𝜀𝑖 is the error-term.
To determine the impact of the disposition effect on the return of the stock after 90 trading days, I run another regression of the following form:
𝑅90𝑖 = (𝐶𝑖) + 𝜀𝑖
20
process was lower than the median of 78. A following Wilcoxon rank sum test should then determine whether the return for firms with shorter IPO processes indeed have higher returns.
Will labelling IPOs according to their first day returns give an indication of future
performance?
As Krigman, Shaw & Womack (1999) focus on the information contained in the returns of the first day of trading, they argue that there exists a relationship between the raw return on the first day of trading and long-term performance of that stock for the coming year. By what
they call “partitioning” of the IPOs by the first-day return, it is possible to form an indication
21
RESULTS AND DISCUSSION
The influence of the company’s age-at-IPO on aftermarket performance
Table 2: Descriptive Statistics [all firms]
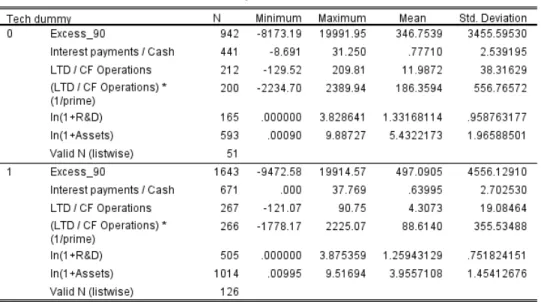
Table 3: Descriptive Statistics [Tech Dummy]
The descriptive statistics in tables 1 and 2 show that the mean age in years for non-tech organizations is almost ten years higher than the mean age at IPO for tech organizations. This would support the idea that managers act rational and minimize the opportunity cost of remaining privately owned as suggested by Clark (2002). This also gives rise to the idea that the ideas from tech firms are more pressing by nature. From the correlation matrix in table 4 it can be observed that for the entire dataset, the correlation between the excess returns and age at IPO is slightly positive and significant at a five percent confidence level. This also
coincides with Clark’s finding. However, when the dataset is divided between tech- and
22
confidence level. Therefore, the only conclusion that can be drawn is that the data only shows a rather small correlation between a firm’s age at IPO and its return.
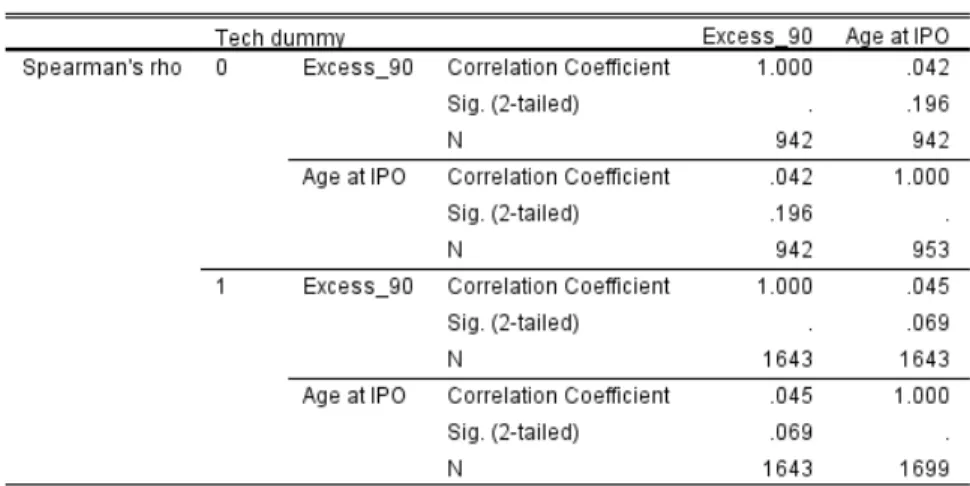
Table 4: Correlation matrix for Excess returns & Age at IPO.
Table 5: Correlation matrix for Excess returns & Age at IPO, dividing between tech- & non-tech firms.
23
returns over the CRSP value weighted stock index while the excess returns in this study are
based on the returns of the S&P500 index. As Clark tests the market’s efficiency to capitalize
on promising returns from firms that went public at a young age, the contradicting coefficients suggest that the market needs more than 90 trading days to incorporate these promising returns. A third possible reason for the contradicting findings lies in the time period in which the firms went public.
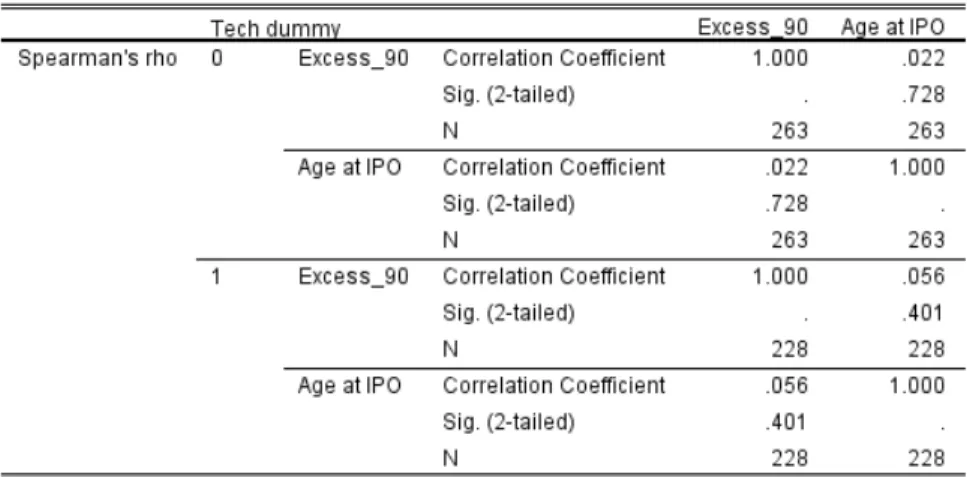
Table 6: Correlation matrix Excess returns & Age at IPO for firms that publicly offered before 2008.
24
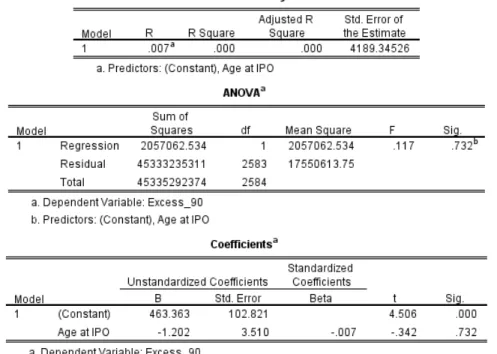
As can be observed from figures 5, 6 and 7, I find no reason to assume that the correlations were different (or even more statistically significant) for public offerings in other periods of time. As the distinction between tech and non-tech firms distorts the relationship, I regress the Age at IPO against the excess return after 90 trading days. Figure 7 shows the results of the regression. I find that the model is highly insignificant from the correlation matrices, and therefore this model does not explain any of the change in the return. This finding is robust with the inclusion of a tech dummy, nor transforming the variable Age at IPO to the natural logarithm ln(1+Age) of a tech dummy improves the results.
25
The influence of accounting-based measures on aftermarket performance
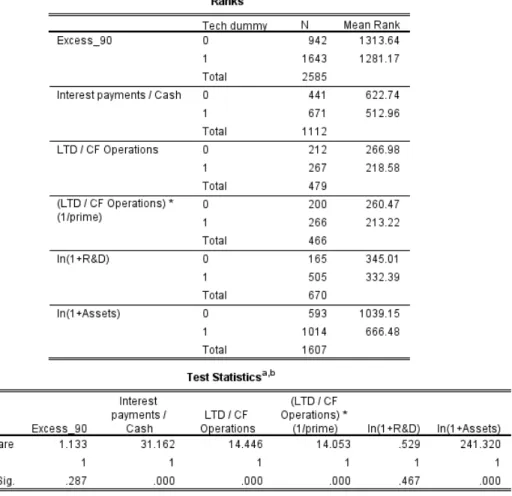
The following section describes the results of the test of normality, the Kruskal Wallis test to test for differences between the ratios of tech- and non-tech firms, correlation coefficients between the ratios and Excess returns after 90 days, and finally the regression. Figure 9 shows the descriptive statistics of the excess returns and the ratios. What is striking is the large
difference between the groups’ average means of LTD / CF operations, and ln(Assets). Less
striking but still counterintuitive is the severe difference between means of tech- and non-tech firms, or the fact that the mean of expenses on research and development expressed by ln(R&D) is higher for non-tech firms than for tech firms. As it might be valuable to understand whether the groups actually have different means I need to determine whether the data follows the normal distribution. For that reason I include a Shapiro Wilk test of normality in shows that only the variable ln(1+Assets) follows a normal distribution. However, since combined set of ln(1+Assets) does not follow the normal distribution, this finding is ignored and it is assumed that all variables follow a non-normal distribution as is
26
the stylized case with financial data. To shed some more light on the actual differences between the groups, I run a Kruskal Wallis test. As the null-hypothesis of the Kruskal Wallis
implies that there are no differences between the group’s means, I can conclude that there is
a statistically significant difference between the groups’ mean Excess return, and the natural
logarithm of R&D expenses. Because of the statistically significant difference between the means, it pays off to check whether the different characteristics of tech- and non-tech firms also influence the correlations.
27
28
29
As I conclude from table 11, splitting the dataset into two groups in an attempt to control for
differences in between the groups’ means does not help in achieving more statistically
significant variables of the expected sign. For that reason, I return to an analysis of the correlation coefficients that are shown in table 12 as a larger dataset might return more significant values. Where Platt (1995) finds a significant and positive relationship for the ratios of interest rate over cash, and long-term debt over cash flow from operations, I find no significant relationship. However, the variables ln(Assets) and long-term debt in combination with the prime rate, show a significant relationship with the correct sign. The implication of the positive correlation between the excess returns and the ratio of long-term debt over cash flow in combination with the inverse of the prime interest rate might need some clarification. The inclusion of the inverse prime rate, allows for testing the influence of the prime rate on the implications of debt. When prime rate levels are above eleven percent, Platt observes that an increasing long-term debt over cash flow ratio increases the probability of failure of the
ith company. For prime interest rate levels lower than eleven percent, the effects are reversed.
“Another way to view this is that as a result of the interdependency between indebtedness
and cash flow, there is a window of opportunity for IPOs to acquire low-cost debt. Those
who miss the window may end up capital short and more likely to fail.” (Platt, 1995).
30
The influence of time between the announcement of the IPO and the initial offering
date on aftermarket performance
Just like Plotnicki & Szyszka (2014) I find statistically negative correlations between the returns for all periods prior to the announcement date and the length of the cooling-off period. Table 13 shows that the correlations between the market’s returns thirty and sixty days prior to the pricing date and the length of the cooling-off period are statistically insignificant. This confirms the idea that managers base their decision on the duration of the IPO process before the actual start of the IPO process, and that managers indeed tend to shorten the IPO process during bullish market conditions, and delay the IPO during bearish conditions. The 90 day return before pricing shows a significant negative coefficient. However, as the median of the cooling-off period of this dataset is 78 days, it is possible that the significant correlation is polluted by overlapping time periods. For that reason, I will disregard the coefficient and assume that only the returns prior to the announcement date have a significant correlation.
31
32
Table 14: Shows the statistically significant negative relationship between the cooling-off period and the market return 90 days prior to the IPOs announcement
33
Table 16: The Wilcoxon Rank sum test shows that the mean rank of excess returns after 90 trading days is indeed for firms with faster IPOs
Until now, the only factor that shows significant explanatory power to forecast the excess returns over the holding period over 89 days was the duration of the cooling-off period. With the inclusion of the findings from Krigman, Shaw & Womack, (1999) - who argue that the excess returns over the holding period of one year can be determined by the returns of the first day of trading – I expect to include one more extra variable to the regression.
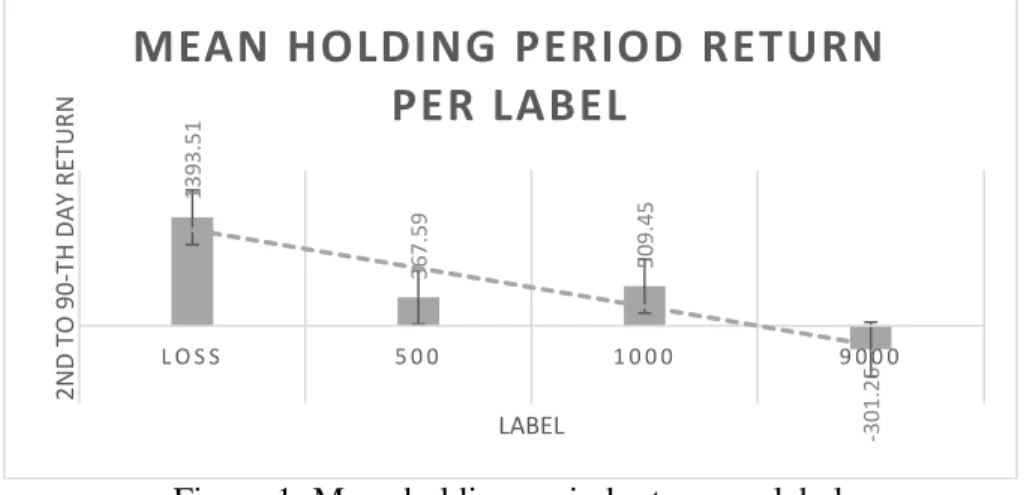
Figure 1: Mean holding period return per label.
Figure 1 shows the mean holding period return per label. In contrast to Krigman, Shaw & Womack who find that IPOs which incur losses on the first day of trading will generally
1393. 51 367. 59 509. 45 -301. 26
L O S S 5 0 0 1 0 0 0 9 0 0 0
2N D T O 90 -T H DA Y R E T URN LABEL
M EA N H O L D I N G P E R I O D R E T U R N
34
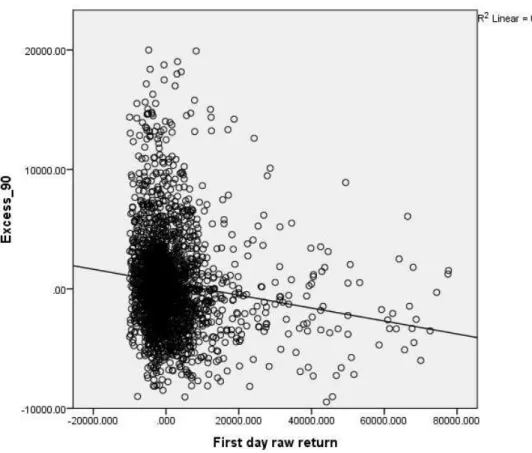
show negative mean returns for the rest of the holding period, I find that the mean long-term return of the stocks that incurred a loss on the first day of trading is positive. Because Krigman, Shaw & Womack also argue that their findings are robust for other labelling ranges, I regressed the frist-day returns against the main holding period returns. It shows that the excess returns over 90 days are negatively correlated to the mean holding period returns. Figure 2 shows a scatterplot with the first raw returns plotted on the x-axis and the excess return over the holding period on the y-axis. Even though the fit of the line though re residuals is not even two percent, I will add first day raw returns to the regression as a independent variable.
35
THE HOLISTIC REGRESSION
In my opinion it is at the very least disappointing to find that only three variables taken from previous research have some explanatory capability. The variables that have shown to be capable of explaining the values are: the duration of the cooling-off period, the dummy
variable ‘Fast_IPO’ and the raw returns earned on the first day of public trading. The final
table (figure 17) in this research shows the output of a regression that was constructed using the stepwise method. In model 1, FAST-IPO is the only variable that was included in the regression. The implication of the model is rather simple as the only predictor is a dummy variable. In cases where a firm’sIPO process is faster than the median IPO, the firm’s mean return over the period one day after the public offering date until the ninetieth trading day will increase by 1686 percentage points. With an R Square of 0.036, the model can explain 3.6 percent of the residuals.
Model two has 3 percent more explanatory power. In the case of this model, in addition to the ‘Fast_IPO’ dummy variable, the returns over the 90 day holding period are now also explained by the model. It implies that an increase in the first-day raw return of one basis point will decrease the excess returns over the 90 day period by 0.081 basis points.
𝐸𝑥𝑐𝑒𝑠𝑠 𝑟𝑒𝑡𝑢𝑟𝑛𝑡𝐼𝑃𝑂+90
36
37
CONCLUSIONS
This research has attempted to forecast the returns on a holding period of IPO stock. The holding period ranges from the 90th trading day to thee stock’s debut on the exchange which started. Regarding the influence of the company’s age-at-IPO on aftermarket performance, I found no significant relationships that could forecast the excess returns. This finding was robust after controlling for the type of firm and the different time periods.
With respect to the influence of accounting based measures on aftermarket performance, even though the output correlation matrices suggested small but significant relationships between the accounting measures and the excess return, not one of the variables shows explanatory power. As opposed to Platt (1995) who finds no relationship between the prime rate and the ratio of cash flow from operations over long-term debt, I find that the prime rate has a positive correlation with the cash flow of from operations over long-term debt.
After having confirmed the influence of the return on the S&P500 index on the duration of the IPO process, I found a positive relationship between the speed of the IPO and post-IPO
performance. The dummy variable “Fast_IPO” is also included in the final regression.
38
BIBLIOGRAPHY
Baron. (1982). A Model of the Demand for Investment Banking Advising and Distribution Services for New Issues. The Journal of Finance, 37(4), 955-976.
Chen, H., Fok, R., & Kang, S. (2010). Issuers’ incentives and tests of Baron’s model of IPO
underpricing. Review of Quantitative Finance and Accounting, 35(1), 71-87. Choi, S. F., & Pritchard, A. C. (2004). Should Issuers Be on the Hook for Laddering-An
Empirical Analysis of the IPO Market Manipulation Litigation. U. Cin. L. Rev., 73, 179.
Clark, D. T. (2002). A Study of the Relationship Between Firm Age‐at‐IPO and
Aftermarket Stock Performance. Financial Markets, Institutions & Instruments, 11(4), 385-400.
Demers, E., & Joos, P. (2007). IPO failure risk. Journal of Accounting Research, 45(2), 333-371.
Ferreira, D., Manso, G., & Silva, A. C. (2012). Incentives to innovate and the decision to go public or private. Review of Financial Studies. doi:10.1093/rfs/hhs070
Field, L. C., & Karpoff, J. (2002). Takeover Defenses of IPO Firms. Journal of Finance, 57(5), 1857-1889.
Hao, Q. (2007). Laddering in initial public offerings. Journal of Financial Economics, 85(1), 102-122.
Jovanovic, B., & Rousseau, P. L. (2001). Why Wait? A Century of Life Before IPO. NBER
Working Paper No. 8081.
Kahneman, D., & Tversky, A. (1979). Prospect theory: An analysis of decision under risk.
Econometrica, 263-292.
Krigman, L., Shaw, W., & Womack, K. (1999). The Persistence of IPO Mispricing and the Predictive Power of Flipping. The Journal of Finance, 54(3), 1015-1044.
Loughran, T., & Ritter, J. R. (2004). Why has IPO underpricing changed over time?
Financial management, 33(3).
Lowry, M., & Shu, S. (2002). Litigation risk and IPO underpricing. Journal of Financial
Economics, 65(3), 309-335.
Mohan, N., & Chen, C. (2000). Information content of lock-up provisions in initial public offerings. International review of economics & finance, 41-59.
39
Pagano, M., Panetta, F., & Zingales, L. (1998). Why do companies go public? An empirical analysis. Journal of Finance, 53, 27-64.
Platt, H. D. (1995). A note on identifying likely IPO bankruptcies: A symphonic paradox.
Journal of Accounting, Auditing & Finance, 10(1), 71-79.
Plotnicki, M., & Szyszka, A. (2014). The evidence of the disposition effect among corporate managers. Global Finance Journal, 25(1), 48-55.
Ritter, J. R. (2014, 12 12). IPO Data. Retrieved from Bear Warrington: http://bear.warrington.ufl.edu/ritter/FoundingDates.htm
Schuster, J. (1996). Underpricing and Crises-IPO Performance in Germany. Financial
Markets Group, No. dp252.
40
APPENDIX
Financial and Economic Variables Analyzed and Ratios Tested
Variables Abbreviation Ratios tested
Balance Sheet Items:
Cash Plus Marketable Securities CASH INT/CASH LTD/CASH Inventories INV INV/CF INV/CASH Current Assets CA LTD/CF LTD + INV/CF Current Liabilities CL (LTD/CF)*(1/PR) INV/CA
Total Assets TA CA/TA CA/LTD Net Plant NP LTD/OY INT/OY Long-term Debt LTD %GNP PR Common Equity CE CF*(1+%GNP)
INT/CASH * (1/PR)
Income Statement Items: DA/CASH NP/CASH
Operating income OY INV + CASH/CF INV/LTD Depreciation and Amortization DA LTD/INT LTD/CE Interest Expense INT CA/CL CA - INV/CL
Cash Flow CF CA/CE CA/OY
DA/OY OY/%GNP
Economic Factors: INV/CF * (1/PR) OY/PR
Prime Rate (on day of IPO) PR LTD/%GNP Percentage Change in GNP %GNP
Source: Platt (1995) Table 1
Ratios tested in holistic model indicated in blue
![Table 2: Descriptive Statistics [all firms]](https://thumb-eu.123doks.com/thumbv2/123dok_br/15741884.636386/21.918.219.701.382.473/table-descriptive-statistics-all-firms.webp)