DESALINATION
ELSEVIER Desalination 137 (2001) 23-29
www.elsevieccomAocate/desal
Solar thermal desalination system with heat recovery
Klemens Schwarzer*, Maria Eug&ia Vieira, Christian Faber, Christoph Miiller
Fachhochschule Aachen, Solar Institute Jiilich, Heinrich-Mussmann-& $0-52428 GermanyTel. +49 (2461) 993520; Fax +49 (2461) 993470; email: [email protected]
Received 27 July 2000; accepted 17 August 2000 zyxwvutsrqponmlkjihgfedcbaZYXWVUTSRQPONMLKJIHGFEDCBA
Abstract
This work presents the energy and mass balance equations, the numerical simulation results for the production rate, and the experimental laboratory water tests for a thermal desalination unit with a heat recovery system. The system components are a solar collector and a desalination tower, although the system can be operated with other energy sources. The desalination tower is made of six stages and a water circulation system through the stages to avoid salt concentration. The numerical results calculated using ambient data show that the production rate can reach 25 L/m?d, which is by a factor of five times greater than the rate of a basin-type solar desalination unit. The water (polluted seawater and well water) laboratory tests results show that the desalination process eliminated the Co&&m group bacteria and reduced the salt concentration to very low levels.
Keywords: Desalination; Solar; Heat recovery
1. Introduction
The shortage of drinkable water in marry areas of the world is au old problem. In addition, these areas also have a limited supply of conventional energy, although some have a great potential in solar energy.
Solar thermal systems that produce potable water from salty water have been studied for
quite some years, and the use of solar energy to produce potable water reverts back to ancient Egypt. Various solar thermal systems have been presented in the literature [l]. The most studied model, the still-type distiller, has the advantage of low installation cost, but two important disadvantages: low efficiency and problems associated with the accumulation of salt at the basin.
*Corresponding author.
A new solar thermal desalination system with heat recovery is presented in Fig. 1. Because of
Presented at the conference on Desalination Strategies in South Mediterranean Countries, Cooperation between Mediterranean Countries of Europe and the Southern Rim of the Mediterranean, sponsored by the European Desalination Society and Ecole Nationale d ‘Ingenieurs de Tunis, September 11-13, 2000, Jerba, Tunisia.
24 K. Schwarzer et al. /Desalination 137 (2001) 23-29
Fig. 1. Photo of the desalination system powered by solar collectors.
the heat recovery process, this unit can reach a higher thermal performance than the conven- tional still-type solar distiller. Also, there is a continuous water flow through the stages of the unit avoiding salt accumulation. The disadvan- tage is the higher installation cost when compared to the still-type unit.
The two basic system components are a flat- plate collector and a desalination tower. A copper piping system connects these two components. As solar radiation hits the collector, the working fluid (an oil) is heated up and moves, by natural convection, to the highest point of the system where a heat exchanger is located. The oil flow releases its sensible heat to the salty water on the other side of the equipment. The heat exchanger works as the first stage of the desalination unit. As the oil flow cools, it returns to the solar collector, completing a thermal siphon circuit. The warmed water in the heat exchanger transfers energy by evaporation, radiation, and convection with the second stage of the desalination unit and loses also some energy to the environment. The vapor from the first stage condenses at the bottom wall of the second stage, releasing its latent heat. The condensed water moves through a channel to be collected outside the unit. The
energy that is transferred to the second stage warms up the salty water in this stage and the heat recovery process is repeated in the next stages.
The purpose of this work is to present the energy balance equations for the thermal desali- nation processes, the numerical simulation results for the clean water production, and some experimental results with a unit operating with one stage. The system is powered by solar energy and installed on the northeast coast of Brazil. The water chemical test results for two types of water (polluted seawater and well water) before and after the desalination process indicate the good quality of the water produced.
2. zyxwvutsrqponmlkjihgfedcbaZYXWVUTSRQPONMLKJIHGFEDCBAEnergy balance equations
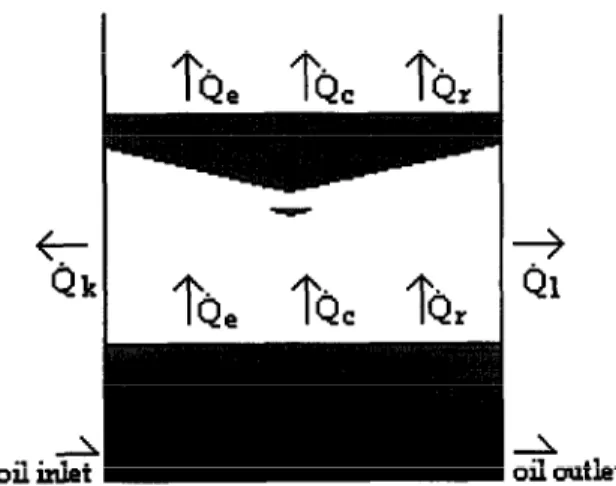
In the first stage of the solar desalination unit, heated oil from the solar collector enters a heat exchanger and transfers its sensible energy to the salty water mixture on the other side before returning to the solar collector. The salty water increases its temperature and exchanges heat with the second stage by evaporation, convection, and radiation. Some energy is lost to the environment by conduction through the vertical walls and some vapor leakage occurs. Sensible energy is also lost to the environment due to the interior circulation, not only to avoid salt accumulation in the first stage, but also to keep the water level in each stage constant. This latest energy loss can, however, be recovered in other process. Fig. 2 shows a schematic drawing of these energy transfers in the first stage.
The energy balance equations for the oil and the salty water in the heat exchangers are
- kA(T,- T,,,)
K. Schwarzer et al. /Desalination 13 7 (2001) 23-29 25
+ Ql
23
oil inlet
-L
oil mltlat
Fig. 2. Directions of the energy transfer in the heat exchanger: first stage.
kA (F. - Fw) - h,A (Tl - T,) (*I
For the other stages, the energy balance equation has the same form as Eq. (2), except that the energy that enters the system is by conden- sation, convection, and radiation from the stage below, instead of convection from the oil flow.
The mass balance equation represents the steady-state condition in each stage. It states that the amount of water in each tray remains constant, as the amount of water that enters equals the amount that leaves the stage:
In order to model the performance of the solar thermal desalination unit, a good knowledge of the rate of heat transfer from the water surface at
each stage is necessary. Although solar thermal desalination systems have been published in the literature, two important limitations are present. First, there is some confusion about the convec- tion and evaporation heat transfer coeffkient for solar desalination applications. Even though the convection heat transfer rate is much smaller than the evaporation rate, this convection coefficient has been used to estimate the evaporation heat transfer coefftcient. Some papers have been published in the literature [2-5). Each of these studies seems to be appropriate for its experimen- tal data at some temperature range, particularly in the interval from 50°C to 70°C where the solar tank distiller operates. Second, the experimental results for the system presented in Fig. 1 show that the water temperature in the first stages can reach values greater than 90°C and the correla- tion expressions available are not adequate to predict the evaporated mass rate.
A one-stage desalination unit was built to study the evaporation and convection heat transfer processes at temperatures ranging from 50°C to boiling. This temperature range represents the practical situation found in the unit of Fig. 1. The evaporation and condensation temperatures are controlled using external electri- cal heat sources and a digital scale measures the water rate leaving the unit. The upper plate is tilted at 14” with the horizontal plane. The experimental data are used to find the constants to be used in the Colburn analogy to estimate the rate of water produced by the desalination process. The number of measured data points used in the correlation expressions is 379.
3. zyxwvutsrqponmlkjihgfedcbaZYXWVUTSRQPONMLKJIHGFEDCBAExperimental results and discussion
26 K. Schwarzer et al. / Desalination I3 7 (2001) 23-29
1200 31
30 loo0
29
600 26
“E 27 0
2 600 26 ’
400 25
24 200
-solar zyxwvutsrqponmlkjihgfedcbaZYXWVUTSRQPONMLKJIHGFEDCBAradiation -ambient temperature 23
0 22
09:41 IO:27 II:13 1159 12:45 13:32 14:16 1504 1550 16:36
hour
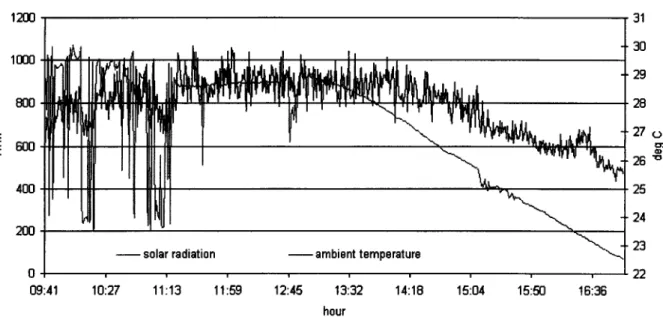
Fig. 3. Measured global solar radiation and ambient temperature data used in the simulation.
Liter II zyxwvutsrqponmlkjihgfedcbaZYXWVUTSRQPONMLKJIHGFEDCBAs-mbl
1.8
1.6
1.4
1.2
1
0.8
0.6
0.4 0.2
0
IO:30 13:lS 1690 18145 21:30 0:lS 300 5145 830
Fig. 4. Clean water production in liters by the desalination unit in 15min intervals.
K. Schwarzer et al. /Desalination zyxwvutsrqponmlkjihgfedcbaZYXWVUTSRQPONMLKJIHGFEDCBAI3 7 (2001) 23-29 27
Liter
60
19:m 21:15 2330 1145 4100 6:15 a:30
hour
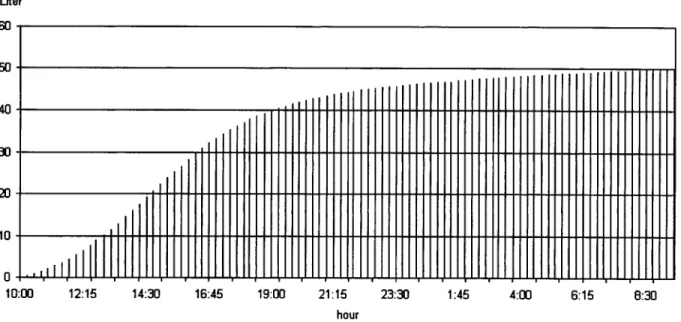
Fig. 5. Accumulated water production rate in one day, using a 2mz solar collector area.
Table 1
Results of the water laboratory tests before and after the desalination process
Item measured
Total coliform group bacteria, NMP/lOO mL
Fecal coliform group bacteria, NMP/lOO mL
pH, 25°C
Color, uH
Turbidity, NTU
Alkalinity, mg (CaCO&)
Total hardness, mg (CaCO&)
Chloride content, mg (Cl-/L)
Conductivity, @/cm
Polluted seawater
Before After
>2419.20 *
2419.17 *
7.95 4.72
36 4
7.2 0.48
114 *
4400 4
16,500 5
53,400 56.3
Well water
Before After
3.1 *
2.05 +
5.74 5.71
2 1
0.73 0.59
4 4
170 6
235 9
1072 36
28 K. Schwarzer et al. /Desalination 137 (2001) 23-29
shows the measured global solar radiation and ambient temperature used in the numerical simulation. The integrated value of the global solar radiation for this day is 4.8 kWh/m*.
Fig. 4 shows the amount of water produced in liters at the end of each 15min interval. This water production represents the sum of all stages, that is, the total water amount of water collected at the end of the time interval. From the graph it is seen that the highest amount of clean water produced by the unit per time interval occurs at 2:30 pm for this day.
Fig. 5 shows the accumulated clean water production vs. the hour of the day. Each value represents the amount of clean water that has been produced by all stages from the start of the day up to the end of the specific time interval. It is seen that 50.2 L are collected at the end of the day. This represents a rate of 25 L/m* for a value of 4.8 kWh/m*/d of solar radiation, according to a rate of 5.2 L/kWh m*.
To study the quality of the water produced by the desalination unit, the first stage is tested and the two different types of water are analyzed before and after the process. Table 1 presents the conditions of the water before and after the desalination process.
4. zyxwvutsrqponmlkjihgfedcbaZYXWVUTSRQPONMLKJIHGFEDCBAConclusions
The solar desalination unit can reach very good thermal performance, as shown by the numerical simulation, when well built. The results show that it can reach a water production rate of 25 L/m*/d for a value of 4.8kWh/mz/d of solar radiation. This represents a rate of 5.2 L/kWh m* and a factor of five to six times greater than the tank-type distiller. The problem of salt concentration has been taken into consideration through the continuous water flow through the unit.
The laboratory tests presented in Table 1 for very polluted seawater and for well water show
that the desalination process eliminated the total coliform group bacteria and the coliform group fecal bacteria to such low levels that they could not be detected by the instrument. The physical- chemical analysis also shows a significant reduc- tion in all items tested.
5. Symbols
A -
CP -
h -
k -
A4 -
F?i - zyxwvutsrqponmlkjihgfedcbaZYXWVUTSRQPONMLKJIHGFEDCBA
Q
-
F
-_
T -
t -
Greek
; 1
0 -
Subscripts C circ 5;, in k I
leak zyxwvutsrqponmlkjihgfedcbaZYXWVUTSRQPONMLKJIHGFEDCBA
0
out
r
W
- Convection - Circulation - Evaporation - Heat exchanger - Inlet
- Conduction
- Loss
- Leakage
- Oil
- Outlet - Radiation
- Water
Area, m*
Specific heat at constant pressure, J/kg K
Heat transfer coefficient, W/m* K Overall heat transfer coefficient, W/m* K
Mass, kg Mass rate, kg/s
Rate of energy transfer, W Average temperature, K Temperature, K
Time, s
Emissivity
Thermal conductivity
K. Schwarzer et al. /Desalination 13 7 (2001) 23-29 29 zyxwvutsrqponmlkjihgfedcbaZYXWVUTSRQPONMLKJIHGFEDCBA
References [3] R.V. Dunkle, Intl. HeatTransfer Conf., 5 (1961) 895.
[l] G.O.G.Lof,J.A.ElblingandJ.W.Bloemer,AICheJ., 7 (l%l) 641.
[2] J.A. Clark, Solar Energy, 44 (1960) 43.
[4] R.S. Adhikari, A. Kumar and A. Kumar, Intl. Solar Energy Rea., 14 (1990) 737.