CLINICAL SCIENCE
Pulse pressure variation and prediction of fluid
responsiveness in patients ventilated with low tidal
volumes
Clarice Daniele Alves de Oliveira-Costa,I,IIGilberto Friedman,I,II,IIISı´lvia Regina Rios Vieira,I Le´a FialkowI IUniversidade Federal do Rio Grande do Sul, Hospital de Clı´nicas de Porto Alegre, Department of Intensive Care Medicine, Porto Alegre/RS, Brazil. IIComplexo Hospitalar Santa Casa de Porto Alegre, Porto Alegre/RS, Brazil.IIIHospital de Clı´nicas de Porto Alegre, Porto Alegre/RS, Brazil.
OBJECTIVE: To determine the utility of pulse pressure variation (DRESPPP) in predicting fluid responsiveness in
patients ventilated with low tidal volumes (VT) and to investigate whether a lowerDRESPPP cut-off value should be
used when patients are ventilated with low tidal volumes.
METHOD:This cross-sectional observational study included 37 critically ill patients with acute circulatory failure who required fluid challenge. The patients were sedated and mechanically ventilated with a VTof 6-7 ml/kg ideal body
weight, which was monitored with a pulmonary artery catheter and an arterial line. The mechanical ventilation and hemodynamic parameters, including DRESPPP, were measured before and after fluid challenge with 1,000 ml
crystalloids or 500 ml colloids. Fluid responsiveness was defined as an increase in the cardiac index of at least 15%. ClinicalTrial.gov: NCT01569308.
RESULTS: A total of 17 patients were classified as responders. Analysis of the area under the ROC curve (AUC) showed that the optimal cut-off point forDRESPPP to predict fluid responsiveness was 10% (AUC = 0.74). Adjustment
of theDRESPPP to account for driving pressure did not improve the accuracy (AUC = 0.76). ADRESPPP$10% was a
better predictor of fluid responsiveness than central venous pressure (AUC = 0.57) or pulmonary wedge pressure (AUC = 051). Of the 37 patients, 25 were in septic shock. The AUC for DRESPPP$10% to predict responsiveness in
patients with septic shock was 0.84 (sensitivity, 78%; specificity, 93%).
CONCLUSION: The parameter DRESPPP has limited value in predicting fluid responsiveness in patients who are
ventilated with low tidal volumes, but a DRESPPP.10% is a significant improvement over static parameters. A
DRESPPP$10% may be particularly useful for identifying responders in patients with septic shock.
KEYWORDS: Cardiac Output; Pulse Pressure Variation; Fluid Responsiveness; Low Tidal Volume.
Oliveira-Costa CD, Friedman G, Vieira SRR, Fialkow L. Pulse pressure variation and prediction of fluid responsiveness in patients ventilated with low tidal volumes. Clinics. 2012;67(7):773-778.
Received for publication onJanuary 12, 2012;First review completed onFebruary 5, 2012;Accepted for publication onMarch 25, 2012 E-mail: beto_gremio@hotmail.com
Tel.: 55-51-3359-8223
INTRODUCTION
Volume expansion is frequently used to treat critically ill patients with acute circulatory failure. The goal of volume expansion is to increase the left ventricular stroke volume, which consequently increases the cardiac output (1,2) However, only approximately 50% of patients with acute circulatory failure will respond to a fluid challenge (preload-dependent patients) (3). Therefore, the ability to predict fluid responsiveness in critically ill patients is crucial, particularly in patients with acute respiratory distress syndrome (ARDS) due to increased alveolar-capillary membrane permeability
(4). Avoiding unnecessary fluid loading has been shown to have a positive effect on patient outcomes (5,6).
Pulse pressure variation (DRESPPP) is one of the most
accurate dynamic parameters used at the bedside to identify fluid responsiveness in patients with acute circulatory failure who are undergoing invasive mechanical ventilation (3,7). However, most studies have evaluated patients ventilated with large tidal volumes ($8 ml/kg). The validity ofDRESPPP
in identifying fluid responsiveness is still under debate when using lower tidal volumes (7-12).
In preload-dependent patients on mechanical ventilation, DRESPPP is primarily the result of an inspiratory decrease in
the right ventricular (RV) preload secondary to an increase in the pleural pressure, which is affected by the tidal volume (13). Cyclic changes in the stroke volume are due to pleural and intrathoracic pressure variations in this group of patients (8,14). In patients ventilated with low tidal volumes, the variation in lung volume and airway pressure may not be sufficient to significantly change the pleural
Copyrightß2012CLINICS– This is an Open Access article distributed under
the terms of the Creative Commons Attribution Non-Commercial License (http:// creativecommons.org/licenses/by-nc/3.0/) which permits unrestricted non-commercial use, distribution, and reproduction in any medium, provided the original work is properly cited.
pressure, venous return or ventricular filling (15,16). Adjusting theDRESPPP to account for the driving pressure
(DP, the difference between the plateau pressure and positive end expiratory pressures) could be useful in identifying responders with aDRESPPP,13% (9). However,
the adjustment ofDRESPPP based on the DP was shown to
be as inaccurate as DRESPPP alone in patients who were
ventilated with a VT,8 ml/kg IBW (8). In lungs with
normal compliance values, low tidal volumes induce small variations in the DP, particularly when the DP#20 cm H2O
(9).
The parameterDRESPPP may be useful in guiding fluid
therapy following lung injuries, but several physiological mechanisms may limit its validity. The current literature regarding the effects ofDRESPPP during ventilation with low
tidal volumes is unclear, and conflicting conclusions have been reported (10,12). The present study was designed to determine the value ofDRESPPP in predicting fluid
respon-siveness in patients ventilated with low tidal volumes and investigate whether a lowerDRESPPP cut-off point should be
used when patients are ventilated with low tidal volumes.
MATERIALS AND METHODS
This cross-sectional observational study included patients admitted to the Intensive Care Unit at the Hospital das Clı´nicas de Porto Alegre (HCPA) who required fluid challenge (FC). The study was approved by the HCPA Research Ethics Committee. Informed consent was waived because no interventions were performed on the patients.
Patients
A total of 38 patients admitted to the HCPA ICU who received invasive mechanical ventilation between May 2006 and October 2009 were included. The following inclusion criteria were used: i) age$16 years; ii) hemodynamic instability, defined as the need for norepinephrine infusion and/or intravascular fluid administration to maintain systolic arterial blood pressure.90 mmHg; iii) arterial line in place (radial or femoral); and iv) pulmonary arterial catheter in place. The exclusion criteria were the presence of cardiac arrhythmia, pneumothorax, heart valve disease or intracardiac shunt and previously diagnosed right ventri-cular insufficiency. The patients were scheduled to undergo FC with colloid or crystalloid solutions as prescribed by the attending physician.
Study Protocol
The patients were sedated with midazolan and fentanil (scores of -4 to -5 in the Richmond Agitation Sedation Scale) (17) and ventilated in a controlled pressure or controlled volume mode (Servo I system v.12 or Servo 900 C, Siemens, Sweden) with a VT,8 ml/kg IBW (51+0.9 [height in
cm-152.9] for men and 45.5 + 0.91 [height in cm- 152.9] for women) (7). The ventilatory and hemodynamic variables were measured before and after FC with the patients in a supine position. Zero pressure was measured at the midaxillary line. The correct position of the pulmonary artery catheter in West’s zone 3 was confirmed as described in the literature (18).
Fluid challenge was performed with 1000 ml 0.9% saline solution or lactated Ringer’s solution (n = 36) or 500 ml 6% hydroxy-ethyl-starch solution 130/0.4 for 30 minutes (n = 2).
Hemodynamic Parameters
Variations in the arterial pulse pressure were visualized on bedside monitors (HP S66 and PHILIPS IntelliVue, MP60, Germany) and measured with the cursor for five breathing cycles. The DRESPPP was calculated using the
following equation:
DRESPPPð Þ% ~100x PPmax PPminð Þ=½ðPPmaxzPPminÞ=2
where PPmax and PPmin are the maximal pulse pressure at inspiration and expiration, respectively (1).
A pulmonary arterial catheter (Edwards Healthcare, Irvine, CA) was used to measure the cardiac output according to the thermal dilution method (three injections of a 10 ml 0.9% saline solution); the systolic, diastolic and mean pulmonary arterial pressures; the pulmonary artery occlusion pressure (PAOP, mmHg); the central venous pressure (CVP, mmHg); and the mixed venous saturation (SvO2). The mean arterial pressure (MAP, mmHg), which
was measured using the arterial line and heart rate (HR, bpm), was also recorded. All of the measurements were recorded at the end of expiration before and after FC. Patients were defined as fluid responders if the cardiac index increased by at least 15% relative to the baseline.
Ventilation Parameters
The following ventilatory parameters were measured: inspiratory and expiratory tidal volumes, respiratory rate (RR), plateau pressure (Pplat, cmH2O), peak pressure
(Ppeak, cmH2O), total positive end-expiratory pressure
(PEEPtot), static compliance (Cst) and driving pressure (DP = Pplat-PEEP). All of the measurements were recorded before and after FC.
Statistical Analysis
The sample size was defined as 38 patients to estimate the correlation between CI andDRESPPP 0.5 (moderate to high
magnitude), with a level of significance of 0.05 and a power of 90%.
The effects of FC on the hemodynamic parameters were assessed using the paired Student’s t-test for normally distributed variables or the nonparametric Wilcoxon Signed Rank test for non-normally distributed variables. The hemodynamic parameters between both groups at baseline
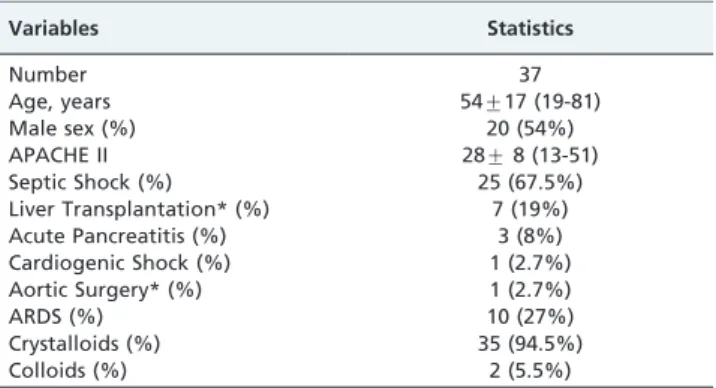
Table 1 -Patient Characteristics.
Variables Statistics
Number 37
Age, years 54¡17 (19-81)
Male sex (%) 20 (54%)
APACHE II 28¡8 (13-51)
Septic Shock (%) 25 (67.5%)
Liver Transplantation* (%) 7 (19%)
Acute Pancreatitis (%) 3 (8%)
Cardiogenic Shock (%) 1 (2.7%)
Aortic Surgery* (%) 1 (2.7%)
ARDS (%) 10 (27%)
Crystalloids (%) 35 (94.5%)
Colloids (%) 2 (5.5%)
Mean¡standard deviation (minimum and maximum) or percentage.
*Immediate post-operative state.
and after FC were compared using the two-sample Student’st-test or the nonparametric Mann-Whitney U test. The results were expressed as the means¡SD or the
medians (25-75th percentiles).
Receiver operating characteristic (ROC) curves were constructed to evaluate the ability ofDRESPPP,DRESPPP/DP,
CVP and PAOP to predict fluid responsiveness. The optimal cut-off value for theDRESPPP ROC curve was determined for
the study cohort. The following measures of diagnostic performance were calculated: sensitivity, specificity, predic-tive values and likelihood ratios. Linear correlations were tested using the Spearman rank method. The data were analyzed using SPSS 15.0. Ap-value,0.05 was considered to be significant.
RESULTS
One of the 38 patients was excluded due to cardiore-spiratory arrest that occurred during the study. The general characteristics of the 37 patients are summarized in Table 1. Twenty-five of the patients (68%) were in septic shock, and 11 patients were in distributive shock as a result of various causes. None of the patients were in cardiogenic shock.
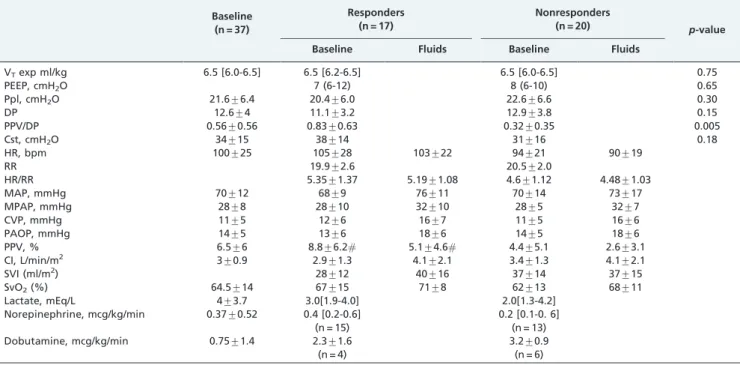
Table 2 shows the baseline hemodynamic and ventilation parameters and data for the responders (17 patients) and nonresponders (20 patients). There were no statistically significant differences between the responders and non-responders in terms of age (57¡16 vs. 53¡18 years) or
APACHE II scores (28¡05vs.28¡10).
Analysis of the study cohort revealed that the optimal DRESPPP cut-off value for identifying responders was 10%,
with an area under the ROC curve (AUC) equal to 0.74 (95% CI: 0.56-0.9; sensitivity, 53%; specificity, 95%; PPV, 90%; NPV, 70.4%; and positive and negative likelihood ratios of 9.4 and 0.34, respectively) (Figure 1). After adjusting the
DRESPPP for DP, similar results were obtained: AUC equal to
0.76; 95% 0.60-0.90; sensitivity, 47%; specificity, 95%; PPV, 89%; NPV, 68%; and positive and negative likelihood ratios Table 2 -The hemodynamic and ventilatory data of responders and nonresponders.
Baseline (n = 37)
Responders (n = 17)
Nonresponders (n = 20)
p-value
Baseline Fluids Baseline Fluids
VTexp ml/kg 6.5 [6.0-6.5] 6.5 [6.2-6.5] 6.5 [6.0-6.5] 0.75
PEEP, cmH2O 7 (6-12) 8 (6-10) 0.65
Ppl, cmH2O 21.6¡6.4 20.4¡6.0 22.6¡6.6 0.30
DP 12.6¡4 11.1¡3.2 12.9¡3.8 0.15
PPV/DP 0.56¡0.56 0.83¡0.63 0.32¡0.35 0.005
Cst, cmH2O 34¡15 38¡14 31¡16 0.18
HR, bpm 100¡25 105¡28 103¡22 94¡21 90¡19
RR 19.9¡2.6 20.5¡2.0
HR/RR 5.35¡1.37 5.19¡1.08 4.6¡1.12 4.48¡1.03
MAP, mmHg 70¡12 68¡9 76¡11 70¡14 73¡17
MPAP, mmHg 28¡8 28¡10 32¡10 28¡5 32¡7
CVP, mmHg 11¡5 12¡6 16¡7 11¡5 16¡6
PAOP, mmHg 14¡5 13¡6 18¡6 14¡5 18¡6
PPV, % 6.5¡6 8.8¡6.2# 5.1¡4.6# 4.4¡5.1 2.6¡3.1
CI, L/min/m2 3¡0.9 2.9¡1.3 4.1¡2.1 3.4¡1.3 4.1¡2.1
SVI (ml/m2) 28¡12 40¡16 37¡14 37¡15
SvO2(%) 64.5¡14 67¡15 71¡8 62¡13 68¡11
Lactate, mEq/L 4¡3.7 3.0[1.9-4.0] 2.0[1.3-4.2]
Norepinephrine, mcg/kg/min 0.37¡0.52 0.4 [0.2-0.6] (n = 15)
0.2 [0.1-0. 6] (n = 13)
Dobutamine, mcg/kg/min 0.75¡1.4 2.3¡1.6
(n = 4)
3.2¡0.9 (n = 6)
PEEP: end expiratory pressure; VTexp: expiratory tidal volume; Ppl: plateau pressure; PPV/DP: PPV/driving pressure index; Cst: static complacence; HR:
heart rate; MAP: mean arterial pressure; MPAP: mean pulmonary artery pressure; CVP: central venous pressure; PAOP: pulmonary artery occluded pressure; PPV: pulse pressure variation; CI: cardiac index; SvO2: O2mixed venous saturation; VP: vasopressor; IN: inotropic.
Figure 1 - Receiver operating characteristic (ROC) curves comparing pulse pressure variation (DRESPPP),DRESPPP adjusted
to driving pressure (DRESPPP/DP), central venous pressure (ROC
area: 0.57 [0.38-0.76]) and pulmonary artery occlusion pressure (ROC area 0.51 [0.32-0.70]) to determine patient responses to volume expansion. The area under the curve for DRESPPP or
DRESPPP/DP is greater than that for the central venous pressure
of 9.4 and 0.56, respectively. TheDRESPPP andDRESPPP/DP
were more accurate than CVP and PAOP for identifying fluid responsiveness (Figure 1).
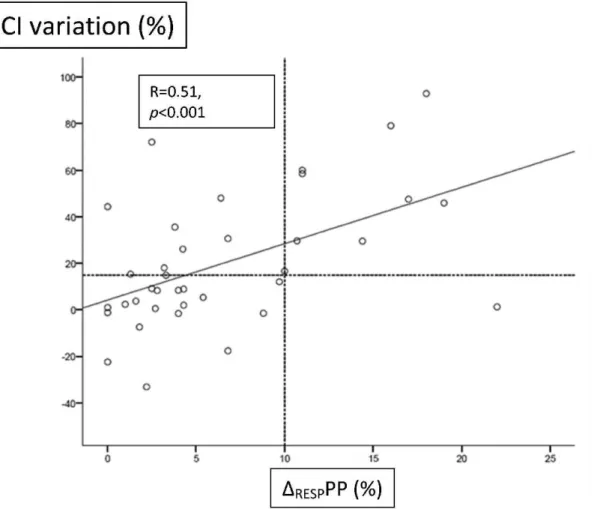
Figure 2 shows the relationship between theDRESPPP and
cardiac index variation. Of the ten patients with a DRESPPP$10%, nine were true responders. Twenty-seven
patients had a DRESPPP,10%, but only nineteen were
nonresponders. The other eight responders showed cardiac index variations of up to 75%. Of the responders, the DRESPPP/DP index was significantly lower in eight patients
with aDRESPPP,10% compared with nine patients with a
DRESPPP.10% (0.33¡0.24vs.1.31¡0.5;p,0.05).
Twenty-five patients were in septic shock (15 nonrespon-ders with a DRESPPP,10%, one nonresponder with a
DRESPPP$10%, seven responders with a DRESPPP$10%,
and two responders with a DRESPPP,10%). For the 10%
cut-off point, the AUC was 0.84, the sensitivity was 77.8%, the specificity was 93.3%, the PPV was 87.5%, and the NPV was 88.2%. The positive and negative likelihood ratios were 0.13 and 0.23, respectively (Figure 3).
DISCUSSION
The data in the present study support previous studies (7-10,12) by demonstrating that DRESPPP has limitations in
predicting fluid responsiveness in patients ventilated with low tidal volumes but is an improvement over conventional
static parameters. The primary finding of this study is that although theDRESPPP had a low sensitivity, almost half of
the responders had aDRESPPP,10%. With the exception of
one patient, all of the patients with a DRESPPP$10%
responded to FC, which indicates that this parameter is a useful variable for evaluating fluid responsiveness.
The mean baselineDRESPPP in this study was low (6.5%).
There are several explanations for this observation. First, the patients had already been resuscitated. Second, the patients were ventilated with a low VT(6.5 ml/kg). The use of low
VTs in patients with normal lung compliance scores or
ARDS induces less pronounced changes in blood pressure waveforms because cyclic variations in the pleural pressure are influenced by the magnitude of the tidal volume and, to a lesser extent, DP (1,7-10). As in previous studies, this phenomenon explains the lower cut-off value forDRESPPP in
patients ventilated with reduced tidal volumes, particularly when the DP#20 cmH2O (9). The mean DP in this study was
low (12.6¡4), and our attempts to adjust for DP (8) did not
increase the accuracy. We observed a greaterDRESPPP/DP
in the subgroup of responders and aDRESPPP.10%
com-pared with the patients with a DRESPPP,10%. In patients
with decreased lung compliance (acute lung injury/ARDS), the impact of the alveolar pressure on pleural pressure is even less pronounced and is not linear. The association between low tidal volumes and low alveolar compliance (high driving pressure) decreases the effect of positive Figure 2 -Linear correlation between the pulse pressure variation (DRESPPP) and cardiac index (CI) variation immediately after a fluid
pressure on venous return and myocardial contractility (19). Third, theDRESPPP depends on the RR and HR/RR ratios.
TheDRESPPP is insignificant in responders when this ratio is
below 3.6, as shown in De Backer et al. (20). Although the mean HR/RR ratio was lower in the nonresponders (p= NS), it was much higher than 3.6.
PEEP induces a decrease in the cardiac output due to the negative effect of increased pleural pressure on right ventricular filling and increased transpulmonary pressure on the right ventricular afterload in a hypovolemic state, which increases the pulse pressure variation (21). However, the pulse pressure variation results from a complex interaction between hemodynamic and ventilatory mechan-isms, including VT, PEEP levels, lung volume and lung
compliance (8). Cyclic changes in the pleural pressure are mostly determined by the magnitude of VT (13). In this
study, the effects of PEEP onDRESPPP appeared to be less
important because the mean PEEP levels were low (,10 cmH20). PEEP levels were similar between responders and
nonresponders.
Pulmonary artery hypertension and/or right ventricular dysfunction may also contribute to false positive cases when identifying responders (22,23). We did not evaluate signs of right ventricular failure, which can compromise the flow response to an FC. However, the mean pulmonary artery pressure was comparable to values observed in other studies in patients with ARDS (10,12).
Predicting fluid responsiveness is particularly important in patients with ARDS. There are few studies that have properly addressed this issue. Two studies reported AUCs similar to the results in this study with different DRESPPP
values. In 22 patients with ARDS, Huang et al. reported a cut-off point of 11.8% with a low sensitivity (68%), a high specificity (100%), and an AUC of 0.77 (10) using similar methods. Lakhal et al. recently evaluated 65 patients with ARDS after a fluid challenge to determine whether the CI increased by 10% (12) and reported a cut-off point of 5% with a sensitivity of 73% and specificity of 85%. The authors criticized Huang et al. interpretation that DRESPPP is a
reliable predictor of fluid responsiveness because they considered the lower bound of the AUC 95% confident interval to limit accuracy. The lower bound in the present study was only 0.51. Although we agree that the accuracy may be limited, we also agree with Huang et al. in that a high specificity is sufficient to justify the use ofDRESPPP at
the bedside. However, this study is different because we only studied ten patients with ARDS, and six were nonresponders with aDRESPPP,10%.
There were no significant differences in the hemodynamic parameters between the groups. It should be noted that 28 of the patients (75%) were being treated with norepinephr-ine, with similar proportions in both groups. The use of vasopressors does not appear to mask the hemodynamic impacts of mechanical ventilation (23).
Figure 3 -Receiver operating characteristic curve for pulse pressure variation (DRESPPP) in patients with septic shock ventilated with low
In the 25 patients with septic shock, the accuracy ofDRESPPP
to predict fluid responsiveness was even higher than in patients without septic shock. Seven responders (78%) with a DRESPPP$10% were in septic shock, which was similar to
the proportion of nonresponders with DRESPPP,10% (80%).
Although the disease heterogeneity in the group of responders with aDRESPPP,10% may partially explain whyDRESPPP did
not indicate an increase in stroke volume, the design of the present study precludes any conclusions regarding the role of physiological changes related to underlying diseases in DRESPPP and fluid responsiveness.
As suggested by this and previous studies (7-12), it is not possible to establish a single cut-off point forDRESPPP. The
interaction between the pleural and intrathoracic pressures and the cardiovascular system is highly complex and has not been completely elucidated. In addition, this interaction involves physiological aspects related to the underlying disease. LowDRESPPP in patients ventilated with low tidal
volumes is not a contraindication to fluid challenge, although the probability of response is greater when the DRESPPP is increased (with the exception of patients with
right ventricle insufficiency) (24).
This study has several limitations. We analyzed data from 37 patients instead of 38 as calculated. The heterogeneity of diagnoses precludes the generalization of our findings. Only ten of the patients had ARDS, and their mean plateau pressure was low and static compliance was preserved. Thus, the application of these results to the entire popula-tion of patients with ARDS is limited. Although the analysis of the subgroup of patients with septic shock may be an issue, this group of patients was less heterogeneous than the study cohort, and the use ofDRESPPP might be particularly
useful because these patients frequently present with acute lung injuries. Manual measurement of pulse pressure variation using a cursor has been previously employed (1), and there is not sufficient evidence that automatic measure-ment of pulse pressure variation is advantageous.
In conclusion, pulse pressure variation had limited value as a predictor of fluid responsiveness in patients ventilated with low tidal volumes. The most accurateDRESPPP cut-off
point to identify fluid responsiveness was$10%. Although a universal cut-off point may not be determined, a DRESPPP$10% can assist in identifying fluid responsiveness,
particularly in patients with septic shock.
ACKNOWLEDGMENTS
We would like to thank the Fundo de Incentivo a Pesquisa do HCPA (FIPE/HCPA) for financial support.
AUTHOR CONTRIBUTIONS
Oliveira-Costa CD was responsible for the project design, data collection and manuscript writing. Friedman G contributed to the project design, statistics, and manuscript writing. Fialkow L and Vieira SR contributed to the project design.
REFERENCES
1. Michard F, Boussat S, Chemla D, Anguel N, Mercat A, Lecarpentier Y, et al. Relation between respiratory changes in arterial pulse pressure and fluid responsiveness in septic patients with acute circulatory failure. Am J Respir Crit Care Med. 2000;162(1):134-8.
2. Michard F, Teboul JL. Using heart-lung interactions to assess fluid responsiveness during mechanical ventilation. Crit Care. 2000;4(5):282-9, http://dx.doi.org/10.1186/cc710.
3. Michard F, Teboul JL. Predicting fluid responsiveness in ICU patients: a critical analysis of the evidence. Chest. 2002;121(6):2000-8, http:// dx.doi.org/10.1378/chest.121.6.2000.
4. Reuter DA, Bayerlein J, Goepfert MS, Weis FC, Kilger E, Lamm P, et al. Influence of tidal volume on left ventricular stroke volume variation measured by pulse contour analysis in mechanically ventilated patients. Intensive Care Med. 2003;29(3):476-80.
5. Wiedemann HP, Wheeler AP, Bernard GR, Thompson BT, deBoisblanc B, Connors AF Jr, et al. Comparison of two fluid-management strategies in acute lung injury. N Engl J Med. 2006;354(24):2564-75.
6. Westphal GA, Silva E, Goncalves AR, Caldeira FM, Poli-de-Figueiredo LF. Pulse oximetry wave variation as a noninvasive tool to assess volume status in cardiac surgery. Clinics. 2009;64(4):337-43.
7. De Backer D, Heenen S, Piagnerelli M, Koch M, Vincent JL. Pulse pressure variations to predict fluid responsiveness: influence of tidal volume. Intensive Care Med. 2005;31(4):517-23, http://dx.doi.org/ 10.1007/s00134-005-2586-4.
8. Vallee F, Richard JC, Mari A, Gallas T, Arsac E, Verlaan OS, et al. Pulse pressure variations adjusted by alveolar driving pressure to assess fluid responsiveness. Intensive Care Med. 2009;35(6):1004-10, http:// dx.doi.org/10.1007/s00134-009-1478-4.
9. Muller L, Louart G, Bousquet PJ, Candela D, Zoric L, de La Coussaye JE, et al. The influence of the airway driving pressure on pulsed pressure variation as a predictor of fluid responsiveness. Intensive Care Med. 2010;36(3):496-503, http://dx.doi.org/10.1007/s00134-009-1686-y. 10. Huang CC, Fu JY, Hu HC, Kao KC, Chen NH, Hsieh MJ, et al. Prediction
of fluid responsiveness in acute respiratory distress syndrome patients ventilated with low tidal volume and high positive end-expiratory pressure. Crit Care Med. 2008;36(10):2810-6, http://dx.doi.org/10.1097/ CCM.0b013e318186b74e.
11. Kim HK, Pinsky MR. Effect of tidal volume, sampling duration, and cardiac contractility on pulse pressure and stroke volume variation during positive-pressure ventilation. Crit Care Med. 2008;36(10):2858-62, http://dx.doi.org/10.1097/CCM.0b013e3181865aea.
12. Lakhal K, Ehrmann S, Benzekri-Lefevre D, Runge I, Legras A, Dequin PF, et al. Respiratory pulse pressure variation fails to predict fluid responsiveness in acute respiratory distress syndrome. Crit Care. 2011;15(2):R85, http://dx.doi.org/10.1186/cc10083.
13. Romand JA, Shi W, Pinsky MR. Cardiopulmonary effects of positive pressure ventilation during acute lung injury. Chest. 1995;108(4):1041-8, http://dx.doi.org/10.1378/chest.108.4.1041.
14. Jardin F, Genevray B, Brun-Ney D, Bourdarias JP. Influence of lung and chest wall compliances on transmission of airway pressure to the pleural space in critically ill patients. Chest. 1985;88(5):653-8, http://dx.doi.org/ 10.1378/chest.88.5.653.
15. Feihl F, Broccard AF. Interactions between respiration and systemic hemo-dynamics. Part I: basic concepts. Intensive Care Med. 2009;35(1):45-54. 16. Feihl F, Broccard AF. Interactions between respiration and systemic
hemodynamics. Part II: practical implications in critical care. Intensive Care Med. 2009;35(2):198-205.
17. Sessler CN, Gosnell MS, Grap MJ, Brophy GM, O’Neal PV, Keane KA, et al. The Richmond Agitation-Sedation Scale: validity and reliability in adult intensive care unit patients. Am J Respir Crit Care Med. 2002;166(1):1338-44, http://dx.doi.org/10.1164/rccm.2107138. 18. Teboul JL, Zapol WM, Brun-Buisson C, Abrouk F, Rauss A, Lemaire F. A
comparison of pulmonary artery occlusion pressure and left ventricular end-diastolic pressure during mechanical ventilation with PEEP in patients with severe ARDS. Anesthesiology. 1989;70(2):261-6, http:// dx.doi.org/10.1097/00000542-198902000-00014.
19. Talmor D, Sarge T, Malhotra A, O’Donnell CR, Ritz R, Lisbon A, et al. Mechanical ventilation guided by esophageal pressure in acute lung injury. N Engl J Med. 2008;359(20):2095-104, http://dx.doi.org/10.1056/ NEJMoa0708638.
20. De Backer D, Taccone FS, Holsten R, Ibrahimi F, Vincent JL. Influence of respiratory rate on stroke volume variation in mechanically ventilated patients. Anesthesiology. 2009;110(5):1092-7, http://dx.doi.org/10.1097/ ALN.0b013e31819db2a1.
21. Michard F, Chemla D, Richard C, Wysocki M, Pinsky MR, Lecarpentier Y, et al. Clinical use of respiratory changes in arterial pulse pressure to monitor the hemodynamic effects of PEEP. Am J Respir Crit Care Med. 1999;159(3):935-9.
22. Wyler vB, Takala J, Roeck M, Porta F, Tueller D, Ganter CC, et al. Pulse-pressure variation and hemodynamic response in patients with elevated pulmonary artery pressure: a clinical study. Crit Care. 2010;14(3):R111, http://dx.doi.org/10.1186/cc9060.
23. Nouira S, Elatrous S, Dimassi S, Besbes L, Boukef R, Mohamed B, et al. Effects of norepinephrine on static and dynamic preload indicators in experimental hemorrhagic shock. Crit Care Med. 2005;33(10):2339-43, http://dx.doi.org/10.1097/01.CCM.0000182801.48137.13