Evaluation of facial proportions in the
vertical plane to investigate the relationship
between skeletal and soft tissue dimensions
Márcia Cristina Cunha Costa*, Marcelo de Castellucci e Barbosa**, Marcos Alan Vieira Bittencourt***
Objective: To determine the relationship between facial heights by evaluating the soft tissues and underlying skeleton and by analyzing vertical facial proportions in the anterior region. Methods: The study used 24 lateral cephalometric x-rays and 48 photographs of the face, 24 in profile view and 24 in front view, belonging to 24 Brazilian individuals, 7 men and 17 women whose ages ranged from 19 to 38 years. Cephalometric tracings were performed and linear measurements obtained according to the analyses suggested by Schudy, Wylie and Johnson, and Thompson and Brodie. The anatomical landmarks glabella, subnasal and menton were identified on the photographs, which allowed the measurement of linear distances between these points. The data were then statistically analyzed. Results and Conclusions: A positive correlation was found between evaluations of the soft tissues and underlying skeleton based on the analyses ad-vanced by Schudy (r=0.619, p<0.001), Wylie and Johnson (r=0.595, p<0.002) and Thompson and Brodie (r=0.630, p<0.001), although, individually, some discrepancies were identified due to variability in soft tissue thickness.
Abstract
Keywords: Cephalometry. Lower facial height. Soft tissue proile.
* Dentist, Federal University of Bahia (UFBA), Speicalist in Orthodontics, UFBA.
** Specialist in Orthodontics, Pontiicial Catholic University, Minas Gerais. MSc in Dentistry, UFBA.
*** PhD and MSc in Orthodontics, Federal University of Rio de Janeiro (UFRJ). Diplomate of the Brazilian Board of Orthodontics and Facial Orthopedics.
Adjunct Profesor of Orthodontics, UFBA.
IntROduCtIOn
In the late nineteenth and early twentieth century, analysis of soft tissue profile aroused the interest of leading orthodontists, trailblazers the likes of Angle and Case. The sculpture of Apollo Belvedere was elected by Angle as a benchmark for body and facial beauty. However, Case was reluctant to pursue a single beauty standard and
therefore attempted to individualize the aesthetic goals of each one of his cases. He would study the facial contours of his patients and note all details in trying to integrate occlusal and facial goals, es-tablish diagnosis and a proper treatment plan.8
Over the years, however, research and clinical experience have revealed the close interdepen-dence of facial proportions in the three dimen-sions of space.22
In 1942, Thompson and Brodie,26 after
per-forming measurements on radiographs of 50 adults and 300 dry skulls, concluded that nasal height (nasion-anterior nasal spine) accounts for 43% of the total facial height (nasion-gnathion).
Moreover, Wylie and Johnson,28 in 1952, studied
171 patients and found that in harmonious indi-viduals total facial height (TFH) is divided into 45% of nasal height (anterior nasal spine) and 55% of dental height (anterior nasal spine-men-ton), i.e., upper facial height (UFH) and lower facial height (LFH), respectively. Later, in 1964,
Schudy23 examined cephalometric radiographs
of 270 subjects, including both retrognathic and prognathic individuals with normal growth pat-tern. The results indicated that UFH varied very little between the three facial types, although 2 mm higher in the prognathic group. LFH account-ed for 56% of TFH (nasion-menton) in the group with normal growth pattern, 59.5% in the retrog-nathic group and 54.1% in the progretrog-nathic group.
Before the advent of cephalometric radiogra-phy, anthropometric measures were frequently employed to help establish facial proportions.19
However, soft tissue compressibility can lead to errors during measurement, which underscores the limitations of anthropometrics.2 After the
aluminum filter was first introduced for taking cephalometric radiographs,4 soft tissue measuring
became part and parcel of cephalometric analysis. It allowed information to be obtained about the relationship between soft tissue profile and the underlying dentoskeletal profile since it was be-lieved that certain hard tissue abnormalities could be masked or even heightened by the soft tissues. Soft tissue profile does not always follow skel-etal profile as it differs from the latter in some areas.25 This is due to a wide variability in soft
tissue thickness,7 which renders inadequate the
exclusive use of hard tissue analysis.12,13 Thus,
evaluation of facial proportions and aesthetics should be conducted during clinical examination and the findings should be compared with
cepha-lometric radiographs and photographs.19
Accurate measurements can also be obtained
from standardized photographs.2 These photos
are useful for recording and analyzing significant asymmetries and for checking proportionality be-tween the vertical thirds, making them an essential element for diagnosis in orthodontics.10 However,
their validity as a means of pre- and post-treatment evaluation only emerges when measurements are undertaken to prevent distortion. If a reasonably standardized work methodology is not set in mo-tion, photographs will be insufficient to provide ac-curate representation of anatomical elements and their actual proportions. Camera position, patient distance and position, and focus control are some of the elements which, if well understood and con-trolled, make for accurate reproduction.3
Orthodontists must recognize that the com-plexity of certain orderly, pleasant-looking ar-rangements present in all portions of the face
can-not be fully expressed by numbers or measures,11
and that normal occlusion is not necessarily a criterion for beauty since some patients exhibit normal occlusion whose faces do not fall within acceptable aesthetic limits.20
Due to major individual variations in soft tissue thickness, length and postural tone, the cutaneous contour of the face must be studied directly if fa-cial balance is to be properly assessed.7 In light of
the fact that many authors have proposed differ-ent methods to assess the facial thirds, this study aimed to analyze, quantify and compare skeletal and soft tissue features by measuring vertical fa-cial proportions to identify potential differences between these two aspects.
MAteRIAl And MethOds
Me Gn Pog
ANS N
view and 24 in front view, belonging to 24 Brazil-ian individuals, 7 men and 17 women whose ages ranged from 19 to 38 years.
The cephalometric radiographs were acquired according to the technique described by Broad-bent6 and the patients were instructed to keep
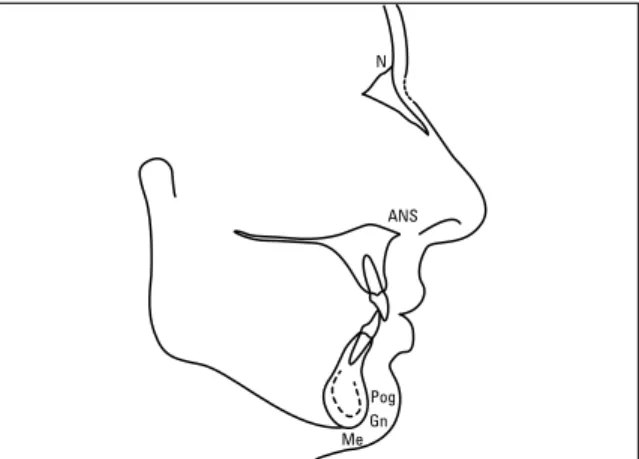
their teeth in maximum intercuspation. A sheet of acetate paper was attached to each cephalogram and cephalometric tracings were then performed. The cephalogram used for the tracings (Fig 1) out-lined the contours of the frontal, nasal, maxillary and mandibular bones, maxillary and mandibular central incisors, and soft tissue profile. The fol-lowing anatomical landmarks were identified on the cephalogram: nasion (N), anterior nasal spine (ANS), pogonion (Pog), menton (Me) and gna-thion (Gn). Once these points had been identi-fied, the facial plane (N-Pog) was traced as well as the nasion-menton (N-Me) and nasion-gnathion (N-Gn) lines, in black, blue and red, respectively. Linear measurements were then obtained
accord-ing to the analysis advocated by Schudy,23 Wylie
and Johnson,28 and Thompson and Brodie.26 To
standardize the sample and minimize errors all cephalometric measurements were performed twice by the same examiner with a one-week in-terval. With the values obtained in the first and
second measurements, scatter diagrams were con-structed for each variable and Pearson’s correla-tion coefficient calculated, whose value, in each case was 0.99 (p<0.001).
The elements used for cephalometric evalu-ation of facial proportions in the vertical direc-tion according to Schudy’s analysis are depicted in Figure 2. Namely:
» Points N, ANS, Pog and Me; » Facial plane;
» Orthogonal projection of point ANS on the facial plane (ANS’);
» Orthogonal projection of point Me on the extension of the facial plane (Me’);
» TFH = distance between N and Me’ mea-sured in the facial plane;
» UFH = distance between N and ANS’ mea-sured in the facial plane;
» LFH = distance between N and Me’ mea-sured in the facial plane.
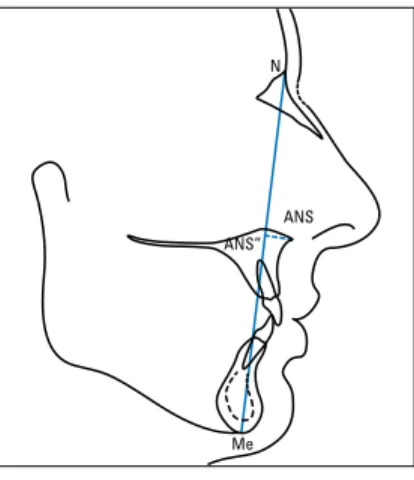
The elements used for cephalometric evalua-tion of facial proporevalua-tions in the vertical direcevalua-tion, according to Wylie and Johnson’s analysis are de-picted in Figure 3. Namely:
» Points N, ANS and Me; » Nasion-menton line;
» Orthogonal projection of point ANS on the nasion-menton line (ANS’’);
» TFH = distance between N and Me mea-sured on the nasion-menton line;
» UFH = distance between N and ANS’’ mea-sured on the nasion-menton line;
» LFH = distance between ANS’’ and Me measured on the nasion-menton line. The elements used for cephalometric evalua-tion of facial proporevalua-tions in the vertical direcevalua-tion according to Thompson and Brodie’s analysis are depicted in Figure 4. Namely:
» Points N, ANS and Gn; » Nasion-gnathion line;
» Orthogonal projection of point ANS on the nasion-gnathion line (ANS’’’);
Gn ANS’’’
ANS N
Me Me
Me’ Pog
ANS’ ANS”
ANS ANS
N N
» TFH = distance between N and Gn mea-sured on the nasion-gnathion line;
» UFH = distance between N and ANS’’’ mea-sured on the nasion-gnathion line;
» LFH = distance between ANS’’’ and Gn measured on the nasion-gnathion line. For the facial photographs, patients were po-sitioned in the cephalostat with the Frankfort plane parallel to the ground and then instructed to keep their teeth in maximum intercuspation. For profile view photographs, the head was
rotat-ed 5° towards the camera.9 This position was
es-tablished by having two previously marked points on the cephalostat coinciding, with the aid of a protractor, i.e., one on the fixed base and one on the swivel base. Similarly, two points were set for acquiring front view photographs, thus ensuring that the midsagittal plane would remain oriented towards the camera lens.
A conventional camera used for routine clini-cal photography was utilized. It was equipped with 35 mm film and a 100 mm macro lens. The focus cylinder was removed and adapted to a bel-lows mounted on a slider with a millimeter ruler, which allowed standardization (in this case, 50 mm). The diaphragm was set to an opening of f/5.6 and the flash positioned at 12 o’clock for
front view photos and 3 o’clock for profile view
photos.9 The equipment was mounted on a fully
adjustable tripod positioned at fixed markings drawn on the ground. Its joints were also fixed so that the lens was kept perpendicular to the center of an imaginary line joining the ear-rods of the cephalostat, thus averting image distor-tion that might compromise the true facial con-tour. The distance between the camera’s objec-tive and the ear-rods of the cephalostat was stan-dardized at 1.36 m.
The following points were identified on the photographs:
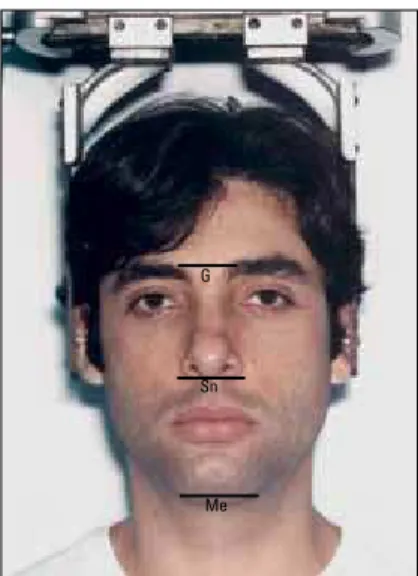
» Glabella (G): most prominent or anterior point in the midsagittal plane of the forehead, above the supraorbital crest.16 It can also be
identified in front view photos as the midpoint between the eyebrows, also in the midsagittal plane, and at the level of the supraorbital crest. » Subnasal (Sn): the point where the upper
lip joins the columella.8 It is identified as the
point located at the junction of the lower edge of the nose and the edge of the upper lip, in the midsagittal plane.16
» Menton (Me): the inferior-most point of the
lower contour of the chin8 marked on front
view photographs in the midsagittal plane.
FIGURE 4 - Cephalogram depicting evaluation of facial proportions in vertical direction, accord-ing to Thompson and Brodie’s analysis. FIGURE 2 - Cephalogram depicting evaluation of
facial proportions in vertical direction, accord-ing to Schudy’s analysis.
G
Sn Sn
Me G
Me
Lines running tangent to these points and per-pendicular to the lateral edges of the photograph were traced, allowing the measurement of linear distances between them (Figs 5 and 6).
In keeping with the same method applied to the radiographs to standardize the sample and minimize errors, landmarks and measurements were identified on the photos twice by one and the same examiner with a one-week interval. The resulting values were also treated statistically. The results showed a strong positive linear correla-tion between the values obtained in the first and second measurements, further confirmed by the Pearson correlation coefficient which, in all cases, was 0.99 (p<0.001).
Results And dIsCussIOn
The teeth and facial bones form a framework upon which the muscles, connective tissue and soft tissues rest. Thus, analysis of either skeletal or dental pattern alone can lead to misdiagnosis given a wide variation in the thickness of soft tis-sues overlying these structures. Even if an infi-nite number of anatomical landmarks were to be used in the study of dentoskeletal patterns, soft
tissue contour would only be predictable if soft tissues were to form a uniform veneer over teeth and bones, which is not the case.7 Thus, soft
tis-sue in facial profile may not accurately reflect the growth pattern of underlying skeletal tissues,14
although a close relationship has been proven to exist between the two.5,21
Therefore, when evaluating the success of orthodontic treatment, data related to soft tissues are as important as hard tissues in determining facial balance and harmony.1,17,29 Moreover, visual
impact stems from soft tissues and their relative proportions.18,29 Soft tissues are the last
compen-sating factor in the morphology of facial contour. Its analysis is therefore of paramount importance
in orthodontic diagnosis and treatment planning.27
Although many studies have been conduct-ed with the aim of studying the relationship be-tween the soft tissues that make up the skeletal facial profile and the underlying tissue, contro-versies still abound. With the purpose of vi-sualizing and quantifying this relationship, the present study correlated soft tissue and skeletal measurements through statistical analysis us-ing LFH measurements taken only in profile
FIGURE 5 - Profile view photo illustrating points and lines used for deter-mining linear measurements.
56
56 58 60 62 54
54 52
52 50
48
46
56
56 58 60 50
54
54 52
52 50
48
46 56
56 54
54 52
52 50
50 48
48 46
46
56
56 58 60 62 54
54 52
52 50
50 48
46
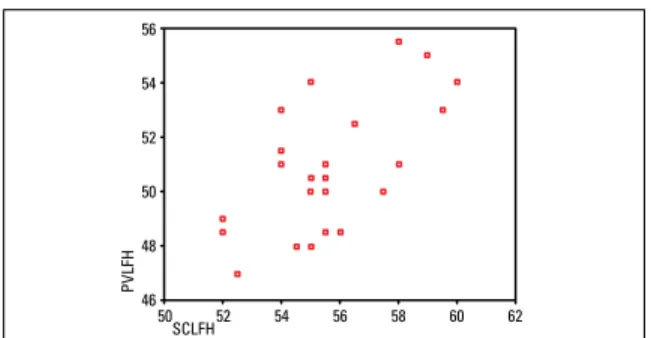
view photographs, given the results depicted in Figure 7. The scatter plot and Pearson’s cor-relation coefficient showed strong positive lin-ear correlation (r = 0.963, p <0.001) between LFH values obtained from the analysis front view photos (FVLFH) and profile view photos (PVLFH). Furthermore, anatomical landmarks are easier to identify in a lateral view. Scatter plots were then constructed with percentage LFH values obtained by analyzing profile view photos (PVLFH) and using the analyses sug-gested by Schudy (SCLFH), Wylie and John-son (WJLFH), and ThompJohn-son and Brodie (TBLFH). Pearson’s correlation coefficient was also calculated and the coefficient tested.
The results indicated a positive correlation, significant at a 1% level, between variables PV-LFH and SCPV-LFH (Fig 8), PVPV-LFH and WJPV-LFH (Fig 9), and PVLFH and TBLFH (Fig 10), sug-gesting interdependence between the soft tissue profile and the underlying skeleton, thereby cor-roborating Riedel.21
On the other hand, in a private analysis of the individuals comprising the study sample it was found that two such individuals who exhib-ited the same increased percentage LFH values in the skeletal analyses (LFH, Schudy = 58% and 58%, LFH, Wylie and Johnson = 58.5% and 58.5%, LFH, Thompson and Brodie = 58% and 58%), showed different values for this measure
FIGURE 7 - Scatter diagram between percentage LFH values, obtained from analysis of front and profile view pictures in women and men (r=0.963, p<0.001).
FIGURE 9 - Scatter diagram between percentage LFH values, obtained from analysis of front and profile view photos and Wylie and Johnson’s analysis in women and men (r=0.595, p<0.002).
FIGURE 8 - Scatter diagram between percentage LFH values, obtained from analysis of front and profile view photos and Schudy’s analysis in women and men (r=0.619, p<0.001).
FIGURE 10 - Scatter diagram between percentage LFH values, obtained from the analysis of profile view pictures and Thompson and Brodie’s analysis in women and men (r=0.630, p<0.001).
WJLFH
PVLFH
TBLFH
PVLFH
FVLFH
PVLFH PVLFH
in profile view photographs. If, on the one hand, one of them displayed an LFH value of 51%, very close to 50% (considered normal),15,19,24
another individual exhibited a value of 55.5%, which can be construed as an increased LFH. By the same token, two other individuals displayed different percentage LFH in the skeletal analy-ses (LFH, Schudy = 54% and 59.5%, LFH Wylie and Johnson = 54% and 60%, LFH, Thompson and Brodie = 54% and 59.5%). These percent-ages were not found in the analysis of their pro-file view photographs, in which both showed
the same increased LFH value (53%). The data point to a variability in soft tissue thickness while indicating that soft tissues do not always reflect the underlying dentoskeletal profile,
which is consistent with findings by Burstone,7
Kuyl et al,14 and Subtelny.25
COnClusIOns
The soft tissue profile tended to follow the con-tour of the underlying skeletal profile, although in some cases this was not the case, probably due to variations in soft tissue thickness.
1. Basciftci FA, Uysal T, Buyukerkmen A. Determination of Holdaway soft tissue norms in Anatolian Turkish adults. Am J Orthod Dentofacial Orthop. 2003 Apr;123(4):395-400. 2. Bishara SE, Jorgensen GJ, Jakobsen JR. Changes in facial
dimensions assessed from lateral and frontal photographs. Part I: methodology. Am J Orthod Dentofacial Orthop. 1995 Oct;108(4):389-93.
3. Bittencourt MAV. Fotografia clínica na prática ortodôntica. Parte II: fotografias faciais. Rev SOB. 1999
jul-dez;3(8):330-4.
4. Björk A. Cephalometric X-ray investigations in dentistry. Int Dent J. 1954 Sep;4(5):718-44.
5. Brandão AMB, Abrão J, Capelozza Filho L. Avaliação da correlação entre as características dentárias, esqueléticas e tegumentares em portadores de má oclusão Classe II divisão 1a, obtidas pela cefalometria e análise facial numérica. Rev Dental Press Ortod Ortop Facial. 2002 jan-fev;7(1):27-35.
6. Broadbent BH. A new X-ray technique and its application to Orthodontia. Angle Orthod. 1931 Apr;1(2):45-66. 7. Burstone CJ. The integumental profile. Am J Orthod. 1958
Jan;44(1):1-25.
8. Fernández-Riveiro P, Suárez-Quintanilla D, Smyth-Chamosa E, Suárez-Cunqueiro M. Linear photogrammetric analysis of the soft tissue facial profile. Am J Orthod Dentofacial Orthop. 2002 Jul;122(1):59-66.
9. Freehe CL. Photography in dentistry: equipment and technique. Dent Clin North Am. 1983 Jan;27(1):3-73. RefeRenCes
10. Graber TM. Orthodontics: principles and practice. 3rd ed.
Philadelphia: W. B. Saunders; 1966.
11. Hinds EC, Kent JN. Surgical treatment of developmental jaw deformities. St. Louis: C.V. Mosby; 1972.
12. Holdaway RA. A soft-tissue cephalometric analysis and its use in orthodontic treatment planning. Part I. Am J Orthod. 1983 Jul;84(1):1-28.
13. Holdaway RA. A soft-tissue cephalometric analysis and its use in orthodontic treatment planning. Part II. Am J Orthod. 1984 Apr;85(4):279-93.
14. Kuyl MH, Verbeeck RMH, Dermaut LR. The integumental proile: a relection of the underlying skeletal coniguration? Am J Orthod Dentofacial Orthop. 1994 Dec;106(6):597-604. 15. Legan HL, Burstone CJ. Soft tissue cephalometric analysis for
orthognathic surgery. J Oral Surg. 1980 Oct;38(10):744-51. 16. Miyashita K. Glossary of cephalometric terms and
deinitions. In: Miyashita K. Contemporary cephalometric radiography. Tokyo: Quintessence; 1996. p. 245-66. 17. Peck S, Peck L, Kataja M. Skeletal asymmetry in esthetically
pleasing faces. Angle Orthod. 1991 Spring;61(1):43-8. 18. Prahl-Andersen B, Ligthelm-Bakker Aswmr, Wattel E, Nanda
R. Adolescent growth changes in soft tissue proile. Am J Orthod Dentofacial Orthop. 1995 May;107(5):476-83. 19. Profit WR. Ortodontia contemporânea. 2ª ed. Rio de
Janeiro: Guanabara Koogan; 1995.
26. Thompson JR, Brodie AG. Factors in the position of the mandible. J Am Dent Assoc. 1942 Jun;29(7):925-41. 27. Worms FW, Isaacson RJ, Speidel TM. Surgical orthodontic
treatment planning: proile analysis and mandibular surgery. Angle Orthod. 1976 Jan;46(1):1-25.
28. Wylie WL, Johnson EL. Rapid evaluation of facial dysplasia in the vertical plane. Angle Orthod. 1952 Jul;22(3):165-82. 29. Zylinski CG, Nanda RS, Kapila S. Analysis of soft tissue facial
proile in white males. Am J Orthod Dentofacial Orthop. 1992 Jun;101(6):514-8.
Contact address
Marcos Alan Vieira Bittencourt Rua Araújo Pinho, 62, Canela
CEP: 40.110-150 - Salvador / Bahia, Brazil E-mail: [email protected]
Submitted: October 2007 Revised and accepted: November 2009 21. Riedel RA. An analysis of dentofacial relationships. Am J
Orthod. 1957 Feb;43(2):103-19.
22. Sassouni V, Nanda S. Analysis of dentofacial vertical proportions. Am J Orthod. 1964 Nov;50(11):801-23. 23. Schudy FF. Vertical growth versus anteroposterior growth
as related to function and treatment. Angle Orthod. 1964 Apr;34(2):75-93.
24. Spradley FL, Jacobs JD, Crowe DP. Assessment of the anteroposterior soft-tissue contour of the lower facial third in the ideal young adult. Am J Orthod. 1981 Mar;79(3):316-25. 25. Subtelny JD. A longitudinal study of soft tissue facial