E
VALUATING HOSPITAL
PERFORMANCE THROUGH
SIMULTANEOUS APPLICATION OF
SEVERAL INDICATORS
Hz$dito Pa&h Lasso1
Various indicators-including the percentage of hospital beds occu- pied, the average length of a hospital stay, and the average number of dis- charges per bed over a given period-are presented from time to time for use by hospital administrators. While it is cus- tomary to analyze these and other vari- ables in isolation, simultaneous analysis of all three is rarely done, partly for lack of a suitable way of combining them and assessing them together (I). The object of this article is to describe a way of doing this that is utilized in Colombia to evalu- ate hospitals. The method was first used in 1976 to study medical and hospital fa- cilities of Colombia’s Social Security Agency in the Cauca Valley (2).
’ Professor, Department of Social Medicine, Universidad de1 Valle. Colombia
M
ATERIALSANDMETHODS
The basic approach employed to combine these three indicators is to graph them on a chart where the average bed occupancy per year (equivalent to the percentage of time an average bed was occupied) is shown on the X axis, and the average annual number of dis- charges per bed (known as “productiv- ity”) is shown on the Y axis. These values provide all the information needed to calculate the length of the average hospi- tal stay (“bed turnover time”), since
365 x % beds
occupied Average length
Average no. of = of stay
discharges per (in days)
bed in a year
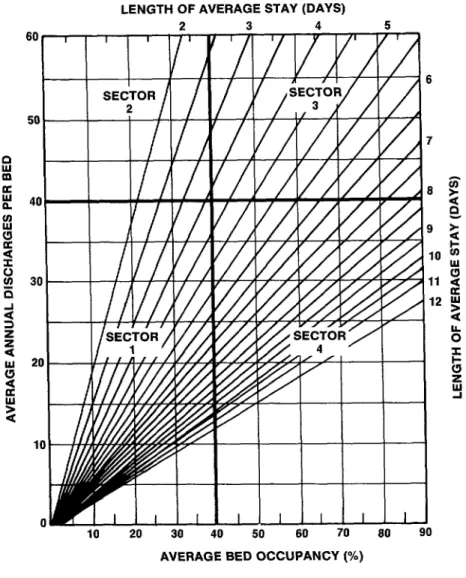
And indeed, the average length of stay in days can be shown on the graph by draw- ing straight lines out from the origin (3)) each of which represents an average stay of a particular number of days (Figure 1).
FIGURE 1. A graph for showing average bed occupancy (%), average annual discharges per bed, and average length of stay simuttaneousfy. The occupancy and discharge rates are given by the X and Y axes, respectiiefy, and the length of stay is given by the diagonal lines drawn out from the origin.
LENGTH OF AVERAGE STAY (DAYS)
2 3 4 5
60 , I I I I
/I
I
I
SECTOR I /
6
I I 2 /I / I/ n
7
e AVERAGE BED OCCUPANCY (%)
co m
h
. 2
E following features: Sector indicates relatively low levels of bed oc- 1 (lower left) .g
u cupancy and productivity-the least de-
a x sirable situation; Sector 2 (upper left) in-
2 dicates relatively low levels of bed
2 occupancy, high productivity, and short 2 hospital stays; Sector 3 (upper right) in- dicates relatively high levels of bed occu- pancy and productivity-the most desir-
342 able situation; and Sector 4 (lower right)
indicates relatively high levels of bed oc- cupancy, low productivity, and long hos- pital stays (typical for hospitals specializ- ing in chronic diseases).
Sector 1 hospitfds
Excess bed availability
Low need for patient hospitaliza- tion
Reduced demand because of pa- tients being diverted to other institutions
Sector 2 hospitah
Excess bed availability Unnecessary hospitalization Many beds used for observation of patients
Predominance of normal (as op- posed to abnormal) deliveries
Sector 3 dospitah
Good quantitative performance Small proportion of unused beds
Sector 4 hospitals
High proportion of severe cases Predominance of chronic cases Unnecessarily long stays
In addition, when evaluating hospital performance, it is necessary to consider the hospital’s size (the number of beds gives a good indication of size) and the types of cases being treated. Also, in furing the limits of adequate performance, it seems appropriate to al- low for a margin of variation such as one standard deviation from the mean.
Hospitals Studied
The data employed here as an illustration (see Tables 1-3) were col- lected by the Research Program for Health Services Development (Programa de Investigacidn y Desarrollo de Servi- cios-PRIDES) in connection with a sur- vey of regional hospitals performed for Colombia’s Ministry of Health in 1981 (4). That survey sought general financial and service information by mail for
1977-1980 from each of the 105 institu- tions listed as regional hospitals by the Ministry of Health in 1979. Not all of these responded, but those that did were
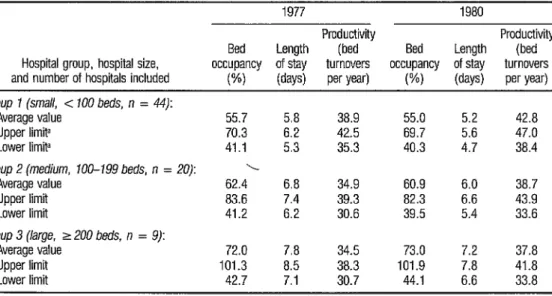
TABLE 1. Average bed occupancy, length of stay, and productivity at 73 of Colombia’s regional hospitals in 1977 and 1980, showing upper and lower 95% confidence limts.
1977 1980
Productivity Productivity Bed Length (bed Bed Length (bed Hospital group, hospital size, occupancy of stay turnovers occupancy of stay turnovers and number of hospitals included wd (days) per year) W) (days) per year)
Group 1 (small, < 100 beds, n = 44):
Average value 55.7 5.8 38.9 55.0 5.2 42.8
Upper limita 70.3 6.2 42.5 69.7 5.6 47.0
Lower limit” 41.1 5.3 35.3 40.3 4.7 38.4
Group 2 (medium, 100-199 beds, n = 20): \
Average value 62.4 6.8 34.9 60.9 6.0 38.7
Upper limit 83.6 7.4 39.3 82.3 6.6 43.9
Lower limit 41.2 6.2 30.6 39.5 5.4 33.6
Group 3 (large, 2 200 beds, n = 9):
Average value 72.0 7.8 34.5 73.0 7.2 37.8
Upper limit 101.3 8.5 38.3 101.9 7.8 41.8
Lower limit 42.7 7.1 30.7 44.1 6.6 33.8
Source: PRIDES report (4). L
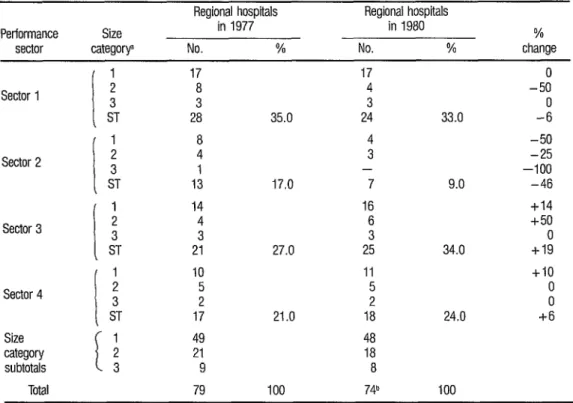
TABLE 2. Distribution of Colombian regional hospitals in the four performance sectors (see Figure 1) as of 1977 and 1980, by size category. The letters “ST” indicate the subtotal of hospitals in each sector.
Performance sector
Size cateqorv
Regional hospitals Regional hospitals
in 1977 in 1980
No. % No. %
% change Sector 1 Sector 2 Sector 3 Sector 4 Size category subtotals Total
I 2 3 1
ST 17 8 3 28 8 4 I 13 14 4 3 21 10 5 2 17 49 21 9 79 17 4 3
35.0 24
4 3 -
17.0 7
16 6 3
27.0 25
11 5 2
21.0 18
48 18 8
100 74b
0 -50
33.0 -i
-50 -25 -100
9.0 -46
+I4 +50
0 34.0 +I9
+I0 0 0
24.0 +6
100
a Size category 1 Includes those hospitals with under 100 beds, category 2 mcludes those wrth 100-199 beds, and category 3 mcludes those with at least 200 beds.
b Five hospitals’ 1980 data were excluded because of Internal inconsistencies
included in the survey. Differences in the total number of hospitals providing data for different years led to differences in the numbers considered-the specific number generally being between 70 and 80.
In addition, more detailed administrative and financial information was obtained from a representative sam- ple of 20 regional hospitals stratified ac- cording to size (number of beds) and lo- cation within the country (by political subdivision). These 20 hospitals were se- lected from among the 76 regional insti-
tutions that met all the more stringent requirements established by our defini- tion of a regional hospital.
Survey Data
The survey information
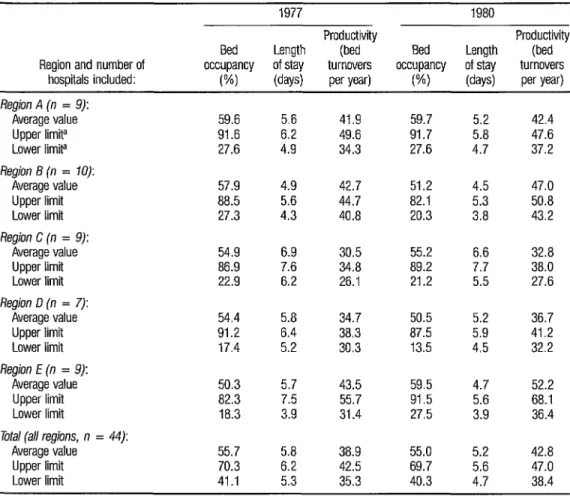
TABLE 3. Average bed occupancy, length of stay, and productivii at 44 of Colombia’s smaller regional hospiils (all with less than 100 beds) in 1977 and 1980, grouped according to the regional (multidepartmental) subdivisions shown in Rgure 4. This table also shows upper and lower 95% confidence limits for each average listed.
Region and number of hospitals included:
1977 1980
Productivity Productivity Bed Length (bed Bed Length (bed occupancy of stay turnovers occupancy of stay turnovers
W) (days) per year) w (days) per y@
Region A (n = 9): Average value Upper limit! Lower limita
Region 6 (n = 10): Average value Upper limit Lower limit
Region C (n = 9): Average value Upper limit Lower limit
Region D (n = 7): Average value Upper limit Lower limit
Region E (n = 9): Average value Upper limit Lower limit
Total (all regions, n = 44): Average value Upper limit Lower limit
59.6 5.6 41.9 59.7 91.6 6.2 49.6 91.7 27.6 4.9 34.3 27.6
57.9 4.9 42.7 51.2 88.5 5.6 44.7 82.1 27.3 4.3 40.8 20.3
54.9 6.9 30.5 55.2 86.9 7.6 34.8 89.2 22.9 6.2 26.1 21.2
54.4 5.8 34.7 50.5 91.2 6.4 38.3 87.5 17.4 5.2 30.3 13.5
50.3 5.7 43.5 59.5 82.3 7.5 55.7 91.5 la.3 3.9 31.4 27.5
55.7 5.8 38.9 55.0 70.3 6.2 42.5 69.7 41.1 5.3 35.3 40.3
5.2 42.4 5.8 47.6 4.7 37.2
4.5 47.0 5.3 50.8 3.8 43.2
6.6 32.8 7.7 38.0 5.5 27.6
5.2 36.7 5.9 41.2 4.5 32.2
4.7 52.2 5.6 68.1 3.9 36.4
5.2 42.8 5.6 47.0 4.7 38.4
Soz/rce: PRIDES report 14).
-I The upper and lower ltmits ate the values at whtch the divergence from the average value becomes statistically signtficant (P = 0.05)
dividing the OBDS by the total available bed-days (ABDs); and the average length of stay can be determined by dividing the OBDS by the number of discharges. (The total available bed-days is simply the number of beds installed multiplied by 365 ; for purposes of the assessment presented here, the sum total of the available bed-days was not reduced by the number of bed-days set aside for bed disinfection, bed repair, emergencies, or other circumstances that typically reduce the number of beds actually available by something on the order of 5 to 15 % .)
treated and upon hospital policies re- garding specific clinical standards.
One should not overlook the fact that changes in productivity can also be due to changes in the number of beds; and when such changes occur the fact should certainly be noted. However, an increase in the number of beds gener- ally involves considerable financial in- vestment and a change in the size of the hospital or inauguration or enlargement of a hospital service; it is thus a relatively infrequent event. Similarly, a significant reduction in the number of beds gener- ally involves such things as eliminating or reducing a service, and this is an even rarer event. Periodic fluctuations in the reported number of beds call into ques- tion the hospital’s actual size and even the effective size of the operating service or ward involved.
Rx
SULTSThe data displayed in Table 1
and Figure 2 clearly demonstrate that the percentage bed occupancy and the aver- age length of stay at the hospitals sur- veyed were associated with hospital size (as reflected in the number of beds). Thus, the small hospitals (those with less than 100 beds) tended to have the lowest bed occupancy rates and the shortest av- erage stays in both 1977 and 1980; mid- %
2 . dle-size institutions (with loo-199 beds) tended to have intermediate bed occu- 3
s
panty rates and average stays; and large hospitals (with 200 beds or more) tended *g to have the highest bed occupancy rates
u
a * and longest average stays. Similar but
:
less marked differences are evident be- tween the bed turnover (productivity) of
346
the small hospitals and that of interme- diate and large ones, with the productiv- ity rates at the small hospitals tending to be somewhat higher. All this shows that if these regional hospitals’ quantitative performances are to be assessed on a comparative basis, at least three averages (one each for small, medium, and large hospitals) should be used in order to avoid decision-making errors-such as those that might occur, for example, if marked differences in the average length of stay at large hospitals as compared to small ones were not considered.
The average bed occupancy and discharge rates found for each of these three groups of hospitals in 1977
and 1980 (see Table 1) were used to de- fine the borders of sectors 1, 2, 3, and 4 on the appropriate charts (Figures 3a through 3f). In addition, 95% confi- dence limits-beyond which there was 95% confidence of an actual departure from the norm-were calculated for each variable, group of hospitals, and year (see Table l), and these limits were drawn in on the charts.
Each hospital studied was then located at the appropriate points on the 1977 and 1980 charts dealing with its group, triangles being used to show hos- pitals in the survey sample that were se- lected for in-depth study of administra- tive and financial data.
FIGU COIOI
G-l G-2 G-3
G-l G-2 G-3
G-l G-2 G-3
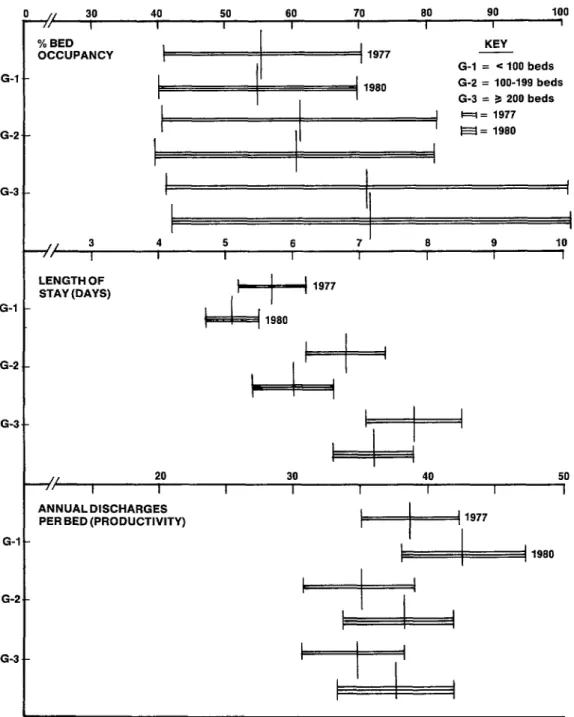
fE 2. A chart showing the influence of hospital size upon bed occupancy rates, productivii, and length of stay at 73 of kbia’s regional hospitals in 1977 and 1980. In each case a point indicated by the vertical midline shows the average
while the horizontal lines show the range of values up to the upper and lower 95% confidence limits.
]/ 30 40 50 60 70 80 90 100 I I I , I I I I I % BED
OCCUPANCY
KEY G-l = < 100 beds G-2 = loo-199 beds G-3 = 3 200 beds
I
I
1
i
4 5 6 7 8 9 10 I I I I I I I
LENGTH OF
STAY (DAYS) 1977
ANNUALDISCHARGES PER BED (PRODUCTIVITY)
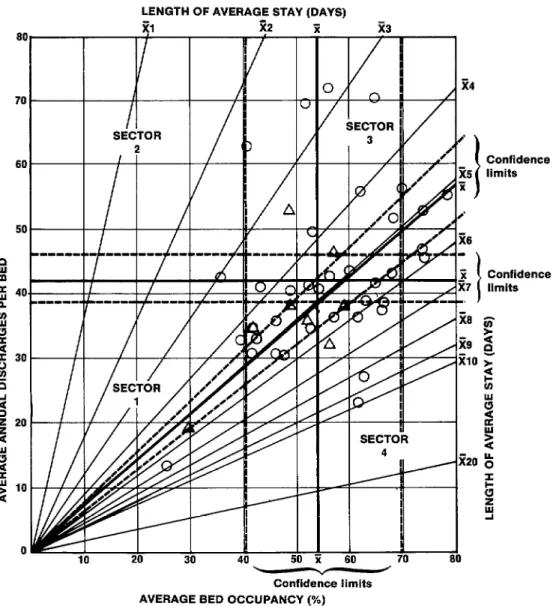
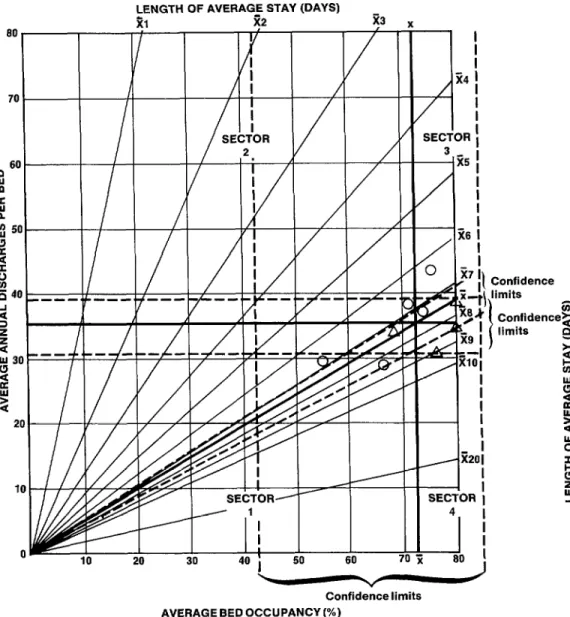
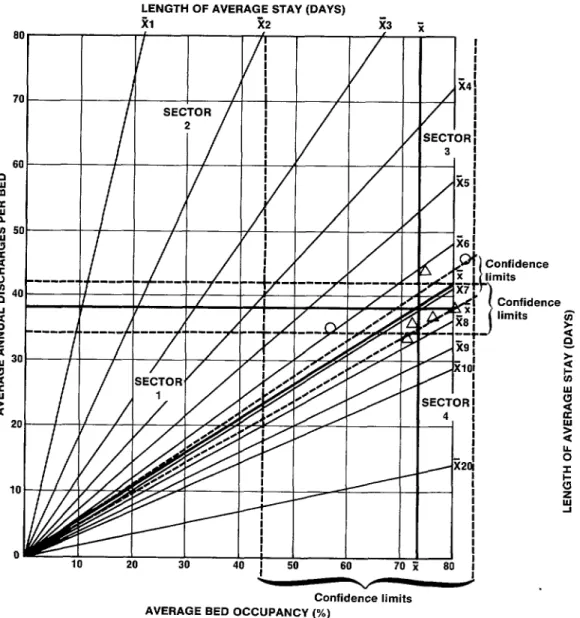
FIGURES 3a through 31. These charts rate the 1977 and 1980 performance of small (< 100 beds), medium (loo-199 beds), and large ( 2 200 beds) regional Colombian hospitals in terms of average bed occupancy, average annual numbers of discharges per bed (productiiity), and average length of stay. The lines to either side of these averages show 95% confi- dence limits. The circles and triangles show the hospitals covered, the triangles designating those where an in-depth study of administrative and financial data was conducted.
LENGTH OF AVERAGE STAY (DAYS)
60 70 80 Confidence limits
AVERAGE BED OCCUPANCY (%)
3a. Small regional hospitals (< 100 beds), 1977.
Confidence z limits * 8
t!
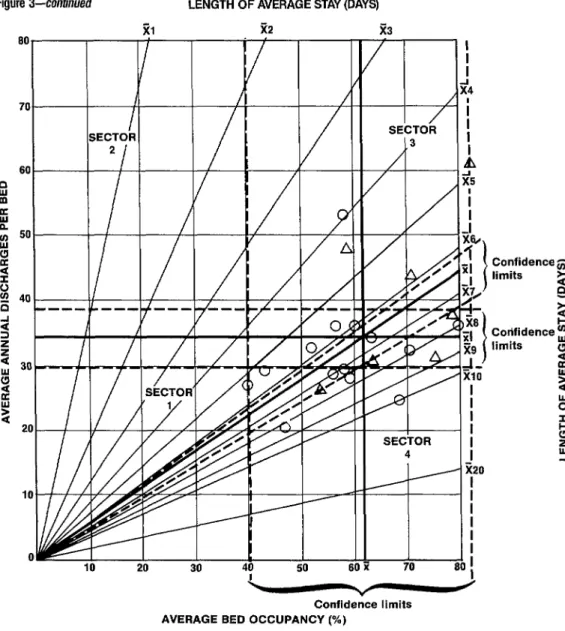
Figure 3-continued
LENGTH OF AVERAGE STAY (DAYS)
z3
i-F
3
SECTOR
SECT{ 4
Confidence limits
Confidence limits
60 70 80 Confidence limits
AVERAGE BED OCCUPANCY (%)
3b. Small regional hospitals (~100 beds), 1980.
ings, devise strategies for improving per- formance, evaluate performance relative to the performance of similar institutions elsewhere, compare performance at one time with that of another, and examine possible trends and changes.
It is also possible to get a
tal performance nationwide. Table 2, taking data used in the six charts, shows the performance of all the regional hos- pitals studied for 1977 and 1980, group- ing the hospitals according to size and the sector of the chart where they were
Figure 3-continued LENGTH OF AVERAGE STAY (DAYS)
60 I / / P
m B 8 50
0
10
10 20 20 30 30 40 40 50 50 61 61
SECiOR
4
70 80 I I
c
Confidence limitsAVERAGE BED OCCUPANCY (%)
Confidences limits 2
G Cottfidence !iJ limits l
2 2 2 2 : 9
3c. Middle-size regional hospitals (loo-199 beds), 1977.
placed. The data indicate little change in the numbers of hospitals in Sector 1 (the low-performance sector) between 1977 and 1980. That is, the numbers of small and large hospitals remained the same; and while the number of medium-size hospitals appeared to fall by four, only one of these four hospitals moved into another sector, the other three being
eliminated from consideration in 1980 because of erroneous data.2
Figure O-continued
all
70
60
---.
- .--
7
LENGTH OF AVERAGE STAY (DAYS
21 R2 z3
4
d
j
x20
I i
I
70 80
j
Confidence limits Confidence limits
Confidencelimits AVERAGE BED OCCUPANCY(x)
3d. Middle-size regional hospitals (100-199 beds), 1980.
Another noteworthy point is that charts 3 b and 3d each show two hos-
Because each sector boundary z
on the charts is derived from average val- .
pitals in Sector 1 that were markedly sep- ues, one would not expect general im- 2 2 arated from the others in their groups.
This circumstance should obviously be of concern to the hospital administrators in- volved .
provements to appear as movements 2
Figure 3-co&wed
80
70
ENGTH OF AVERAGE STAY (DAYS) 1 ii9 _.-
BE&R !
3
A
i
35
,
I
I
,ji201
E
SECTOR I J
4
-I
i I80
i
Confidence limits AVERAGE BED OCCUPANCY (%)
3e. Large regional hospitals (2 200 beds), 1977.
in 1977-1980 can be described as posi-
tive; obviously, however, there is still room for substantial improvement.
Table 3 indicates the 1977- 1980 performance of Colombia’s re- gional hospitals with fewer than 100 beds, grouped according to regional (multidepartmental) subdivisions. The
Figure 3-continued
LENGTH OF AVERAGE STAY (DAYS) 21 22
^^
IO 20 30 40 I 50 60 70 i Confidence limits AVERAGE BED OCCUPANCY (%)
3f. Large regional hospitals (5 200 beds), 1980.
ductivity improved. In Region C produc- clined , tivity improved slightly. In Region D bed
and productivity improved
sharply. occupancy declined, length of stay de-
clined, and productivity improved
slightly. And in Region E bed occupancy increased sharply, length of stay de-
Relative to the other regions, Region Chad an unusually low bed turn- over ratio as a result of long hospital stays-a situation implying unwarranted stays, a relatively small proportion of ob-
FIGURE 4. A map of Colombia showing the grouping of individual departments into regions a through e.
354
of these and other factors. Region E showed the highest productivity of any region in 1977, and improved its show- ing markedly in 1980 as a result of im- proved bed utilization and shortened stays. Overall, the country’s regional hos- pitals with less than 100 beds improved
their productivity in the 1977-1980 pe- riod; and since there was no average im- provement in the bed occupancy rate, this improvement can be attributed al- most entirely to shorter average stays.
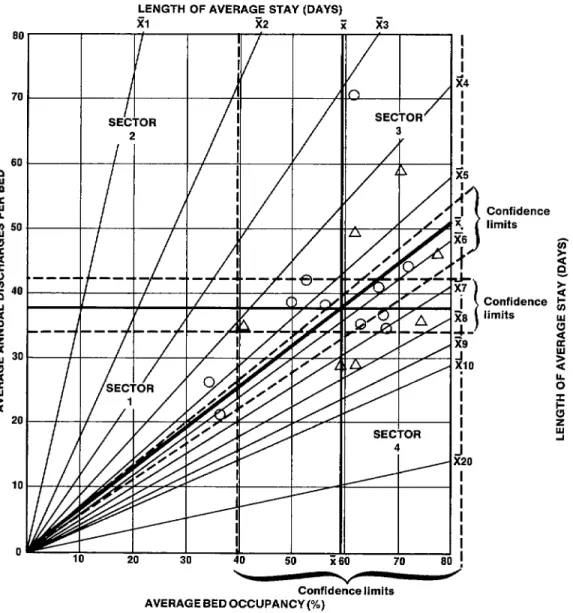
FIGURE 5. Quantitative performance of small (< 100 bed) regional hospitals in 1980 and changes in performance of small Region A hospitals between 1977 and 1980. For each Region A hospital, an arrow is drawn from its 1977 position to its 1980 position.
Confidence LENGTH OF AVERAGE STAY (DAYS) - limits
I.
f-
/
/
I
20
/’
LL
,’
/’
ci
50
v /
regional hospitals in 1980. The arrows in the figure show how the situation at each Region A hospital changed from 1977 to
1980. This chart makes the magnitude and direction of change in each perfor- mance indicator readily apparent, per- mits the principal change vector to be followed over time for each hospital, and provides the basis for devising policy seeking to correct weaknesses in the insti- tution’s quantitative performance. The usefulness of examining all three charted variables together is shown by the fact that in some cases where productivity was improved or maintained and the average stay was shortened, these gains were off- set by a reduced bed occupancy rate; whereas in other cases the average hospi- tal stay remained fairly constant, the bed occupancy rate increased, and meaning- ful gains in productivity were made.
C
ONCLUDING REMARKSThe methodology illustrated here is designed to augment various ear- lier approaches for working with the three traditional indicators covered (1,i’).
In the past, some administrators believed there was an association between hospital size and relative efficiency. For example, a 1981 PAHO publication (1) refers to this belief, points to the assumption that an b average stay of seven to nine days and oc- 5 cupancy rates of 70 % to 80 % were rela- - tive measures of optimum efficiency, and St that size, to a certain extent, deter- % mined both the occupancy rate and the .g average length of inpatient stays. This
9)
a a publication also asserts that the turnover 2 (discharges per bed) rate is sensitive to
2
changes in the occupancy rate and in the length of inpatient stays. The work con- cludes that if a minimum acceptable turnover rate had to be established for
356 Latin America, an occupancy rate of
60% and an average stay of nine days might be selected, since nearly two- thirds of the countries with data available had reached those levels.
Another work, this one by N. E. Massabot published in 1978 (8), pro- posed using graphs to define the limits of the ideal range of bed utilization. This proposed method, like the one described here, charted productivity, length of stay, and bed occupancy. However, the proce- dure required uniform data from each facility studied, and the manner in which the graphs were to be constructed was not described.
The procedure described in this article seeks to employ a modifica- tion of Massabot’s method to provide a tool for assessing hospital performance. The procedure is also designed to em- phasize the contribution that hospital size makes to determining certain perfor- mance levels. For while it is recognized that small hospitals tend to involve rela- tively short average stays and low occu- pancy rates, it is sometimes not recog- nized that the performance of small, medium, and large hospitals should not be compared using the same set of stan- dards .
A
CKNOWLEDGMENTSS
UMMARYRx
FERENCES Various indicators can be usedto gauge a hospital’s quantitative perfor- mance, among them the average per- centage of beds occupied, the average number of discharges per bed over a given period, and the average length of a hospital stay. These indicators are usually examined in isolation for lack of a conve- nient way of examining them together. This article describes a method used in Colombia to combine them so as to get an overview of hospital performance not readily obtainable by other means.
The principal device em-
ployed is a chart in which bed occupancy is measured along one axis, productivity (the number of discharges per bed) is measured along the other, and the aver- age length of stay is indicated by a series of straight lines radiating outward from the origin. This chart is divided into four sectors, one indicating good performance (high bed occupancy and high produc- tivity), another pointing to poor perfor- mance (low bed occupancy and produc- tivity), and the other two suggesting intermediate situations. The chart also indicates when there is a 95 % probabil- ity that a given hospital’s apparent per- formance represents an actual departure from the norm. However, because of marked differences in the performance data from hospitals of different sizes, it has been found desirable to group hospi- tals according to size (in terms of the number of beds installed) and to assess the performance of individual hospitals relative to other hospitals in the same group.
1 Pan American Health Organization. Hqbttah
in the Americas. PAHO Scientific Publication 416. Washington, D.C., 1983.
2 Programa de InvestigaciBn y Desarrollo de Ser- vicios de Salud (PRIDES). Evaluaci6n de 10s servi- cios de salud de la caja de1 Instituto Colom- biano de 10s Seguros Sociales de1 Valle. Mimeographed document. Cali, Colombia, 1976.
3 Chapurri, P. Gr%fica de isoestancias. Uncopied working document of the Research Program for Health Services Development (PRIDES) in the
PRIDES archives. 1975.
4 Programa de Investigacidn y Desarrollo de Ser- vicios de Salud (PRIDES). Estudio de hospitales regionales. Report to the Ministry of Health of Colombia (not copied). 1982.
5 Pan American Health Organization. Heah Planning: Problems of Concept and Method
(CENDES Report). PAHO Scientific Publication 111. Washington, D.C., 1965.
6 Hancock, W. M., D. B. Magerlein, R. H. Storer, and J. B. Martin. Parameters affecting hospital 3 occu ancy and implications for facility sizing. Heath Serv Res 1p 13(3), 1978. 3 7 Torres, S. C., V. J. Rubiano, and R. D. Quin- 5 tana. Promedios de estancia en hospitales re- 2 gionales y Hos ital Universirario de1 Valle. Acta Mgdica de/ Vale 5~55-56, 1974. P &
8 Massabot, N. E. Interpretaci6t-r de 10s indica- 2 dores que miden la utilitaci6n de las camas hos- 2 pitalarias. Revista Cubaca de Administracio’n z
de Sahd4:47-58, 1978. z
E s ? k