Annales
Geophysicae
Solar zenith angle dependencies of F1-layer,
NmF2 negative
disturbance, and G-condition occurrence probabilities
V. V. Lobzin and A. V. Pavlov
Institute of Terrestrial Magnetism, Ionosphere, and Radio-Wave Propagation, Russian Academy of Sciences (IZMIRAN), Troitsk, Moscow Region, 142190, Russia
Received: 10 January 2002 – Revised: 5 April 2002 – Accepted: 28 May 2002
Abstract. Experimental data acquired by the Ionospheric
Digital Database of the National Geophysical Data Center, Boulder, Colorado, from 1957 to 1990, are used to study the dependence of the G condition, F1-layer, andNmF2 nega-tive disturbance occurrence probabilities on the solar zenith angle during summer, winter, spring, and autumn months in latitude range 1 (between−10◦ and+10◦ of the geomag-netic latitude,8), in latitude range 2 (10◦ < |8| ≤ 30◦), in latitude range 3 (30◦ < |ϕ| ≤ 45◦,30◦ < |8| ≤ 45◦), in latitude range 4 (45◦ < |ϕ| ≤ 60◦,45◦ < |8| ≤ 60◦), and in latitude range 5 (60◦ < |8| ≤ 90◦), whereϕ is the geographic latitude. Our calculations show that the G con-dition is more likely to occur during the first half of a day than during the second half of a day, at all latitudes during all seasons for the same value of the solar zenith angle. The F1-layer occurrence probability is larger in the first half of a day in comparison with that in the second half of a day for the same value of the solar zenith angle in latitude range 1 for all seasons, while the F1-layer occurrence probability is ap-proximately the same for the same solar zenith angle before and after noon in latitude ranges 4 and 5. The F1-layer and G condition are more commonly formed near midday than close to post sunrise or pre-sunset. The chance that the day-time F1-layer and G condition will be formed is greater in summer than in winter at the given solar zenith angle in lat-itude ranges 2–5, while the F1-layer occurrence probability is greater in winter than in summer for any solar zenith angle in latitude range 1. The calculated occurrence probability of the NmF2 weak negative disturbances reaches its max-imum and minmax-imum values during daytime and night-time conditions, respectively, and the average night-time value of this probability is less than that by day for all seasons in all studied latitude regions. It is shown that theNmF2 normal, strong, and very strong negative disturbances are more fre-quent on average at night than by day in latitude ranges 1 and 2 for all seasons, reaching their maximum and minimum occurrence probability values at night and by day,
respec-Correspondence to:A. V. Pavlov ([email protected])
tively. This conclusion is also correct for all other studied latitude regions during winter months, except for theNmF2 normal and strong negative disturbances in latitude range 5. A difference in the dependence of the strong and very strong
NmF2 negative disturbance percentage occurrences on the solar zenith angle is found between latitude ranges 1 and 2. Our results provide evidence that the daytime dependence of the G condition occurrence probability on the solar zenith an-gle is determined mainly by the dependence of the F1-layer occurrence probability on the solar zenith angle in the stud-ied latitude regions for winter months, in latitude range 2 for all seasons, and in latitude ranges 4 and 5 for spring, sum-mer, and autumn months. The solar zenith angle trend in the probability of the G condition occurrence in latitude range 3 arises in the main from the solar zenith angle trend in the F1-layer occurrence probability. The solar zenith angle trend in the probabilities of strong and very strong NmF2 nega-tive disturbances counteracts the identified solar zenith angle trend in the probability of the G condition occurrence.
Key words. Ionosphere (ionospheric disturbances,
ionosphere-atmosphere interactions, ion chemistry and composition)
1 Introduction
formed using the URSI standard rules (URSI handbook of ionogram interpretation and reduction, 1978). In addition to numerical values of ionospheric parameters, the qualifying and descriptive letters A–Z are used in this database. The de-scriptive letter G means that a measurement is influenced by, or impossible because, the ionization density of the layer is too small to enable it to be made accurately, and this case is described as a G condition in the F-region of the ionosphere whenfof2≤fof1 (URSI handbook of ionogram interpreta-tion and reducinterpreta-tion, 1978). If the layer is not seen from iono-grams due to other reasons, then other letters are used. The G condition arises in the ionosphere when the critical frequency of the F2-layer drops below that of the F1-layer, i.e. when the peak density,NmF1, of the F1-layer, which is composed mostly of the molecular ions NO+and O2+, is larger than
that of the F2-layer, which is dominated by O+ions (King,
1962). As a result, a very low main peak altitude value (be-low 200 km) is observed in ionograms, so that no information is obtainable above this height from ground-based ionozonde data. As far as the authors know, the first altitude distribution of the electron density during a G condition was deduced by Norton (1969) from ionograms recorded by the Alouette I satellite ionozonde and the St. John’s ground-based iono-zonde during the severe negative ionospheric storm on 18 April 1965.
The physics of the G condition phenomenon has been studied by Buonsanto (1990) using ionosonde data from two mid-latitude stations, by Oliver (1990), using Millstone Hill incoherent scatter radar data, and by Fukao et al. (1991) using data from the middle and upper atmosphere radar in Japan. Pavlov and Buonsanto (1998), Pavlov (1998), Pavlov et al. (1999), Schlesier and Buonsanto (1999), and Pavlov and Foster (2001) studied the G condition formation for quiet and disturbed mid-latitude ionosphere during periods of low, moderate, and high solar activity, using the Millstone Hill in-coherent scatter radar data. Model results also show that O+ can become a minor ion in the F-region, creating a G con-dition during disturbed concon-ditions at high latitudes (Banks et al., 1974; Schunk et al., 1975), and observations at EIS-CAT confirm this conclusion (e.g. H¨aggstr¨om and Collis, 1990). These papers provide evidence that changes in [O], [N2], [O2], and the plasma drift velocity, the effect of the
perpendicular (with respect to the geomagnetic field) com-ponent of the electric field on the electron density (through changes in the rate coefficients of chemical reactions of ions), and the effects of vibrationally excited N2and O2on the
elec-tron density are important factors that control the G condition formation in the ionosphere. The study of the G condition formation in the ionosphere above Millstone Hill during the severe geomagnetic storm of 15–16 July 2000, provided a weighty argument for the inclusion of the effects of vibra-tionally excited N2and O2on the electron density and
tem-perature in ionospheric models (Pavlov and Foster, 2001). During NmF2 disturbances, which are believed to be caused by geomagnetic storms and substorms, the value of
NmF2 can either increase or decrease in comparison with a geomagnetically quietNmF2, and these changes are denoted
as positive and negative disturbances (Pr¨olss, 1995; Buon-santo, 1999). A decrease inNmF2 during aNmF2 negative disturbance leads to an increase in the G condition occur-rence probability if the F1-layer exists. On the other hand, the G condition cannot exist in the ionosphere if there is no F1-layer. The preceding work by Lobzin and Pavlov (2002) summarizes papers addressing the measurements and the physics of the F1-layer,NmF2 negative disturbance, and G condition, and gives for the first time the detailed depen-dencies of the probabilities of the F1-layer,NmF2 negative disturbance, and G condition occurrences on a daily solar ac-tivity index, F10.7, a 3-h geomagnetic index,Kp, a number
of a given day in a year, and a geomagnetic latitude. The aim of this paper is to carry out a statistical study of solar zenith angle dependencies ofNmF1,NmF2 negative distur-bance, and G condition occurrence probabilities using the Digital Databasefof1 andfof2 measurements from 1957 to 1990.
Some features of the solar zenith angle dependencies of
NmF1,NmF2 negative disturbance, and G condition occur-rence frequencies have been known for a long time. Ratcliffe (1956, 1972), Yonezawa et al. (1959) concluded that the F1-layer is less liable to appear for larger values of the solar zenith angle. Du Charme and Petrie (1973) derived an ex-pression to predictfof1, assuming limits for the presence of the F1-layer as a function of the solar zenith angle and of so-lar activity. Scotto et al. (1997) tested the Du Charme and Petrie (1973) formula adopted in the International Reference Ionosphere (IRI) model, taking into account alternative so-lutions for the particular restrictions imposed by the IRI for high values of solar zenith angle. New probability functions to predict the occurrence of the F1-layer have been proposed by Scotto et al. (1997, 1998) to replace the Du Charme and Petrie (1973) formula.
A negative F2 ionospheric storm onset at middle latitudes is most frequently observed in the morning time sector and very rarely in the noon, afternoon, and night-time sectors (Pr¨olss, 1995; Buonsanto, 1999). Wrenn et al. (1987) dis-criminated geomagnetic activity levels as very quiet, quiet, normal, disturbed, and very disturbed conditions. The neg-ative ionospheric storm effect inNmF2 during normal, dis-turbed, and very disturbed conditions is centered at night for very disturbed conditions and during morning hours for nor-mal and disturbed conditions if the ionozondefof2 measure-ments from the Argentine Islands ionozonde station are used (Wrenn et al., 1987). The comparison between the summer
fof2 measurements of the Argentine Islands and Port Stan-ley ionozonde stations leads to the conclusion that the maxi-mumfof2 depression moves from the night-time sector to the morning sector if the latitude of the station is changed from middle to more low latitudes (Wrenn et al., 1987). It is found by Ratcliffe (1972) that the G condition is more commonly formed near midday than during several hours after sunrise or before sunset. However, the results of Ratcliffe (1972) are not formulated in a mathematical form to be used in calcula-tions.
data set from some stations and on theoretical analysis of the main physical processes that form electron density altitude profiles. As a result, except for the Scotto et al. (1997, 1998) formulas for the F1-layer probability function, there are no published solar zenith angle dependencies ofNmF1,NmF2 negative disturbance, and G condition occurrence probabil-ities. The main purpose of this work is to calculate for the first time these probabilities for low, middle, and high lati-tudes in summer, in winter, and during the spring and autumn months, to provide some quantitative measure of these prob-ability variations. In our analysis we study for the first time a possible relationship between the solar zenith angle probabil-ity dependence of the G condition occurrence with the solar zenith angle probability dependencies ofNmF2 negative dis-turbance and F1-layer occurrences.
2 Formation of the F1- and F2-layers in the ionosphere
Solar zenith angle dependencies ofNmF1 andNmF2 negative disturbance and G condition occurrence probabilities, which are studied in our work, are determined by physical processes that form the F-region of the ionosphere. The F-region is lo-cated in the altitude range above 140–160 km. Within the F-region are the F1- and F2-layers, with the peak altitudes
hmF1< 190−200 km andhmF2> 200−210 km, respec-tively. The major F1- and F2-layer ions are O+(4S), O+2, and NO+. The main physical processes that form the F1 and F2-layers in the ionosphere by a balance between produc-tion, chemical loss, and transport of electrons and ions are described in many review articles, books, and papers (e.g. Ratcliffe, 1972; Rishbeth and Garriot, 1969; Brunelli and Namgaladze, 1988; Rees, 1989; Fejer, 1997; Rishbeth and Muller-Wodarg, 1999; Rishbeth, 2000; Rishbeth et al., 2000; Abdu, 2001; Lobzin and Pavlov, 2002; Pavlov and Foster, 2001). Following these studies, it is usually supposed that the value ofNmF2 is approximately directly proportional to the [O]/L ratio at⁀hmF2 during daytime conditions, where L is the loss rate of O+(4S) ions in the reactions of O+(4S) with unexcited N2(v = 0) and O2(v = 0) and vibrationally
ex-cited N2(v) and O2(v) molecules at vibrational levels,v >0.
Thus, the depletion in [O] and the increase in [N2] and [O2]
can lead to a negative phase in NmF2. The increase in the rate coefficients for reactions between O+(4S) ions and N2(v≥0) and O2(v ≥0), due to changes in neutral and ion
temperatures and due to the increase in vibrational tempera-tures of N2and O2would also produce negative storm effects
inNmF2. These assumptions are used in our study in discus-sions ofNmF2 variation sources and to understand reasons for solar zenith angle dependencies ofNmF2 negative distur-bance and G condition occurrence probabilities.
To illustrate the basic physics involved and to study the physical reasons forNmF2 negative disturbance occurrence probability nighttime variations, it is useful to use the analyt-ical approximation of the nighttime mid-latitudeNmF2 given by Krinberg and Tashchilin (1982, 1984) as
NmF2(t )≈NmF2(t0)exp [−(t−t0)L(t )]
+3F∞(t )Tn(t )νin(t )/ (g[Ti(t )+Te(t )]) , (1)
wheret is a local time,NmF2(t0) is the ionospheric electron
density for the local timet0corresponding to dusk,Tnis the
exospheric neutral temperature,Ti andTe are ion and
elec-tron temperatures,gis the acceleration due to gravity,νinis
the O+−O collision frequency,F∞is the value of plasma
ion flux flowing from the plasmasphere into the ionosphere, the values ofL,Ti,Te,g, andνinare chosen at the F2 peak
altitude.
One can see from Eq. (1) that the nighttime F2-region elec-tron density consists of two parts. The first term describes the role of the daytime ionization in the maintenance of the nighttime ionosphere. In this case the F-region would de-cay with the characteristic time∼L−1(about several hours). Since the loss rate of O+(4S) ions is proportional to [N
2]
and [O2], an increase or decrease in [N2] and [O2] athmF2⁀
altitudes leads to a decrease or an increase inNmF2, respec-tively. The nocturnal F-region is also maintained by a down-ward flow of ionization from the plasmasphere, described by the second term in Eq. (1). In winter, and possibly in spring and in autumn, when the night is long enough, the role of the second term in Eq. (1) increases before sunrise, and this term can determine the mid-latitude value ofNmF2.
The role of the ion transport is less than the role of the chemical reactions of ions with electrons and neutral compo-nents of the upper atmosphere at the F1-layer altitudes, and the production and loss rates of electrons and ions that deter-mine the F1-layer formation. To study the formation of the F1-layer, Ratcliffe (1972) assumed that the main source of NO+ions is the chemical reaction of O+with N
2, and there
are only NO+and O+ions. Ratcliffe (1972) found that the peak of the F1-layer exists in the ionosphere if the peak alti-tude,h0, of the total production rate of thermal electrons is
less than an altitude,ht. The value ofht is determined from
the condition ofK [N2] =α[e], whereK is the rate
coeffi-cient for the reaction of O+ions with N2, andαis the rate
coefficient of the dissociative recombination of NO+ ions. Ratcliffe (1972) concluded that the value ofht −h0is
de-creased with the solar activity level increase, and the value of ht −h0has a maximum value close to midday. As a result,
the F1 peak is more clearly in evidence at solar minimum than at solar maximum, and the F1 peak is more commonly formed near midday and in summer (Ratcliffe, 1972).
Yonezawa et al. (1959) carried out another simple consid-eration for the F1-layer to appear as a distinct layer. In addi-tion to the equality ofαand the rate coefficient of the disso-ciative recombination of O+2 ions, the height gradient of the atmospheric neutral components, the rate coefficients of O+ ions with N2and O2, and the value ofαwere assumed to be
constants by Yonezawa et al. (1959), to obtain the condition of appearance of the F1-layer as
(αQ0)0.5<0.089L(h=h0)(cosχ )1.65, (2)
where Q0 is the maximum production rate of electron-ion
Using Eq. (2), Yonezawa et al. (1959) concluded that the F1-layer is more liable to appear during periods of low solar activity than during periods of high solar activity, and dur-ing the day near noon than near sunrise or sunset. It fol-lows from Eq. (2) that theNmF1 occurrence probability ap-proaches 100% if Eq. (2) is valid and 0% if Eq. (2) is not realized in the ionosphere.
The ionosphere at low latitudes is very sensitive to electric fields. The daytime low latitude electric field that is directed eastward causes the ionosphere to be lifted to high altitudes along magnetic field lines, where there is a very rapid dif-fusion of electrons and ions, and gravity pull the electrons and ions downward and poleward on either side of the mag-netic equator, so that a low latitude trough develops over the equator, with the F2-layer density maximum to the north and south (Rishbeth, 2000; Abdu, 2001). This F2-layer structure is usually called the equatorial or Appleton anomaly. If the daytime eastward electric field is strengthened or weakened during geomagnetic storms and substorms, the F2-layer den-sity maximum move further poleward or equatorward, and the ionospheric density over the equator is reduced or in-creased, respectively. It is remarkable that the upward drift by day is balanced by a downward drift at night, andhmF2 is lower at night than by day at low latitudes, while the middle latitudehmF2 is higher at night than by day. According to Sterling et al. (1972), the low-latitude F1-layer is caused by the electromagnetic drift, rather than by an effect of F1-layer photochemistry.
3 Data and method of data analysis
Ionograms produced by ionozondes are records that show variations of the virtual height of radio wave reflection from the ionosphere as a function of the radio frequency, h′(f ), within the frequency band range 1 MHz–20 MHz that is nor-mally used (URSI handbook of ionogram interpretation and reduction, 1978). The radio wave that is reflected from the ionosphere level of ionization is split into two waves of dif-ferent polarization in the Earth’s magnetic field, thereby lead-ing to two sorts of observed h′(f ) curves. These waves are called the ordinary wave (o-mode) and the extraordinary wave (x-mode). There are alsoz-mode traces on some iono-grams generated by radio waves which have been propagated along the magnetic field lines. The mode traces can be iden-tified by the frequency separation and by other indications presented in the URSI handbook of ionogram interpretation and reduction (1978). A simple approach is used to find peak electron densities of the ionosphere from observations ofh′(f )curves. When the level of the peak electron density in the layer is reached, the value ofh′(f )becomes effectively infinite (dhdf′ →0). The frequency at which this occurs is de-termined as the critical frequency of the ionospheric layer.
Our analysis is based on 34 years of hourlyfof2 andfof1 data from 1957 to 1990 from stations available on the Iono-spheric Digital Database of the National Geophysical Data Center, Boulder, Colorado. At the chosen ionozonde
sta-tion, the solar zenith angle,χ, is a function of a local time, a geographic latitude, and a number, nd, of a given day in
a year. Therefore, a multiple-parameter statistics is needed to study the solar zenith angle dependencies ofNmF2 nega-tive disturbance,NmF1, and G condition occurrences. We do not analyze the ionozonde measurements offof2 andfof1 in the Northern Hemisphere and the Southern Hemisphere sep-arately, but carry out our statistical analysis of solar zenith angle dependencies of NmF1, NmF2 negative disturbance, and G condition occurrences separately in summer (June, July, and August in the Northern Hemisphere, and Decem-ber, January, and February in the Southern Hemisphere), in winter (December, January, and February in the North-ern Hemisphere, and June, July, and August in the SouthNorth-ern Hemisphere), and during spring and autumn months (March, April, May, September, October, and November in both hemispheres).
As we have pointed out, the solar zenith angle is a function of geographic latitude,ϕ. Therefore, to study the solar zenith angle dependencies ofNmF2 negative disturbance, F1-layer, and G condition occurrences, the geographic latitude range has to be taken so that this range is minimized, while the number of measurements remains large enough to carry out this statistical study. On the other hand, there are significant differences in physical processes that determineNmF2 nega-tive disturbance,NmF1, and G condition occurrences at low, middle, and high geomagnetic latitudes, 8(e.g. Ratcliffe, 1972; Rishbeth and Garriot, 1969; Brunelli and Namgaladze, 1988; Rees, 1989; Fejer, 1997; Rishbeth and Muller-Wodarg, 1999; Rishbeth et al., 2000; Lobzin and Pavlov, 2002), and these differences can lead to differences in the solar zenith angle dependencies of the studied events. Therefore, we split the ionozondefof2 andfof1 data set used into five parts. A geomagnetic equatorial region (−10◦ ≤ 8 ≤ 10◦), where an equatorial daytimeNmF2 trough is developed, is defined in our study as a latitude range 1. A latitude range 2 is a low-latitude region (10◦ < |8| ≤ 30◦) where daytime
NmF2 crests in comparison when equatorial daytimeNmF2 are observed. Latitude ranges 3 and 4 are mid-latitude re-gions. A latitude range 3 includes both 30◦ < |ϕ| ≤ 45◦ and 30◦ < |8| ≤ 45◦. A latitude range 4 includes both 45◦<|ϕ| ≤60◦and 45◦ <|8| ≤60◦. It is clear from the definition of these mid-latitude ranges that latitude ranges 3 and 4 are not overlapping.
The main ionization trough, the ionization hole in the po-lar cap around local dawn, the tongue of ionization, and the aurorally produced ionization electron density peak in the vicinity of the auroral oval are a natural consequence of the difference and competition between the various chem-ical and transport processes known to be operating in the high-latitude F-region ionosphere (for more details, see, e.g. Rees, 1989; Buonsanto, 1999). The latitude and longitude boundaries of these regions show marked variations. As a result, only average solar zenith angle dependencies of
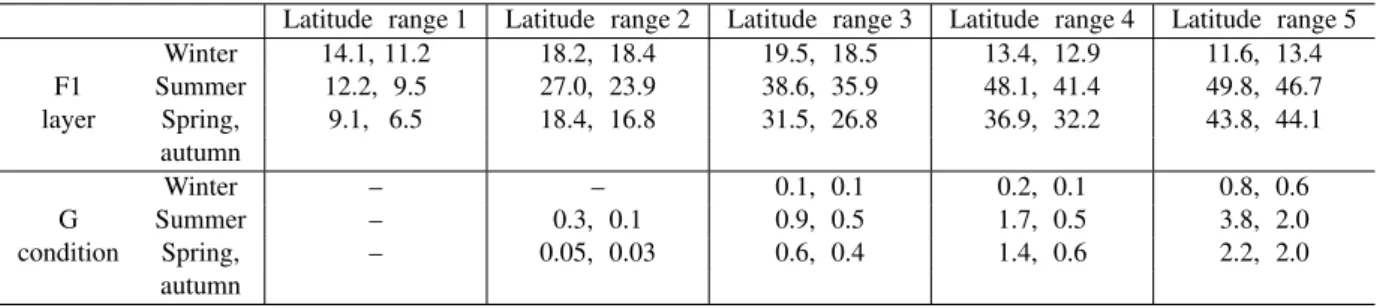
Table 1.Average values of F1-layer and G condition percentage occurrences in latitude ranges 1–5 during the winter, summer, and spring and autumn months for the first (first number) and second (second number) half of the day forχ≤90◦
Latitude range 1 Latitude range 2 Latitude range 3 Latitude range 4 Latitude range 5 Winter 14.1, 11.2 18.2, 18.4 19.5, 18.5 13.4, 12.9 11.6, 13.4 F1 Summer 12.2, 9.5 27.0, 23.9 38.6, 35.9 48.1, 41.4 49.8, 46.7 layer Spring, 9.1, 6.5 18.4, 16.8 31.5, 26.8 36.9, 32.2 43.8, 44.1
autumn
Winter – – 0.1, 0.1 0.2, 0.1 0.8, 0.6 G Summer – 0.3, 0.1 0.9, 0.5 1.7, 0.5 3.8, 2.0 condition Spring, – 0.05, 0.03 0.6, 0.4 1.4, 0.6 2.2, 2.0
autumn
morning and evening solar zenith angle dependencies of the studied events, we split the range of 0◦ ≤ χ ≤ 180◦ into twelve intervals of the same length,1χ, both from 00:00 LT to 12:00 LT, and from 12:00 LT to 24:00 LT at each iono-zonde station.
We consider the measuredfof1 andfof2 within the above-determined local time, latitude, and month range, and deter-mine the probability,9G(χ ), or9F1(χ ), of the G condition
or F1-layer occurrence as a ratio of the number of G condi-tion or F1-layer observacondi-tions for zenith angles within the1χ interval to a total number of measurements for the same1χ and within the given local time, latitude, and month range.
The electron density can either decrease or increase dur-ing geomagnetically disturbed conditions, and these electron density changes are denoted as negative and positive iono-spheric disturbances, respectively. To test the effects of ge-omagnetic activity, we use two different Kp labels:
“dis-turbed”, for which we takeKp > 3 and use the peak
den-sity,NmF2(d), and critical frequency,fof2(d), of the F2-layer observed during the time periods withKp >3, and “quiet”,
for which we takeKp ≤ 3. The determination of the quiet
peak density,NmF2(q), and critical frequency,fof2(q), of the F2-layer, is crucial for studies of negative and positive iono-spheric disturbances.
Perturbations in the neutral composition, temperature, and wind at one altitude are rapidly transmitted to higher and lower altitudes. However, it takes time to relax back to an initial state of the thermosphere, and this thermosphere re-laxation determines the time for the disturbed ionosphere to relax back to the quiet state. It means that not everyfof2 observed during the day with Kp ≤ 3 can be considered
asfof2(q). The characteristic time of the neutral composition recovery after a storm impulse event ranges from 7 to 12 h on average (Hedin, 1987), while it may need up to several days for all altitudes down to 120 km in the atmosphere to recover completely back to the undisturbed state of the atmosphere (Richmond and Lu, 2000). As a result of this thermosphere recovery, a day with Kp ≤ 3 from 00:00 UT to 24:00 UT
cannot be considered a quiet day if the previous day was a day withKp >3 from 00:00 UT to 24:00 UT. We determine
the quiet reference day withfof2(q) as a day withKp ≤ 3
from 00:00 UT to 24:00 UT if the previous day was a day withKp ≤ 3 from 00:00 UT to 24:00 UT. Furthermore, we
only use the quiet day with the uninterruptedfof2 measure-ments from 00:00 UT to 24:00 UT, and the comparison be-tweenfof2(d) andfof2(q) measured at the chosen station is carried out if the time difference betweenfof2(d) andfof2(q) measurements is less than or equal to 30 days. We use the nearest quiet day to the studied disturbed time period, and determine the relative deviation,δ, of fof2 observed at the given station fromfof2(q) as
δ=fof2(d)/fof2(q)−1=(NmF2(d)/NmF2(q))1/2−1.(3) Negative and positive values ofδ correspond to negative and positive disturbances inNmF2, respectively. We study the dependence of the probabilities of the negative distur-bance occurrences in NmF2 on χ. Following the preced-ing work by Lobzin and Pavlov (2002), we give negative
fof2 disturbances the labels “weak” (−0.1 < δ < 0 or 0.81<NmF2(d)/NmF2(q)<1), “normal” (−0.3 < δ ≤ −0.1 or 0.49<NmF2(d)/NmF2(q)≤ 0.81), “strong” (0.5 < δ ≤ −0.3 or 0.25<NmF2(d)/NmF2(q)≤0.49), and “very strong” (δ≤ −0.5 orNmF2(d)/NmF2(q)≤0.25), and confine our at-tention to relationships between them and the G condition or F1-layer occurrences.
Similar to the 9G(χ ) and 9F1(χ ) determinations, we
analyze the measured fof1 and fof2 within each above-determined latitude, month and local time range. We de-termine the probability,9δ1≤δ≤δ0(χ ), of theNmF2 negative
disturbance occurrence as a ratio of a number ofNmF2 neg-ative disturbance observations within theδ1≤δ≤δ0 range for zenith angles within the1χinterval to a total number of studiedNmF2 negative and positive disturbance observations for the same1χ, within the given latitude, month, and local time range.
4 Results and discussion
160 120 80 40 0 0
10 20 30
ΨF1
(%
)
0 40 80 120 160
Solar zenith angle (deg)
g
00:00-12:00 LT 12:00-24:00 LT
Fig. 1.The dependence of the F1-layer percentage occurrences on the solar zenith angle in latitude range 1 (|8| ≤ 10◦) during the winter (solid lines), summer (dashed lines), and spring and autumn (dotted lines) months. The 0◦−180◦solar zenith angle range in-cludes the local time period from 00:00 LT to 12:00 LT (left panel) and from 12:00 LT to 24:00 LT (right panel).
of the hourly fof2 disturbance measurements has no refer-ence quiet days, in agreement with the quiet day definition accepted in our paper, and these hourlyfof2 measurements are not analyzed.
Average values of 9F1(χ ) and9G(χ ) are presented in
Table 1. For each studied latitude range and season, the first number is determined as an average value,< 9F1(χ ) >1, of 9F1(χ )or an average value,< 9G(χ ) >1, of9G(χ )for the
first half of a day forχ ≤90◦, while the second number is determined as an average value,< 9F1(χ ) >2, of9F1(χ)
or an average value,< 9G(χ ) >2, of9G(χ )for the second
half of a day forχ ≤90◦. Table 1 shows that< 9
F1(χ ) >2
is less than< 9F1(χ ) >1, except for latitude range 5
dur-ing the winter, sprdur-ing, and autumn months. Our calculations show that< 9G(χ ) >2is less than< 9G(χ ) >1in
lati-tude ranges 2–5 for all seasons, except for latilati-tude range 3 in winter. For latitude range 3,< 9G(χ ) >2is approximately
equal to< 9G(χ ) >1for all seasons.
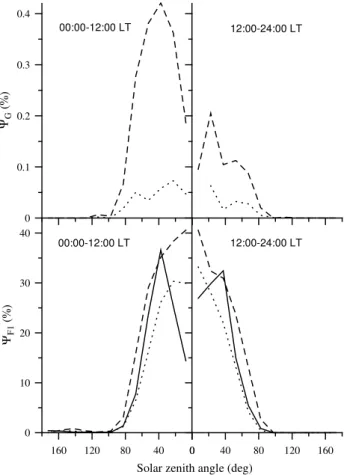
The dependencies of the F1-layer percentage occurrences on the solar zenith angle in latitude range 1 are shown in Fig. 1 for the local time period from 00:00 LT to 12:00 LT (left panel) and from 12:00 LT to 24:00 LT (right panel). Fig-ures 2–5 show the dependence of the F1-layer (bottom pan-els) and G condition (top panpan-els) percentage occurrence on the solar zenith angle in latitude range 2 (Fig. 2), in latitude range 3 (Fig. 3), in latitude range 4 (Fig. 4), and in lati-tude range 5 (Fig. 5), during the winter (solid lines), summer (dashed lines), and spring and autumn (dotted lines) months. The left panels of Figs. 2–5 represent the F1-layer and G condition percentage occurrence from 00:00 LT to 12:00 LT, while the right panels of Figs. 2–5 give the F1-layer and G condition percentage occurrence from 12:00 LT to 24:00 LT. It should be noted that the calculated value of the G condition
0 0.1 0.2 0.3 0.4
ΨG
(%
)
160 120 80 40 0 0
10 20 30 40
ΨF1
(%)
0 40 80 120 160
Solar zenith angle (deg)
00:00-12:00 LT 12:00-24:00 LT
00:00-12:00 LT 12:00-24:00 LT
Fig. 2.The dependence of the F1-layer (two bottom panels), and G condition (two top panels) probability functions on the solar zenith angle in latitude range 2 (10◦<|8| ≤30◦) during the winter (solid lines), summer (dashed lines), and spring and autumn (dotted lines) months before midday from 00:00 LT to 12:00 LT (left panels), and after midday from 12:00 LT to 24:00 LT (right panels).
occurrence probability is negligible above the geomagnetic equatorial region (latitude range 1) during all seasons and in latitude range 2 in winter. Therefore, the9G(χ )
dependen-cies are not discussed in this work for these cases.
Figures 2–5 show that the G condition is more likely to occur during the first half of a day than during the second half of a day in latitude ranges 2–5 during all seasons for the same value of the solar zenith angle, except for latitude range 3 in winter, when the G condition occurrence probability is approximately the same for the same solar zenith angle be-fore and after 12:00 LT. The F1-layer occurrence probability is larger in the first half of a day in comparison with that in the second half of a day for the same value of the solar zenith angle within latitude range 1 for all seasons, while the F1-layer occurrence probability is approximately the same for the same solar zenith angle before and after 12:00 LT in lati-tude ranges 4 and 5.
0 0.4 0.8 1.2
ΨG
(%
)
160 120 80 40 0 0
20 40
ΨF1
(%)
0 40 80 120 160
Solar zenith angle (deg) 00:00-12:00 LT
00:00-12:00 LT
12:00-24:00 LT
12:00-24:00 LT
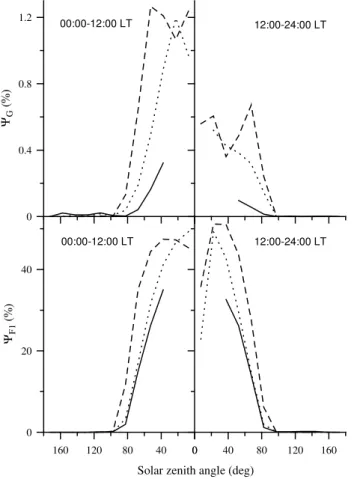
Fig. 3.The dependence of the F1-layer (bottom panels), and G con-dition (top panels) probability functions on the solar zenith angle in latitude range 3 (30◦ <|ϕ| ≤ 45◦,30◦< |8| ≤45◦) during the winter (solid lines), summer (dashed lines), and spring and autumn (dotted lines) months before midday from 00:00 LT to 12:00 LT (left panels), and after midday from 12:00 LT to 24:00 LT (right panels).
of previous studies (for more details, see, for example, Rat-cliffe, 1956, 1972; Yonezawa et. al., 1959; Polyakov et al., 1968) based on the theoretical studies and the limited data set. Figures 1–5 provide for the first time the quantitative measure of the probability variations with solar zenith angle changes. Figures 1–4 show that the maximum values of the F1-layer and G condition occurrence probabilities are located in the 0◦−45◦solar zenith angle range in latitude ranges 1–4. The maximum values of the F1-layer and G condition occur-rence probabilities are realized for the minimum value ofχ close to noon in latitude range 5 (see Fig. 5). At the mini-mum solar zenith angle values (see Figs. 2–3), the number of observations is large enough for the identifiable oscillations in the probabilities at these solar zenith angles to be statisti-cally significant. The physical reasons for the occurence of these oscillations are unclear.
The comparison in the values of9F1(χ )and9G(χ )
be-tween the five latitude regions described above shows the daytime tendency for a decrease in these probabilities at low latitudes and an increase in these probabilities at high lati-tudes for all seasons.
0 1 2
ΨG
(%
)
160 120 80 40 0 0
20 40 60
ΨF1
(%)
0 40 80 120 160
Solar zenith angle (deg)
12:00-24:00 LT
12:00-24:00 LT 00:00-12:00 LT
00:00-12:00 LT
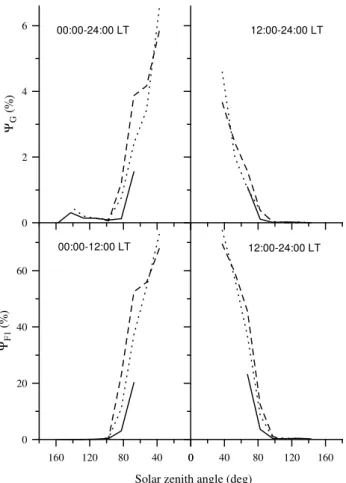
Fig. 4.The dependence of the F1-layer (bottom panels), and G con-dition (top panels) probability functions on the solar zenith angle in latitude range 4 (45◦ < |ϕ| ≤60◦,45◦ <|8| ≤60◦) during the winter (solid lines), summer (dashed lines), and spring and autumn (dotted lines) months before midday from 00:00 LT to 12:00 LT (left panels), and after midday from 12:00 LT to 24:00 LT (right panels).
0 2 4 6
ΨG
(%
)
160 120 80 40 0 0
20 40 60
ΨF1
(%)
0 40 80 120 160
Solar zenith angle (deg)
00:00-24:00 LT 12:00-24:00 LT
00:00-12:00 LT 12:00-24:00 LT
Fig. 5.The dependence of the F1-layer (bottom panels), and G con-dition (top panels) probability functions on the solar zenith angle in latitude range 5 (60◦ < |8| ≤ 90◦) during the winter (solid lines), summer (dashed lines), and spring and autumn (dotted lines) months before midday from 00:00 LT to 12:00 LT (left panels), and after midday from 12:00 LT to 24:00 LT (right panels).
the summer months for most of the solar zenith angle range in latitude ranges 3–5 (compare dotted and dashed lines of Figs. 3–5).
Scotto et al. (1998) found that the probability of evaluating the occurrence of the F1-layer can be presented as
PS(8, χ )=100(1−(χ /90))K forχ <90◦,
andPS(8, χ )=0 forχ≤90◦, (4)
whereK=6.42182−0.0025247982+4.02531×10−784,
and the unit of PS is percent. The analysis of Scotto et
al. (1998) was based on data acquired by the Ionospheric Digital Database of the National Geophysical Data Cen-ter, Boulder, Colorado, from 1969 to 1990. The value of PS(8, χ) approaches 100% forχ =0◦and 0% forχ=90◦.
By comparing the dependence of the F1-layer occurrence probability on the solar zenith angle found in our work in each latitude range with PS(8, χ), we conclude that PS(8, χ ) overestimates the real value of the F1-layer
oc-currence probability shown in Figs. 1–5. For example, 80% ≤PS(8, χ )≤100% for 0◦≤χ ≤52◦in the geomagnetic
latitude range of−45◦ ≤8≤ 45◦, which includes latitude
ranges 1–3 with the F1-layer occurrence probability shown in Figs. 1–3. It is also unclear why there are no seasonal differences in the dependence of PSonχ. The details of
de-riving Eq. (4) are not presented in the short paper by Scotto et al. (1998), and we cannot give an explanation of the iden-tifiable differences between our results andPS(8, χ ).
4.2 NmF2 normal, strong and very strong negative distur-bance occurrence probabilities
Average values of all studied NmF2 negative disturbance probabilities calculated in all latitude ranges and during all seasons are presented in Table 2. For each sort of
NmF2 negative disturbance, studied latitude range and sea-son, the first number is determined as an average value, < 9δ1≤δ≤δ0(χ ) >1of9δ1≤δ≤δ0(χ )for the first half of a day
forχ ≤ 90◦, while the second number is determined as an average value, < 9δ1≤δ≤δ0(χ ) >2, of9δ1≤δ≤δ0(χ )for the
second half of a day forχ ≤90◦. The third number is deter-mined as an average value of9δ1≤δ≤δ0(χ )for the night-time
period forχ >90◦. An average daytime value of anyNmF2 negative disturbance probability is calculated as a half-sum of the first and second numbers given in Table 2.
Table 2 shows that < 9δ1≤δ≤δ0(χ ) >2 is less than
the < 9δ1≤δ≤δ0(χ ) >1 for the normal, strong or very
strong NmF2 negative disturbances in latitude ranges 3–5 for all seasons, except for the very strong NmF2 negative disturbances in latitude ranges 3 in the winter and in latitude range 5 during winter, spring, and autumn months, when < 9δ≤−0.5(χ ) >2 is approximately equal
to < 9δ≤−0.5(χ ) >1. In opposition to latitude ranges
3–5, < 9δ≤−0.5(χ ) >1 is less than < 9δ≤−0.5(χ ) >2
for the normal, strong, and very strong NmF2 negative disturbances in latitude ranges 1 and 2 in winter, except for the very strong NmF2 negative disturbances in latitude range 2 during all seasons and that in latitude range 1 during the summer and winter months. We found that < 9δ≤−0.5(χ ) >1 is approximately equal to < 9δ≤−0.5(χ ) >2in latitude range 2 during all seasons.
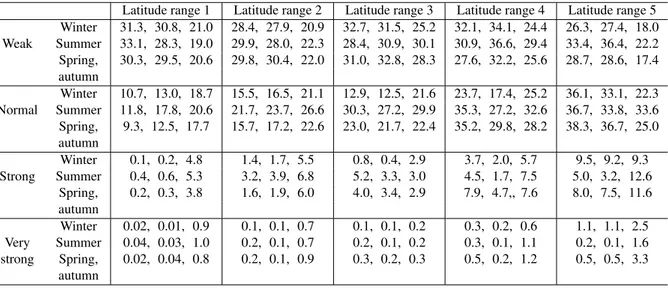
sea-Table 2.Average values of weak, normal, strong, and very strongNmF2 negative disturbance percentage occurrence in latitude ranges 1–5 during the winter, summer, and spring and autumn months for the first (first number) and second (second number) half of a day forχ≤90◦, and during the night-time period forχ >90◦(third number)
Latitude range 1 Latitude range 2 Latitude range 3 Latitude range 4 Latitude range 5 Winter 31.3, 30.8, 21.0 28.4, 27.9, 20.9 32.7, 31.5, 25.2 32.1, 34.1, 24.4 26.3, 27.4, 18.0 Weak Summer 33.1, 28.3, 19.0 29.9, 28.0, 22.3 28.4, 30.9, 30.1 30.9, 36.6, 29.4 33.4, 36.4, 22.2 Spring, 30.3, 29.5, 20.6 29.8, 30.4, 22.0 31.0, 32.8, 28.3 27.6, 32.2, 25.6 28.7, 28.6, 17.4 autumn
Winter 10.7, 13.0, 18.7 15.5, 16.5, 21.1 12.9, 12.5, 21.6 23.7, 17.4, 25.2 36.1, 33.1, 22.3 Normal Summer 11.8, 17.8, 20.6 21.7, 23.7, 26.6 30.3, 27.2, 29.9 35.3, 27.2, 32.6 36.7, 33.8, 33.6 Spring, 9.3, 12.5, 17.7 15.7, 17.2, 22.6 23.0, 21.7, 22.4 35.2, 29.8, 28.2 38.3, 36.7, 25.0 autumn
Winter 0.1, 0.2, 4.8 1.4, 1.7, 5.5 0.8, 0.4, 2.9 3.7, 2.0, 5.7 9.5, 9.2, 9.3 Strong Summer 0.4, 0.6, 5.3 3.2, 3.9, 6.8 5.2, 3.3, 3.0 4.5, 1.7, 7.5 5.0, 3.2, 12.6
Spring, 0.2, 0.3, 3.8 1.6, 1.9, 6.0 4.0, 3.4, 2.9 7.9, 4.7,, 7.6 8.0, 7.5, 11.6 autumn
Winter 0.02, 0.01, 0.9 0.1, 0.1, 0.7 0.1, 0.1, 0.2 0.3, 0.2, 0.6 1.1, 1.1, 2.5 Very Summer 0.04, 0.03, 1.0 0.2, 0.1, 0.7 0.2, 0.1, 0.2 0.3, 0.1, 1.1 0.2, 0.1, 1.6 strong Spring, 0.02, 0.04, 0.8 0.2, 0.1, 0.9 0.3, 0.2, 0.3 0.5, 0.2, 1.2 0.5, 0.5, 3.3
autumn
son average dependencies of theNmF2 negative disturbance probability functions on the geomagnetic latitude forδ <0, δ≤ −0.1,δ≤ −0.3, andδ≤ −0.5.
Table 2 and Figs. 6 and 7 show that the NmF2 normal, strong, and very strong negative disturbances are more fre-quent on average at night than by day in latitude ranges 1 and 2 for all seasons, reaching their maximum and minimum oc-currence probability values at night and by day, respectively. This conclusion is also correct for all other studied latitude regions during the winter months (see Table 2 and solid lines in Figs. 8–10), except for theNmF2 normal and strong nega-tive disturbances in latitude range 5 (see Figs. 10b, c). Table 2 and the dashed and dotted lines in Figs. 9c, d and Figs. 10c, d show that the average night-time occurrence probability is larger than the average daytime occurrence probability for the strong and very strong negative disturbances in lat-itude ranges 4 and 5 during the summer, spring, and autumn months.
The Joule heating of the thermosphere can be viewed as the frictional heating produced in the thermosphere as the rapidly convecting ions collide with neutral molecules. Most of the Joule heating is deposited in the 115–150 km altitude region, although some extends to higher altitudes (Richmond and Lu, 2000). The geomagnetic storm Joule heating of the thermosphere is considerably more effective than the energy of the auroral electrons in affecting the thermospheric circu-lation and in the increase in the neutral temperature (Rich-mond and Lu, 2000). Joule heating from the dissipation of ionospheric currents raises the neutral temperature of the up-per thermosphere, and the ion drag drives the high-velocity neutral winds during geomagnetic storms at high latitudes (Pr¨olss, 1980, 1995; Fuller-Rowell et al., 1996, 2000). It leads to generation of a disturbed composition zone of the high-latitude neutral atmosphere, with an increase in heavier gases and a decrease in lighter gases, i.e. with an increase in
[N2] and [O2] and in the [N2]/[O] and [O2]/[O] ratios. The
wind surge propagates from aurora regions to low latitudes in both hemispheres. As a result, thermospheric altitude dis-tributions of neutral species at middle and low latitudes are influenced by a global, large-scale wind circulation which is produced by a geomagnetic storm energy input at high lati-tudes (theoretical and observational studies of thermospheric composition responses to the transport of neutral species from auroral regions to middle latitudes during geomagnetic storms are reviewed by Pr¨olss, 1980, 1995). The increase in the [N2]/[O] ratio maximises in a region that is roughly
located in the vicinity of the auroral oval, and this [N2]/[O]
increase intensifies and can expand to middle magnetic lati-tudes with theKpincrease (Brunelli and Namgaladze, 1988;
Pr¨olss, 1980, 1995; Zuzic et al., 1997; Buonsanto, 1999). The high-latitude geomagnetic storm upwelling brings air rich in the heavy species N2 and O2 to high altitudes, and the geomagnetic storm circulation carries this N2and O2-rich air
to mid-latitudes and lower latitudes. The geomagnetic storm downwelling leads to the opposite effect: air with low values of [N2] and [O2] is carried downward, reducing their
con-centrations at all altitudes (e.g. Fuller-Rowell et al., 1996; Field et al., 1998; Richmond and Lu, 2000). Thus, the values of [N2] and [O2], and the [N2]/[O] and the [O2]/[O] ratios
are more enhanced at high latitudes than at middle latitudes, contributing to moreNmF2 decreases at high latitudes than at middle latitudes. The geomagnetic storm N2and O2
num-ber densities, and the [N2]/[O] and the [O2]/[O] ratios are
depleted at low latitudes, causingNmF2 increases at low lati-tudes. As a result, the daytime and night-time latitude trends in the probabilities ofNmF2 negative disturbances shown in Figs. 6–10 can arise from these latitude trends in [N2], [O2],
[N2]/[O], and [O2]/[O].
20 30
Ψ −0
.1
<δ
<0
(%)
10 20
Ψ −0
.3<δ≤−0
.1
(%)
Solar zenith angle (deg)
g
0 2 4 6
Ψ −0
.5
<δ
≤−
0.
3
(%)
160 120 80 40 0 0
0.5 1 1.5
Ψ δ≤−
0.5
(%)
0 40 80 120 160 00:00-12:00 LT 12:00-24:00 LT
b b
c c a a
d d
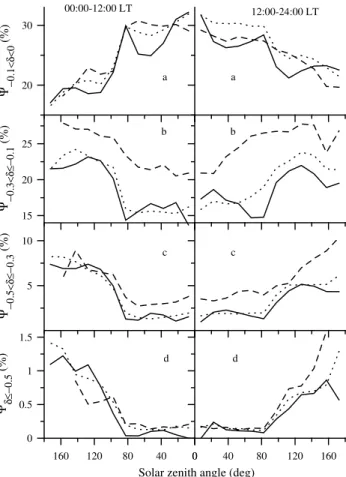
Fig. 6.The dependence of theNmF2 negative disturbance probabil-ity functions on the solar zenith angle in latitude range 1 (|8| ≤
10◦) during the winter (solid lines), summer (dashed lines), and spring and autumn (dotted lines) months for the weak (panels a), normal (panels b), strong (panels c), and very strong (panels d)
NmF2 negative disturbances. The 0◦−180◦solar zenith angle range includes the local time period from 00:00 LT to 12:00 LT (left pan-els) and from 12:00 LT to 24:00 LT (right panpan-els).
transport of neutral composition changes to lower latitudes. The resulting equatorward wind is stronger at night, because the additional geomagnetic storm equatorward wind is added to the quiet day-to-night circulation and because the addi-tional wind is reinforced by antisunward ion drag due to magnetospheric convectionE×Bdrifts (Straus and Schulz, 1976; Babcock and Evans, 1979). As a result, the neutral composition disturbance zone reaches more lower latitudes at night than by day, and theNmF2 normal, strong and very strong negative disturbances tend to be more frequent on av-erage at night than by day in latitude ranges 1 and 2 for all seasons (see Figs. 6 and 7). On the other hand, a rise in
hmF2 to regions with a reduced loss rate of O+(4S) ions due to equatorward winds produces an increase inNmF2, while a drop inhmF2 due to poleward winds reducesNmF2. This competition between a neutral composition disturbance caus-ingNmF2 negative storm effects and a rise inhmF2 causing
NmF2 positive storm effects determines the complicated de-pendence of the normal, strong and very strongNmF2
neg-20 30
Ψ −0
.1
<δ
<0
(%)
15 20 25
Ψ −0.
3<δ≤−0
.1
(%)
Solar zenith angle (deg)
5 10
Ψ −0
.5<δ≤−0
.3
(%)
160 120 80 40 0 0
0.5 1 1.5
Ψ δ≤
−0.
5
(%)
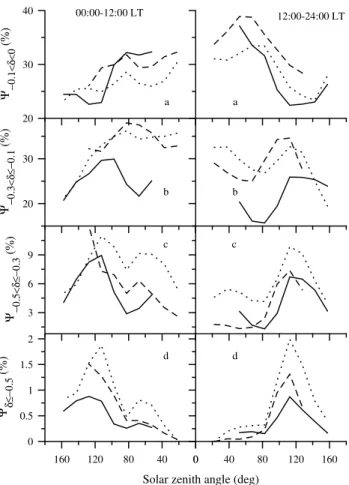
0 40 80 120 160 00:00-12:00 LT 12:00-24:00 LT
a a
b b
c c
d d
Fig. 7. The dependence of theNmF2 negative disturbance proba-bility functions on the solar zenith angle in latitude range 2 (10◦< |8| ≤30◦) during the winter (solid lines), summer (dashed lines), and spring and autumn (dotted lines) months for the weak (panels a), normal (panels b), strong (panels c), and very strong (panels d)NmF2 negative disturbances. The 0◦−180◦solar zenith angle range includes the local time period from 00:00 LT to 12:00 LT (left panels) and from 12:00 LT to 24:00 LT (right panels).
ative disturbance percentage occurrences on the solar zenith angle (see Figs. 6–10).
We found that there is a difference between the depen-dence of the strong and very strong NmF2 negative distur-bance percentage occurrences on the solar zenith angle in latitude ranges 1 and 2 (see Figs. 6c, d and Figs. 7c, d). There are clear discriminated peaks in the probabilities of the strong and very strongNmF2 disturbances before sunrise for all seasons in latitude range 1, while the strong and very strong NmF2 negative disturbance occurrence probabilities are decreased (with some oscillations) with the decrease in the solar zenith angle in the post midnight night-time sec-tor in latitude range 2. Our calculations show (see Figs. 9c, d and Figs. 10c, d) that the9−0.5<δ≤−0.3(χ )peak and
the 9δ≤−0.5(χ ) peak in the post midnight night-time
sec-tor are accompanied by the9−0.5<δ≤−0.3(χ )peak and the 9δ≤−0.5(χ )peak in the sunset-to-midnight sector in latitude
24 28 32
Ψ −0
.1
<δ
<0
(%)
10 20 30
Ψ −0
.3<δ≤−0
.1
(%)
Solar zenith angle (deg)
g
0 2 4 6
Ψ −0
.5
<δ
≤−
0.
3
(%)
160 120 80 40 0 0
0.2 0.4
Ψ δ≤−
0.5
(%)
0 40 80 120 160 00:00-12:00 LT 12:00-24:00 LT
a a
b b
c c
d d
Fig. 8. The dependence of theNmF2 negative disturbance proba-bility functions on the solar zenith angle in latitude range 3 (30◦< |ϕ| ≤45◦,30◦<|8| ≤45◦) during the winter (solid lines), sum-mer (dashed lines), and spring and autumn (dotted lines) months for the weak (panels a), normal (panels b), strong (panels c), and very strong (panels d)NmF2 negative disturbances. The 0◦−180◦solar zenith angle range includes the local time period from 00:00 LT to 12:00 LT (left panels) and from 12:00 LT to 24:00 LT (right panels).
4.3 NmF2 weak negative disturbance occurrence probabil-ities
Average values of the weakNmF2 negative disturbance prob-abilities calculated for all latitude ranges and seasons are presented in Table 2. For each studied latitude range and season, the first number is determined as an average value, < 9−0.1<δ<0(χ ) >1, of< 9−0.1<δ<0(χ )for the first half of
a day forχ ≤90◦, while the second number is determined as an average value,< 9−0.1<δ<0(χ ) >2, of< 9−0.1<δ<0(χ )
for the second half of a day forχ ≤ 90◦. The third num-ber is determined as an average value of9−0.1<δ<0(χ ) for
the night-time period forχ > 90◦. An average daytime value of the weak NmF2 negative disturbance probability is calculated as a half-sum of the first and second num-bers given in Table 2, shows that < 9−0.1<δ<0(χ ) >2 is
less than< 9−0.1<δ<0(χ ) >1in latitude ranges 3–5 for all
seasons, except for latitude range 3 in winter and latitude range 5 for the spring and autumn months. In opposition
20 30 40
Ψ −0
.1
<δ
<0
(%)
20 30
Ψ −0.
3<δ≤−
0.
1
(%)
Solar zenith angle (deg)
3 6 9
Ψ −0.
5<δ≤−0.3
(%)
160 120 80 40 0 0
0.5 1 1.5 2
Ψ δ≤−0.5
(%)
0 40 80 120 160 00:00-12:00 LT 12:00-24:00 LT
a a
b b
c c
d d
Fig. 9. The dependence of theNmF2 negative disturbance proba-bility functions on the solar zenith angle in latitude range 4 (45◦< |ϕ| ≤60◦,45◦<|8| ≤60◦) during the winter (solid lines), sum-mer (dashed lines), and spring and autumn (dotted lines) months for the weak (panels a), normal (panels b), strong (panels c), and very strong (panels d)NmF2 negative disturbances. The 0◦−180◦solar zenith angle range includes the local time period from 00:00 LT to 12:00 LT (left panels) and from 12:00 LT to 24:00 LT (right panels).
to latitude ranges 3–5, where < 9−0.1<δ<0(χ ) >1 is less
than< 9−0.1<δ<0(χ ) >2in latitude ranges 1 and 2 for all
seasons, except for latitude range 2 for spring and autumn months.
The top panels of Figs. 6–10 show that the occurrence probability of theNmF2 weak negative disturbances reaches its maximum and minimum values during daytime and night-time conditions, respectively. It also follows from Table 2 that the average night-time value of this probability is less than that by day for all seasons in all latitude regions.
20 30 40
Ψ −0
.1
<δ
<0
(%)
20 30 40
Ψ −0.
3<δ≤−0.1
(%)
Solar zenith angle (deg)
0 5 10 15
Ψ −0
.5<δ≤−0
.3
(%)
160 120 80 40 0 0
2 4
Ψ δ≤−
0.5
(%)
0 40 80 120 160 a a
b b
c c
d d
00:00-12:00 LT 12:00-24:00 LT
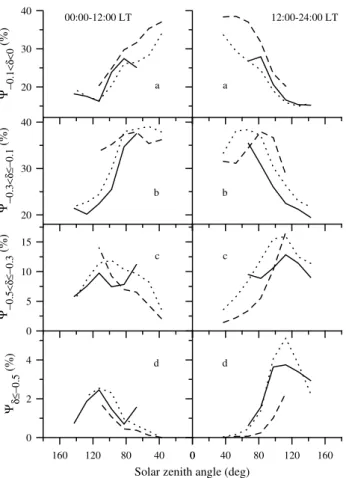
Fig. 10. The dependence of theNmF2 negative disturbance proba-bility functions on the solar zenith angle in latitude range 5 (60◦< |8| ≤90◦) during the winter (solid lines), summer (dashed lines), and spring and autumn (dotted lines) months for the weak (panels a), normal (panels b), strong (panels c), and very strong (panels d)NmF2 negative disturbances. The 0◦−180◦solar zenith angle range includes the local time period from 00:00 LT to 12:00 LT (left panels) and from 12:00 LT to 24:00 LT (right panels).
values of ionospheric electron content were used by Aravin-dakshan and Iyer (1993) to study its day-to-day variability at a number of stations extending from equatorial to mid-latitudes in Indian and American sectors for high and low solar activity years. The variability is larger at night than by day, highest in February and November and lowest in equinox months (Aravindakshan and Iyer, 1993). As a re-sult, we conclude that the identifiable greater probability of theNmF2 weak negative disturbances by day than at night (see the top panels of Figs. 6–10) is not related with a vari-ability in the ionosphere.
In addition to the modified large-scale circulation of the neutral atmosphere, during geomagnetic disturbances, the spatial and temporal variations of high-latitude thermosphere heat sources excite large amplitude gravity waves, which pro-duce travelling ionospheric disturbances in the F-region of the ionosphere (Millward et al., 1993; Hocke and Schlegel, 1996). Such gravity waves propagate from high to low lat-itudes considerably faster in the thermosphere than typical
mid- and low-latitude winds resulting from storms (Rees, 1995; Hocke and Schlegel, 1996). The response of the mid-latitude ionosphere to this gravity waves propagation is ob-served by ionozonde stations and incoherent scatter radars in the raising or lowering ofhmF2, often by several 10s of km, leading to a decrease or an increase in L and [O] athmF2, i.e. leading to the increase or decrease inNmF2, respectively (Rees, 1995; Hocke and Schlegel, 1996). The analysis of
fof2 measurements shows that night-timefof2 decreases due to gravity wave propagation are not so significant as by day (Deminova et al., 1998). As a result, we conclude that the identifiable greater probability of the NmF2 weak negative disturbances by day than at night, shown in the top panels of Figs. 6–10, can be explained if we suggest thatNmF2 weak negative disturbances are created by gravity wave propaga-tion in the ionosphere.
4.4 Relationships between the F1-layer, NmF2 negative disturbance, and G condition occurrence probability dependencies onχ
Figures 2–5 show that the daytime dependence of the F1-layer occurrence probability on the solar zenith angle is gen-erally in phase with that for the G condition in latitude ranges 3–5 for all seasons, and in latitude range 2 during the spring, summer, and autumn months. However, we can conclude from Fig. 2 that this daytime coupling is less convincing in latitude range 2 during the winter months. The competition between the F1 and F2-layers for density dominance deter-mines the G condition occurrence probability. Therefore, the occurrence probabilities of the weak, normal, strong, and very strongNmF2 negative disturbances, in addition to the F1-layer occurrence probability, must be considered in ad-dressing the causes of G condition solar zenith angle changes and in studying the possible relationships between the F1-layer and NmF2 negative disturbance occurrences. The G condition in the geomagnetically disturbed ionosphere is as-sociated mainly with a significant negative ionospheric storm inNmF2 (Lobzin and Pavlov, 2002). Thus, the found F1-layer occurrence probability dependence on the solar zenith angle (see the low panels of Figs. 2–5) and the identifiable so-lar zenith angle trends in strong and very strong negative dis-turbance probabilities shown in panels (c) and (d) of Figs. 7– 10, are the trends involved in the formation of the G condi-tion solar zenith angle tendencies shown in the top panels of Figs. 2–5.
A decrease in the solar zenith angle leads to decreases in the daytime values of strong and very strong negative distur-bance occurrence probabilities in latitude ranges 4 and 5 for the spring, summer, and autumn months (dashed and dotted lines in panels (c) and (d) of Figs. 9 and 10). The daytime probabilities9−0.3≤δ<−0.1(χ ), and9δ≤−0.5(χ )of theNmF2
means that that the dependence of the F1-layer occurrence probability onχ is the main source which contributes to the daytime9G(χ ) trend in the all studied latitude regions for
the winter months, in latitude range 2 for all the seasons, and in latitude ranges 4 and 5 for spring, summer, and autumn months.
The results presented in panels (c) and (d) of Fig. 7 show that the occurrence probabilities of the strong and very strong negative disturbances in latitude range 3 is increased with some oscillations if the solar zenith angle is increased. On the other hand, if we do not take into consideration the 0◦−15◦solar zenith angle range during the summer, spring, and autumn months, then we can conclude that the F1-layer occurrence probability is decreased in latitude range 3 if the solar zenith angle is increased (see Fig. 3). This means that the solar zenith angle trend in the G condition occurrence probability arises in the main from the solar zenith angle trend in the F1-layer occurrence probability of this latitude region. The solar zenith angle trend in the probabilities of strong and very strongNmF2 negative disturbances counter-acts the solar zenith angle trend in the probability of the G condition occurrence shown in the upper panels b and c of Fig. 3.
5 Conclusions
The primary goal of the present work is to calculate the de-pendencies of theNmF2 negative disturbance, F1-layer and G condition occurrence probabilities on the solar zenith an-gle during the summer, winter, spring and autumn months in latitude range 1 (|8| ≤ 10◦), in latitude range 2 (10◦ < |8| ≤ 30◦), in latitude range 3 (both 30◦ <|ϕ| ≤ 45◦and 30◦<|8| ≤45◦), in latitude range 4 ( both 45◦<|ϕ| ≤60◦ and 45◦ < |8| ≤ 60◦), and in latitude range 5 (60◦ < |8| ≤ 90◦), using experimental data acquired by the
Iono-spheric Digital Database of the National Geophysical Data Center, Boulder, Colorado, from 1957 to 1990. The G con-dition cannot exist in the ionosphere if there is no F1-layer. During ionospheric disturbances, theNmF2 decrease leads to the increase in the G condition occurrence probability if the F1-layer exists. The relationships between the G condition, F1-layer, andNmF2 negative disturbance occurrence proba-bilities are also studied in this paper.
5.1 F1-Layer and the G condition
Our calculations show that the G condition is more likely to occur during the first half of a day than during the second half of a day, in latitude ranges 2–5 during all seasons for the same value of the solar zenith angle, except for latitude range 3 in winter, when the G condition occurrence probabil-ity is approximately the same for the same solar zenith angle before and after 12:00 LT forχ ≤90◦.
We found that the average value for the second half of a day of the F1-layer occurrence probability is less than that for the first half of a day, except for latitude range 5 during
the winter, spring, and autumn months. The F1-layer occur-rence probability is larger in the first half of a day in com-parison with that in the second half of a day for the same value of the solar zenith angle in latitude range 1 for all sea-sons, while the F1-layer occurrence probability is approxi-mately the same for the same solar zenith angle before and after noon in latitude ranges 4 and 5 forχ ≤90◦.
We found that the F1-layer and G condition are more com-monly formed near midday than close to post sunrise or pre-sunset, when the F-region is in the sunlight. The maximum values of the F1-layer and G condition occurrence probabili-ties are found to be in the 0◦−45◦solar zenith angle range in latitude ranges 1–4. The maximum values of the F1-layer and G condition occurrence probabilities are realized for the minimum value ofχclose to noon in latitude range 5.
The comparison in the values of the F1-layer and G con-dition occurrence probabilities between all studied latitude ranges shows the daytime tendency for a decrease in these probabilities at low geomagnetic latitudes and an increase in these probabilities at high geomagnetic latitudes for all sea-sons. The identifiable detailed picture of the F1-layer and G condition seasonal probability behavior at the given so-lar zenith angle in latitude ranges 2–5 provides evidence that the chance that the daytime F1-layer and G condition will be formed is greater in summer than in winter. We have found for the first time that the F1-layer occurrence probability is greater in winter than in summer for all solar zenith angles in latitude range 1. The identifiable F1-layer and G condition seasonal probabilities are lower during the spring and autumn months as compared with that during the summer months for most of the solar zenith angle range in latitude ranges 3–5.
5.2 NegativeNmF2 disturbances
The magnitudes of the studiedNmF2 weak, normal, strong and very strong negative disturbances and their extension to lower latitudes are controlled by a number of parameters, including the strength of the magnetospheric storm or sub-storm, the season, the latitude, and the solar zenith angle. Our results clearly capture the geomagnetic latitude depen-dence in theNmF2 normal, strong, and very strong negative disturbance probabilities, reproducing the general tendency for a decrease in these probabilities at low latitudes and an in-crease in the probabilities at high latitudes. We found that the
It is proved that the average value for the second half of a day of the NmF2 negative disturbance probability is less than that for the first half of a day for the normal, strong, and very strongNmF2 negative disturbances in latitude ranges 3–5 for all seasons, except for the very strongNmF2 nega-tive disturbances in latitude ranges 3 in winter and in latitude range 5 during the winter, spring, and autumn months, when the average value of the very strongNmF2 negative distur-bances forχ ≤ 90◦ is approximately the same before and after 12:00 LT. In opposition to latitude ranges 3–5, the av-erage value for the first half of a day of theNmF2 negative disturbance probability is less than that for the second half of a day for the normal, strong, and very strongNmF2 negative disturbances in latitude ranges 1 and 2 in winter, except for the very strongNmF2 negative disturbances in latitude range 2 during all seasons and that in latitude range 1 during the summer and winter months. The average value of the very strongNmF2 negative disturbances forχ ≤90◦is approxi-mately the same before and after 12:00 LT in latitude range 2.
We found that there is a difference between the depen-dence of the strong and very strongNmF2 negative distur-bance percentage occurrences on the solar zenith angle in lat-itude ranges 1 and 2. There is a clear, discriminated peak in the probability of the strong or very strongNmF2 disturbance before sunrise for all seasons in latitude range 1. The strong and very strongNmF2 negative disturbance occurrence prob-abilities are decreased (with some oscillations) with the de-crease in the solar zenith angle in the post midnight sector in latitude range 2. Our calculations show that the strong and very strongNmF2 negative disturbance occurrence probabil-ity peaks in the post midnight night-time sector are accom-panied by the peaks in these probabilities in the sunset-to-midnight sector in latitude ranges 4 and 5 during the winter, spring, and autumn months.
It is proved that that the average value for the second half of a day of the weakNmF2 negative disturbance probability is less than that for the first half of a day in latitude ranges 3–5 for all seasons, except for latitude range 3 in winter and latitude range 5 for the spring and autumn months. In oppo-sition to latitude ranges 3–5, the average value for the first half of a day of the weakNmF2 negative disturbance proba-bility is less than that for the second half of a day in latitude ranges 1 and 2 for all seasons, except for latitude range 2 for the spring and autumn months.
The calculated occurrence probability of theNmF2 weak negative disturbances reaches its maximum and minimum values during daytime and night-time conditions, respec-tively, and the average night-time value of this probability is less than that by day for all seasons in all latitude regions. It is proved that an ionosphere variability that is not related to geomagnetic activity is not the cause of theNmF2 weak negative disturbance probability variations. We have con-cluded that the identifiable greater probability of theNmF2 weak negative disturbances by day than at night can be ex-plained if we suggest thatNmF2 weak negative disturbances are created by gravity wave propagation in the ionosphere.
5.3 Relationships between the G condition, F1-layer, and
NmF2 negative disturbance occurrence probabilities The competition between the F1- and F2-layers for density dominance determines the G condition occurrence probabil-ity. We found that the daytime dependence of the F1-layer occurrence probability on the solar zenith angle is generally in phase with that for the G condition in latitude ranges 3– 5 for all seasons, and in latitude range 2 during the spring, summer, and autumn months, but this daytime coupling is less convincing in latitude range 1 during the winter months. On the other hand, the G condition in the geomagnetically disturbed ionosphere is associated mainly with a significant negative ionospheric storm in NmF2. Thus, the identifi-able F1-layer occurrence probability dependence on the solar zenith angle and the identifiable solar zenith angle trends in strong and very strong negative disturbance probabilities are the trends involved in the formation of the G condition so-lar zenith angle trends. Our calculations show that the main source which contributes to the daytime dependence of the G condition occurrence probability on the solar zenith an-gle in the all studied latitude regions for the winter months, in latitude range 2 for all seasons, and in latitude ranges 4 and 5 for the spring, summer, and autumn months, is the de-pendence of the F1-layer occurrence probability on the solar zenith angle. The solar zenith angle trend in the probabil-ity of the G condition occurrence in latitude range 3 arises in the main from the solar zenith angle trend in the F1-layer occurrence probability. The solar zenith angle trend in the probabilities of strong and very strongNmF2 negative distur-bances counteracts the identifiable solar zenith angle trend in the probability of the G condition occurrence.
Acknowledgements. The research described in this publication was
supported by grant 99-05-65231 from the Russian Foundation for Basic Research. The authors would like to thank referees for their comments on the paper, which have assisted in improving the final version.
Topical Editor M. Lester thanks two referees for their help in evaluating this paper.
References
Abdu, M. A.: Outstanding problems in the equatorial iono-spherethermosphere electrodynamics relevant to spread F, J. At-mos. Sol. Terr. Phys., 63, 869–884, 2001.
Aravindakshan, P. and Iyer, K. N.: Day-to-day variability in iono-spheric electron content, J. Atmos. Terr. Phys., 55, 1565–1573, 1993.
Babcock, R. R., Jr. and Evans, J. V.: Seasonal and solar cycle vari-ations in the thermospheric circulation observed over Millstone Hill, J. Geophys. Res., 84, 7348–7352, 1979.
Banks, P. M., Schunk, R. W., and Raitt, W. J.: NO+and O+in the high latitude F-region, Geophys. Res. Lett, 1, 239–242, 1974. Buonsanto, M. J.: Observed and calculated F2 peak heights and
derived meridional winds at mid-latitudes over a full solar cycle, J. Atmos. Terr. Phys., 52, 223–240, 1990.