www.atmos-meas-tech.net/8/3715/2015/ doi:10.5194/amt-8-3715-2015
© Author(s) 2015. CC Attribution 3.0 License.
Pointing errors in solar absorption spectrometry – correction
scheme and its validation
A. Reichert, P. Hausmann, and R. Sussmann
Karlsruhe Institute of Technology, IMK-IFU, Garmisch-Partenkirchen, Germany Correspondence to:A. Reichert ([email protected])
Received: 5 May 2015 – Published in Atmos. Meas. Tech. Discuss.: 22 June 2015 Revised: 20 August 2015 – Accepted: 31 August 2015 – Published: 16 September 2015
Abstract.A method for quantification of sun-pointing inac-curacies in solar absorption spectrometry is presented along with a correction scheme for the resulting errors in trace gas vertical column or profile retrievals. A posteriori correction of pointing errors requires knowledge of both coordinates of the mispointing vector on the solar disk. In principle, quan-titative information on the mispointing can be retrieved from Doppler shifts of solar lines derived from measured spectra. However, this yields only one component of the mispoint-ing vector, namely the one which is perpendicular to the so-lar rotation axis. Missing information on the second vector component has hindered a posteriori correction of mispoint-ing errors so far. Our idea of how to overcome this problem is to obtain estimates of both coordinates of the mispoint-ing by combinmispoint-ing subsequent measurements with differmispoint-ing orientations of the solar rotation axis relative to the zenith direction. The proposed concept is suitable in the case of systematic mispointing, i.e., if the mispointing is approxi-mately constant within a given set of measurements. An im-plementation of this original concept is demonstrated using measurements from the solar absorption Fourier transform infrared (FTIR) spectrometer at the Zugspitze (47.42◦N,
10.98◦E, 2964 m a.s.l.). Soundings in the September 2012–
September 2014 time interval were impacted by mispointing problems due to a non-optimum solar tracking optics con-figuration. They show a mean mispointing in the zenith di-rection of−0.063◦. This causes biases in vertical soundings of trace gases, e.g.,−2.82 ppb in monthly means of dry-air column-averaged mole fractions of methane (XCH4). Mea-surements made with the more stable pre-September 2012 and post-September 2014 optics configurations show consid-erably smaller mispointing effects. Applying the mispointing correction, the April 2006–March 2014 XCH4 trend
deter-mined from Zugspitze measurements is reduced from 6.45 [5.84, 7.04] to 6.07 [5.55, 6.59] ppb yr−1. The correction thereby restores consistency with results from the nearby Garmisch FTIR site (47.48◦N, 11.06◦E, 743 m a.s.l.). The
mispointing correction is applicable to solar absorption mea-surements in the mid-infrared and near infrared. It will be of particular benefit for refining existing records of high-accuracy-and-precision greenhouse gas soundings for the purpose of improved trend analysis or source–sink inver-sions.
1 Introduction
carbon monoxide (Pougatchev and Rinsland, 1995; Bors-dorff and Sussmann, 2009), and water vapor (e.g., Schneider et al., 2006). More recently, these measurements have been supplemented by high-accuracy-and-precision retrievals of climate gases from the Total Carbon Column Observing Net-work (TCCON, http://www.tccon.caltech.edu), which relies on solar absorption spectra in the near infrared (NIR) (e.g., Washenfelder et al., 2003; Wunch et al., 2011).
Since solar absorption spectrometers use the sun as a light source, all such instruments contain a device for active track-ing of the solar position. The simplest approach to achieve continuous sun tracking is to adjust the observed sky posi-tion according to precalculated values. However, such pas-sive tracking does not fulfill typical accuracy requirements. Therefore, most current solar FTIR systems make use of feedback from a quadrant diode to control the solar tracker position and thereby achieve improved pointing accuracy (see, e.g., Adrian et al., 1994; Notholt et al., 1995; Washen-felder et al., 2006). Further improvements can be made by using feedback from a camera image of the position of the solar disc on the spectrometer’s entrance aperture instead of a quadrant diode (Gisi et al., 2011). However, the continuous alignment of the instrument’s line of sight with the center of the solar disc is generally prone to inaccuracies. Tracking errors in the vertical direction cause the air mass observed by the spectrometer to differ from the air mass assumed in trace gas retrievals (Hase, 2000). To a good approximation, this air mass error results in an equal relative error in the retrieved trace gas columns. Additionally, mispointing may result in further errors in retrieved column amounts, such as instrumental line shape variations if field stops inside the spectrometer are not fully illuminated.
As outlined in Hase (2000), a mispointing of 0.1◦in the
zenith direction results in about 1 % trace gas column error for an apparent solar zenith angle (sza) of 80◦. These errors
exceed current accuracy requirements for measured column amounts, e.g., the 0.5 % accuracy requested for the TCCON network (Toon et al., 2009). It is therefore an issue to de-termine and correct for the influence of mispointing in solar FTIR measurements.
Information on the mispointing is contained in solar lines which appear in ground-based solar spectra in addition to the terrestrial absorption features. Mispointing perpendicu-lar to the soperpendicu-lar rotation axis causes rotational Doppler shifts in the solar lines. Measurements of the solar line shift there-fore enable the determination of mispointing perpendicular to the solar rotation axis (Gisi et al., 2011). However, these measurements do not permit complete determination of the mispointing direction and norm since they do not contain in-formation on the mispointing component parallel to the solar rotation axis. This is the basic reason why there is currently no method available that enables a correction of mispointing-induced retrieval errors. In this study, we present a method to overcome this limitation and thereby enable a posteriori
cor-rection of mispointing effects, to our knowledge for the first time.
This paper is structured as follows: in Sect. 2, we for-mulate the mispointing problem and outline the basic idea for its correction. Section 3 gives a detailed description of the mispointing determination scheme and the subsequent trace gas column correction. Section 4 contains an exam-ple of the imexam-plementation of the correction procedure using FTIR measurements at the Zugspitze (47.42◦N, 10.98◦E,
2964 m a.s.l.). Finally the correction results are validated via XCH4 bias and trend analysis using reference solar FTIR measurements at the nearby Garmisch site (47.48◦N,
11.06◦E, 743 m a.s.l.). In Sect. 5 we summarize the results
along with some concluding remarks.
2 Formulation of the mispointing problem and basic idea for a correction method
For all sun-tracking spectrometers, the alignment of the in-strument’s line of sight with the sky position of the solar disc center is prone to inaccuracies. The zenith direction compo-nent of this mispointing causes the air mass assumed in trace gas column retrievals to differ from the real air mass during the measurement. This error in air mass results in an equally large relative error in the retrieved trace gas column.
As outlined in the previous section, only the mispointing perpendicular to the solar rotation axis and not the compo-nent parallel to the axis can be deduced from the Doppler shift of solar lines. Therefore, the component of mispointing in the zenith direction that causes bias in the retrieved trace gas columns cannot be deduced directly from such measure-ments.
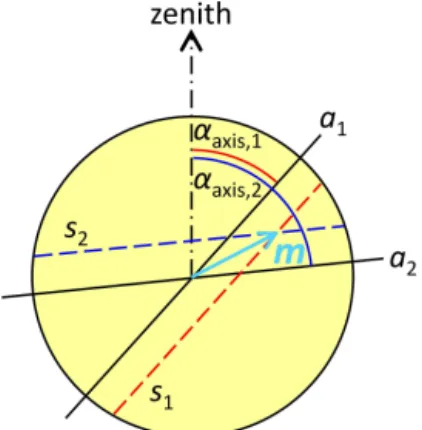
However, the orientation of the solar axis relative to the zenith direction varies over time. If the change of the mis-pointing between two measurements is negligible compared to the magnitude of the mispointing, the changing axis ori-entation enables the determination of the zenith and horizon-tal components of mispointing. The mispointing can there-fore be fully constrained from a set of shift measurements at timest1andt2with different axis orientationsαaxis,1 and αaxis,2(Fig. 1). In the following, the vector from the center of the solar disc to the actual pointing coordinates is designated as mispointing vectorm.
Neglecting differential solar rotation (addressed in Sect. 3), i.e., assuming constant angular velocity at all so-lar latitudes, a single shift measurement constrains the mis-pointing to lie on the straight linesparallel to the solar rota-tion axisa. The distance betweensanda is proportional to the measured solar line shift1ν/ν. Combining two measure-ments with different axis orientationsαaxis,1andαaxis,2, the mispointing vectormis then defined by the intersection
Figure 1.Schematics of the mispointing determination strategy.
So-lar line shifts are measured at timest1andt2with corresponding solar axis orientationsαaxis,1andαaxis,2. The mispointing vectorm
is defined by the intersection of the liness1ands2parallel to the so-lar rotation axesa1anda2, respectively. Differential solar rotation is neglected in this figure.
measured spectra to compute a mean mispointing vector in-stead of using only two measurements. In this case, the mean mispointing is defined by the mean intersection coordinates of all pairs of measurements that can be selected from a given set of spectra. Note that this approach relies on the assump-tion that changes of the mispointing within the set of spectra used to compute one mean value of mare negligible
com-pared to the magnitude of the mispointing itself.
3 Detailed implementation of the mispointing quantification and correction
In the following, the steps required to implement the mis-pointing determination approach are described in detail. As a first step, the time series of measured spectra is divided in time bins. We outlined in the previous section that the mis-pointing determination method relies on the assumption of approximately constant mispointing within each of the time bins. Therefore, the suitable choice of time bins results in a trade-off between low statistical errors in mispointing re-sults achieved by a large bin size and improved fulfillment of the underlying assumption of constant mispointing within each time bin that results from a smaller bin size. An exam-ple for the bin size adjustment in the case of the Zugspitze measurements is discussed in Sect. 4.2.
For all measured spectra, the solar line Doppler shift1ν/ν has to be determined. In our analysis, this task is performed using the PROFFIT software (Hase et al., 2004). The fit is performed on spectra measured with the optical bandpass fil-ter used for CH4 column retrievals, which covers the wave number range 2400< ν <3100 cm−1. In order to assess the accuracy of the solar line shift fit, we compare these results to solar line shift measurements in the adjacent 2000< ν < 2650 cm−1filter. The differences between the measured line
shifts in both filters were set as an estimate of the shift mea-surement uncertainty. This uncertainty is subsequently used for the calculation of the mispointing uncertainty (see Ap-pendix B).
In addition to solar line shifts, the mispointing calculation requires knowledge of the orientationαaxis of the solar ro-tation axis relative to the zenith direction for each measured spectrum. More precisely, the orientation angle used in the mispointing calculation is the apparent angle from zenith di-rection to sun rotation axis didi-rection at the time and location of the measurements, i.e., the angle between projections of zenith direction and sun rotation axis direction on a plane perpendicular to spectrometer’s line of sight. All necessary steps for calculation ofαaxisare outlined in Appendix A.
Systematic mispointing is assumed to be caused by devi-ations of the sun tracker optics geometry from an idealized setup. Possible scenarios include, e.g., inaccuracies in mir-ror orientation or misalignment of the quadrant diode that al-lows continuous adjustment of the instrument’s line of sight to follow the sun position. For such sources of tracking error, it is plausible to assume constant mispointing during limited time intervals in a coordinate system valid in the spectrome-ter, contrary to, e.g., the azimuth/elevation coordinate system in the sky. Due to the sun tracker optics, the image of the sun undergoes reflections and rotations when transferred to the spectrometer entrance aperture. Therefore, the resulting im-age of the sun on the entrance aperture has to be calculated for each measurement.
The transformation of the solar image due to the solar tracker optics can be described by a concatenation of 3×3 imaging matrices resulting in an overall transfer matrixT. The orientation of the sun rotation axis on the entrance aper-ture is then calculated by multiplying a vector with orienta-tionαaxiswith the correct transfer matrixT. For the retrans-formation of a mispointing vectormderived in spectrometer
coordinates to sky coordinatesmsky,mhas to be multiplied
with the inverse of the transfer matrix, that is,msky=T−1m.
Contrary to the simplified solution scheme presented in Sect. 2, the angular velocity of solar rotation depends on so-lar latitude ϕ, a phenomenon called differential solar tion. The latitude-dependent angular velocity of solar rota-tionω(ϕ)is described approximately by the following rela-tion:
ω(ϕ)=c1+c2sin2ϕ+c3sin4ϕ. (1) Currently accepted values for the constants c1, c2, and c3arec1=14.713±0.0491◦d−1,c2= −2.396±0.188◦d−1, andc3= −1.787±0.253◦d−1(Snodgrass and Ulrich, 1990). Due to differential solar rotation, a single solar line shift measurement does not constrain the mispointing to lie on a straight line as depicted in Fig. 1, but on a line with a con-stant velocity component along the observer’s line of sight.
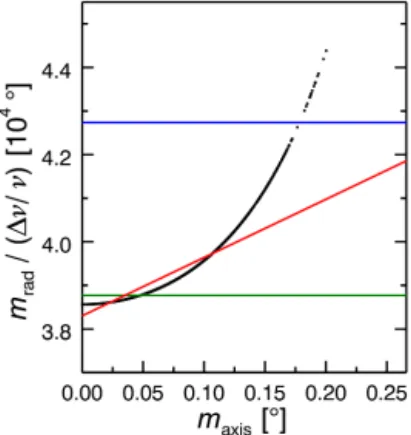
Figure 2.Conversion of solar shift to radial mispointing.maxis des-ignates the apparent distance from the solar equator. Blue: mean conversion factor given in Gisi et al. (2011). Green: iteratively de-termined mean conversion for the Zugspitze data set according to Eq. (3). Black: conversion according to Eq. (2), usingω(ϕ)values calculated with Eq. (1),maxiscalculated using Eq. (3). Red: best fit linear conversion according to Eq. (4).
measurements:
mrad= [1ν/ν·c/ω(ϕ)] ·rsun, apparent/rsun, (2) where c=2.99792458×10⁸m s−1, rsun=6.958×10⁸m, andrsun, apparent=0.266◦.
In this study, instead of using Eq. (2) for mispointing cal-culation, a linear approximation to this relation is performed (see Fig. 2). Mispointing results determined from Zugspitze measurements suggest this approximation induces no signif-icant additional error in the results. While the mean relative error of mispointing over the Zugspitze measurement time series is 9.5 %, the error of radial mispointing induced by the linear approximation is 0.36 %, which is negligible compared to the mispointing error.
The following steps are performed to obtain the linear ap-proximation:
i. A mean factor for conversion of solar shifts into mis-pointing is determined iteratively from our data set. To obtain the conversion factor, the distributions of mis-pointing values parallel and perpendicular to the so-lar equator are assumed to be simiso-lar. Using the shift-mispointing conversion given in Gisi et al. (2011), a typ-ical distribution of mispointing values parallel to the so-lar rotation axis is then calculated from the soso-lar line shift measurements. By means of Eq. (1), this mispoint-ing distribution can be converted to a typical angular velocity distribution for the given data set. The mean value of thisω(ϕ)distribution is then used to calculate an improved shift-mispointing conversion factor replac-ing ω(ϕ)in Eq. (2) by the mean value of the angular velocity distribution. The above steps are repeated iter-atively until convergence is reached. This results in an
Figure 3.Linear approximation of differential rotation. A solar line
shift measurement constrains the mispointing to lie on a line with constant velocity component along the observer’s line of sight (blue line). Linear approximation of this relation results in a constraint of mispointing on raysrtilted away from the solar rotation axis by an angle1αand with a minimum distancem0to the axis (red line).
adjusted shift-mispointing conversion of
mrad, mean=1ν/ν·38 771.4◦. (3)
ii. The distribution of mispointing parallel to the solar equatormradcan now be calculated using Eq. (3). We assume that the distribution of mispointing parallel to the sun rotation axismaxis is similar to the distribution ofmrad. A solar latitude distribution for our data set can now be derived using ϕ=arcsin(maxis/rsun, apparent). This enables calculatingω(ϕ)by means of Eq. (1). iii. A linear fit to the mispointing values calculated using
Eq. (2) and the angular velocity values determined in step (ii) is then performed. The final result for the best fit linear approximation is
mrad, lin=1ν/ν·(a+b·maxis), (4) wherea=38 301.9±2.9◦andb=13 363±63. Equation (4) implies that a solar shift measurement con-strains the mispointing to lie on a pair of raysr with a dis-tance to the solar rotation axis on the solar equator ofm0= 1ν/ν·a, and at an angle relative to the zenith direction of αcorr=αaxis±1α, where1α=arctan(1ν/ν·b), as shown in Fig. 3.
Given the orientation of the solar axis and the conversion of solar line shift to mispointing, we can now calculate mis-pointing results. As described at the beginning of this section, the measurement time series is distributed in time bins. For each bin, all possible combinations of measurement pairs are considered. For each of then(n−1)/2 possible pairs selected from thenmeasurements within a time bin, a mispointing vectormis calculated. Finally, the mean of the mispointing
of allm. The computation of the weighted means requires an
estimate of the uncertainty of intersection coordinates. The uncertainty estimate was deduced from the difference of co-incident solar shift measurements in adjacent optical filters. A detailed description of this uncertainty estimate is given in Appendix B.
Corrected trace gas column amounts can be calculated from the mispointing results with two distinct correction methods: the a posteriori correction method consists in sub-tracting the mispointing in the zenith direction my,skyfrom the apparent sza taken from the trace gas retrieval ray trace calculation. Corrected air mass values can then be calculated according to
air masscorr=1/cos(sza−my,sky). (5) We then multiply retrieved trace gas columns with air mass/air masscorrto obtain corrected columns.
The second (a priori) correction method takes into account that, in addition to the effect on the conversion of slant path to vertical column, the mispointing has slight influence on the forward spectral calculations performed in the retrieval. The a priori method therefore uses the mispointing-corrected sza as an input to the retrieval. The retrieval is then repeated, with the corrected input values resulting in corrected trace gas column results.
Note that Eq. (5) given in the a posteriori method only permits an approximate air mass calculation. In order to achieve higher accuracy especially at high sza, a more so-phisticated calculation such as the approach described by Kasten and Young (1989) can be chosen. Furthermore, the a priori scheme includes additional effects such as the in-fluence of mispointing on the ray trace calculation in trace gas retrievals which are not considered in the a posteriori method. However, as shown in Sect. 4.3, the corrected trace gas columns obtained using the a posteriori approach show good consistency with the results from the more sophisti-cated a priori approach.
4 Example correction for Zugspitze FTIR 4.1 Solar FTIR and tracker setup
The solar FTIR instrument considered in the example cor-rection is located at the Zugspitze (47.42◦N, 10.98◦E,
2964 m a.s.l.). The system is based on a Bruker IFS 125 instrument, and it is described in detail in Sussmann and Schäfer (1997). For the validation of correction results we furthermore use data from the nearby Garmisch FTIR (47.48◦N, 11.06◦E, 743 m a.s.l.).
The geometry of the Zugspitze sun tracker is depicted schematically in Fig. 4. The custom-made tracker is lo-cated above the spectrometer, in an astronomical dome that is opened for measurements. The tracker optics consists of a first plane 45◦elevation mirror (M
1) to adjust the elevation
Figure 4.Geometry of the Zugspitze solar tracker optics.(a)
Cur-rent optical setup after September 2014, Flip 1.(b)Current setup,
Flip 0.(c)Optical setup before September 2012.
angle (el) of the instrument’s line of sight. Sunlight is then guided to the spectrometer below by a second plane 45◦
mir-ror (M2). The azimuth of the line of sight (az) is adjustable by rotation of both mirrors on an arm. The same sky posi-tion can be reached by the tracker system with two distinct arm orientations with 180◦position difference: Flip 1, used
for most measurements and depicted in Fig. 4a, and Flip 0, used for measurements with az<116◦ or az>296◦ since September 2012; see Fig. 4b.
The setup in place since September 2012 furthermore contains an off-axis mirror (M3,f =478 mm) that changes beam orientation to horizontal again and creates an image of the sun on the aperture A1. The image of the sun is centered on the aperture A1by a quadrant diode continuously giving feedback for tracker positioning. Since September 2014, the active tracking by means of the quadrant diode has been re-placed by a Camtracker (Gisi et al., 2011) system inside the spectrometer. Before September 2012, horizontal beam di-rection and creation of an image on A1was achieved by the parabolic mirror M′
3(f =1920 mm) and an additional plane mirror M′
Figure 5.Time series of solar line shifts determined from Zugspitze
FTIR spectra in the 2400< ν <3100 cm−1optical filter.
4.2 Implementation of correction
The first step in the implementation of the mispointing cor-rection procedure consists in deducing solar line shifts from the measured spectra as described in Sect. 3. Figure 5 shows the time series of solar line shifts obtained from the Zugspitze measurements.
As mentioned in Sect. 3, the transformation of the solar image by the tracker optics can be characterized by 3×3 imaging matrices that describe changes in beam direction and changes of the solar image in the image plane perpendicular to the beam direction. In the following, we establish those transfer matrices for the optics setup described in Sect. 4.1. The corresponding transfer matrices are established for the configurations Flip 1 and Flip 0 in the current optical setup shown in Fig. 4a and b, and the Flip 1 configuration for the pre-September 2012 setup shown in Fig. 4c.
The complete transformation can be described by a con-catenation of three different types of operations: (i) reflec-tions on a plane mirror perpendicular to the beam direction; (ii) rotation of the coordinate system; and, finally, (iii) re-flection on 45◦mirrors. Operation (i) corresponds to mirror
matricesM, e.g., for a mirror in thexyplane:
Mxy=
1 0 0
0 1 0
0 0 −1
. (6)
Operation (ii) is described by the standard R3 rotational matricesRx/y/z,ϕ, where x/y/zdesignates the direction of the rotation axis and ϕ the rotation angle in mathematical orientation. Note that a rotation of the coordinate system by an angleϕcorresponds toRx/y/z,−ϕ. Reflection on 45◦
mir-rors (iii) can be further decomposed in a combination of ro-tation according to (ii) to a coordinate system in which the mirror lies on a plane of base vectors, e.g., thexyplane. This rotation is followed by a reflection according to (i) and a fi-nal backwards rotation of the coordinate system. In the fol-lowing, the transfer matrices for 45◦mirrors are designated
Sx/y±, where thex/yindex specifies the coordinate axis
par-allel to the mirror if thezaxis is orientated in beam direction
prior to the reflection. The sign in the index is “−” if the third axis points towards the mirror and “+” if the third axis points away from the mirror. The matricesSx/y±have the following
form:
Sx±=
1 0 0
0 0 ±1
0 ±1 0
, Sy±=
0 0 ±1
0 1 0
±1 0 0
. (7)
Using the basic operations (i), (ii), and (iii), we can now deduce transfer matricesTfor the Zugspitze sun tracker sys-tem. The initial coordinate system valid in the sky is defined with thex axis in the horizontal direction, they axis in the zenith direction and thezaxis along the line of sight towards the instrument. After each sub-step of the path through the tracker optics, the coordinate system is rotated to orient the zaxis in ingoing beam direction.
The individual steps can be tracked in Fig. 4. For the cur-rent setup and Flip 1 configuration (Fig. 4a), the transfer ma-trix components and final result are
TF1=T−F11=Rx,90◦Sx+Rz,azRx,−90◦Sx−Rz,elRy,−90◦Sy+
=
−cos(−az+el) −sin(−az+el) 0 −sin(−az+el) cos(−az+el) 0
0 0 1
. (8)
Note thatTF1describes the transfer to a spectrometer coor-dinate system in which thexandyaxes are rotated relative to the horizontal and vertical direction by a constant anglec. As visible in Fig. 4, this constant rotation anglecdepends on the orientation of the spectrometer and is equal for all measure-ments in all optical configurations. Since a transformation to a common spectrometer coordinate system with arbitrary ori-entation is sufficient for our analysis, the constant rotation is neglected in all transfer matrices.
In Flip 0 configuration (Fig. 4b), the corresponding matrix is given by
TF0=T−F01=Rx,90◦Sx+Rz,azRz,180◦Rx,−90◦
Sx−Rz,−elRy,90◦Sy−
=
cos(az+el) −sin(az+el) 0 −sin(az+el) −cos(az+el) 0
0 0 1
. (9)
For the optical setup before September 2012 and the Flip 1 configuration (Fig. 4c), we obtain
TF1old=Rx,−90◦Sx±Ry,180◦MxyRz,azRx,−90◦ (10)
Sx−Rz,elRy,−90◦Sy+
=
cos(−az+el) sin(−az+el) 0 −sin(−az+el) cos(−az+el) 0
0 0 1
6=T−F1old1 ,
T−F1old1 =
cos(−az+el) −sin(−az+el) 0 sin(−az+el) cos(−az+el) 0
0 0 1
Figure 6.Choice of time bin size for Zugspitze mispointing
deter-mination.(a)Mean zenith mispointing error (black) and median of
the relative scatter of mispointing results within time bins (blue).
(b)Mean 1σ-XCH4diurnal variation.
The next analysis step consists in dividing the ment time series in time bins. For the Zugspitze measure-ments, each time bin was chosen to comprise the number of measurement days necessary to reach a total number of at leastnmin spectra in the bin. The choice of time bin size nmin results from a trade-off between the statistical uncer-tainty of the mispointing result and the degree of fulfillment of the assumption that mispointing is approximately constant within each time bin. Figure 6a demonstrates this trade-off: the mean error of the mispointing result in the zenith di-rection (1my) declines with increasing bin size. Variations of the mispointing within a time bin result in scatter of the intersection coordinates for different measurement pairs in-cluded in the bin. Therefore, the scatter of the intersection coordinates as given by their standard deviation divided by the norm of the mispointing vector indicates how well the assumption of constant mispointing is fulfilled. As visible in Fig. 6a, the median of this intra-bin scatter increases with increasing nmin, indicating more variability of mispointing within time bins. As an indicator to find an optimum nmin, we use the mean of XCH4 diurnal variation over the mea-surement time series (see Sussmann et al., 2011). Since the underlying real XCH4 diurnal variation can be assumed to be significantly lower than the measured values,nminis cho-sen to minimize the measured diurnal variation. As shown in Fig. 6b, a bin size ofnmin=20 is chosen for the Zugspitze measurements based on this criterion. The mean number of measurement days included in a time bin is 7.1 days.
4.3 Results and validation via methane trend analysis In this section, the mispointing results based on the Zugspitze measurements and their validation by means of XCH4trend analysis are presented. We consider the time interval from April 2006 until March 2015. This time interval was
cho-Figure 7.Mispointing results determined from Zugspitze
measure-ments. (a) x component of mispointing in spectrometer coordi-nates.(b)ycomponent of mispointing in spectrometer coordinates.
(c)Zenith component of mispointing in sky coordinates.
sen based on three criteria: it coincides with the phase of re-newed increase of atmospheric methane concentrations (e.g Sussmann et al., 2012). Furthermore, the interval includes the most up-to-date measurements available. The last criterion is that the interval length be a multiple of a 1-year period, which is crucial for avoiding bias in the trend analysis.
The time series of mispointing in spectrometer coordinates and the zenith component of the mispointing in sky coordi-nates are shown in Fig. 7. The mean mispointing in the zenith direction over the measurements made in the April 2006– September 2012 time interval, which corresponds to the optics setup shown in Fig. 4c, is 0.024±0.001◦. Within the September 2012–September 2014 interval (optics setup shown in Fig. 4a and b and quadrant diode) the mean mis-pointing is −0.063±0.005◦, and for the October 2014– March 2015 interval (optics setup shown in Fig. 4a and b and Camtracker) it is 0.024±0.008◦.
Figure 8. (a) Comparison of a posteriori-corrected (green) and
uncorrected (red) Zugspitze XCH4 monthly mean time series.
(b) Time series of differences between a posteriori-corrected and
uncorrected XCH4monthly mean time series.
152 % of the mispointing vector norm in spectrometer coor-dinates, respectively. Therefore, the basic assumption of con-stant mispointing is only poorly fulfilled in these phases and in general for the Garmisch instrument. This is due to the fact that the mispointing values in these phases were generally very small, which makes a mispointing determination with small relative error challenging. However, due to the small mispointing values, the mispointing correction has only very minor influence on the XCH4values in these time intervals.
The use of the a posteriori correction method presented in Sect. 3 instead of the full a priori correction results in a 5 % bias in the zenith component of the mispointing for the Zugspitze measurement time series. This corresponds to only ∼0.02 % bias in XCH4. Therefore, the a posteriori method can be considered to provide a fair approximation to the a pri-ori results, which has the advantage of not having to repeat the trace gas retrieval procedure after the mispointing deter-mination.
Figure 8a shows a comparison of the corrected and un-corrected Zugspitze time series of XCH4 monthly means for the phase of renewed methane increase since 2006. In Fig. 8b, the mispointing correction applied to the original time series is shown. The mean of XCH4 correction over all measurements made in the time interval most affected by the mispointing (September 2012–September 2014) is −2.82±2.08 ppb.
The mispointing results are validated by means of methane trend analysis. To perform this analysis, monthly means are calculated from the uncorrected and corrected XCH4 time
Table 1. XCH4 trend (ppb yr−1) for the April 2006–March 2015 time interval and corresponding 95 % confidence intervals; Zugspitze and Garmisch sites, uncorrected, a posteriori and a pri-ori corrected.
uncorrected a posteriori a priori corrected corrected
Zugspitze 6.45 [5.84, 7.04] 6.07 [5.55, 6.59] 6.08 [5.56, 6.60] Garmisch 5.22 [4.77, 5.65] 5.20 [4.74, 5.64] 5.19 [4.74, 5.63]
series. The trend analysis is performed as described in Gar-diner et al. (2008) and Sussmann et al. (2012). In summary, all months withn >7 measured spectra are included in the analysis. We then calculate monthly means and subtract the mean annual cycle fitted as a third-order Fourier series from the time series of XCH4monthly means. Finally a trend is fit-ted to the deseasonalized time series. The trend uncertainty is determined by means of bootstrap reanalysis.
Table 1 shows the Zugspitze XCH4 trend for the April 2006–March 2015 time interval and its 95 % confi-dence interval. Due to the major perturbations in the point-ing accuracy in the September 2012–September 2014 inter-val (Fig. 8), the uncorrected Zugspitze trend is no longer consistent with the trend determined from measurements at the nearby Garmisch site. (Note that trend consistency could be shown for the time period before September 2011; see Sussmann et al., 2012.) However, applying mispointing cor-rection restores the consistency of Zugspitze and Garmisch trend results for the whole time series. This holds both for a posteriori-corrected and a priori-corrected results. As out-lined in Appendix C, mispointing correction also restores consistency in the bias between the Zugspitze and Garmisch XCH4 monthly means for the phases with differing optical configurations.
5 Summary and conclusions
line shift measurements at different orientations of the solar rotation axis relative to the zenith direction. Note that this ap-proach relies on the assumption that, within a suitably chosen set of measurements, the change of the mispointing is negli-gible compared to the magnitude of the mispointing. There-fore, only the systematic component of the mispointing is constrained by this method.
An application of our original mispointing correction strategy was demonstrated via measurements made with the Zugspitze solar FTIR system. We found that a short period of the measurement series (i.e., September 2012– September 2014) was notably affected by mispointing prob-lems caused by a non-optimum optical configuration, and a mean vertical mispointing of−0.063±0.005◦was derived. As an example for the impact on trace gas retrievals, this mispointing was shown to lead to a mean bias of −2.82± 2.08 ppb in retrieved XCH4monthly means.
The presented correction strategy relies on the assumption that the change of mispointing within each time bin is neg-ligible compared to its magnitude. It has been outlined in Sect. 4.3 that for the September 2012–September 2014 terval this assumption is well fulfilled at the Zugspitze strument. For other time intervals and for the Garmisch in-strument, the assumption is only poorly fulfilled. However, this is due to the fact that in these cases only minor mis-pointing occurred, which makes a correction unnecessary. The Zugspitze and Garmisch instruments are likely to be well representative for standard NDACC and TCCON instru-ments. Therefore for ideally configured NDACC and TC-CON systems, a mispointing correction is unlikely to lead to significant accuracy improvements. However, for non-standard or poorly aligned systems such as the Zugspitze instrument in the 2012–2014 phase, the correction leads to major quality improvements.
The results of the mispointing correction were validated by means of methane trend analysis. The trend derived from uncorrected XCH4monthly means in the April 2006– March 2015 time interval for the Zugspitze site is 6.45 [5.84, 7.04] ppb yr−1, inconsistent with the 5.22 [4.77,
5.65] ppb yr−1trend of the nearby Garmisch site.
Mispoint-ing correction resolves this inconsistency, resultMispoint-ing in a trend of 6.07 [5.55, 6.59] ppb yr−1 for Zugspitze and 5.20 [4.74,
5.64] ppb yr−1 for Garmisch. Furthermore, applying
mis-pointing correction is shown to restore consistency in the bias between the Zugspitze and Garmisch measurements for the phases with differing optical configurations.
Appendix A: Orientation of solar rotation axis
In this section, we outline the calculation ofαaxis, which is defined as the angle between projections of zenith direction and sun rotation axis on a plane perpendicular to the spec-trometer’s line of sight. For a sun-viewing instrument, this projection plane corresponds to the plane defined by the day– night separation line on the Earth. The orientation angleαaxis consists of three distinct projections onto the day–night sepa-ration plane: the first contributionβis the angle between the Earth rotation axis and the zenith direction, the second angle γ spans from the ecliptic axis to the Earth rotation axis. The final contributionδ describes the angle between the sun ro-tation axis and the ecliptic axis. In total, αaxis is calculated as
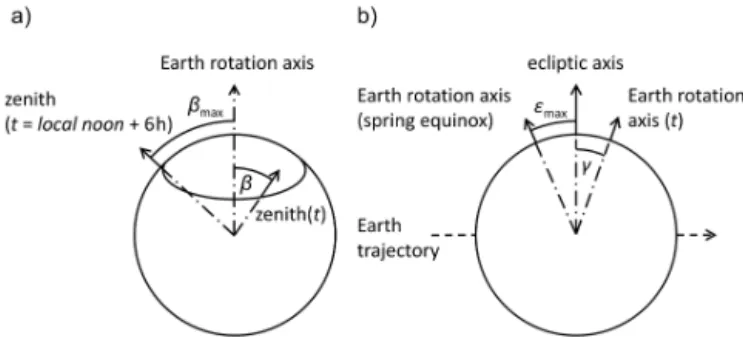
αaxis=β+γ−δ. (A1) The calculation of the componentβ, ranging from the pro-jections on the day–night separation plane of zenith direction to the Earth rotation axis, is represented in Fig. A1a. The an-gleβ has a daily cycle due to the Earth’s rotation. The am-plitudeβmaxof this daily cycle shows a seasonal variability due to variations in the inclinationεof the Earth axis relative to the day–night separation plane. The inclination εcan be calculated as
ε=arcsin(sin(εmax)·sin(ϒ E)), (A2) whereϒ E designates the heliocentric ecliptic longitude of the Earth and εmax=23.43◦. This leads to an amplitude of the daily cycle given by
βmax=arctan(tan(90◦−observer latitude)/cosε). (A3) The angleβ can then be expressed in terms of βmaxand observation time:
β= −arctan(tan(βmax)·sin(day fraction·2π )), (A4) where day fraction=hours since local noon/24 h.
Figure A1.Calculation of sun axis orientation relative to zenith
di-rection.(a)β: zenith direction relative to Earth rotation axis. (b)
γ: Earth rotation axis relative to ecliptic axis. Both subfigures rep-resent projections on the day–night separation plane, direction of view towards the sun.
The second orientation componentγis the angle between the Earth rotation axis and the ecliptic axis and has a seasonal cycle due to the inclination of the Earth axis. As shown in Fig. A1b, the amplitude of this seasonal variability is equal to the inclination of the Earth axis relative to the ecliptic axis. Consequently,γ can be calculated as
γ= −arctan(tan(εmax)·cos(ϒ E)). (A5) The calculation of the third angle component δ, be-tween the sun rotation axis and ecliptic axis, is outlined in Giles (2000). In summary,
δ=arctan(−cos(η−)·tani), (A6) where standard values for the constants i and are i= 7.25◦,=73.67◦+0.013958◦(t(years) – 1850.0), andη=
Appendix B: Uncertainty estimate of intersection coordinates
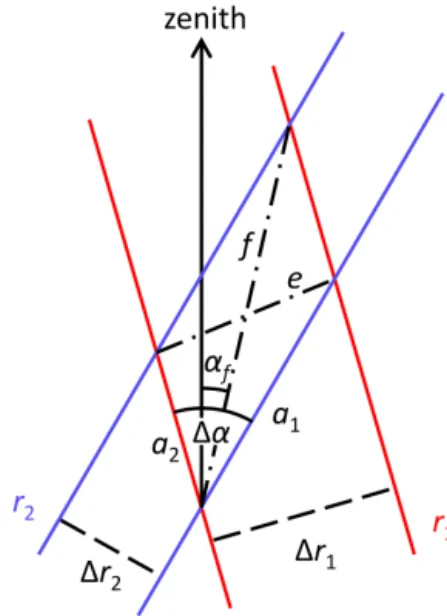
In order to obtain an estimate of the intersection coordinate uncertainty, we adopted the following approach: an estimate of solar line shift uncertainty can be gained from the dif-ference of coincident solar shift measurements in the ad-jacent 2400< ν <3100 and 2000< ν <2650 cm−1 filters. A 15 min coincidence interval was chosen for this calcula-tion. The mean shift difference throughout the April 2006– March 2015 interval considered in our study was 3.3×10⁻⁷. Compared to the mean magnitude of solar line shifts of 9.9×10⁻⁷, this corresponds to a mean relative difference of ∼33 %.
Instead of infinitesimal-width rays as depicted in Fig. 3, the raysr1andr2are assumed to have a width correspond-ing to the measured solar shift difference. The ray widths 1r1 and1r2depend on the measured solar line shifts 1s1 and1s2, respectively. Furthermore, due to differential solar rotation, the conversion from shift differences to ray widths depends on the intersection coordinates. The conversion is given by the quotient of the mispointing perpendicular to the solar axismrad, linaccording to Eq. (4) and the measured solar shifts:
1r=1s·(mrad, lin/s). (B1)
Due to the finite ray widths1r1and1r2, an overlap par-allelogram (see Fig. B1) emerges instead of an intersection point. The length of the diagonals of the parallelogram (e,f) can be calculated as follows:
1α=αcorr,2−αcorr,1,
a1= |1r1/sin(1α)|, a2= |1r2/sin(1α)|, e2=a21+a22−2a1a2cos(1α),
f2=a12+a22−2a1a2cos(180◦−1α). (B2)
Figure B1.Calculation of mispointing uncertainty.
Finally, thex andy components of the uncertainty esti-mate, i.e.,1xand1y, are given by the projection of the over-lap parallelogram on thexandyaxes, respectively. Note that theyaxis is defined to be equivalent to the zenith direction.
αf =arccos(a22−a21−f2/(−2a1f ))+αcorr,2, 1xe=cos(αf)·e, 1xf =sin(αf)·f,
1ye=sin(αf)·e, 1yf =cos(αf)·f,
Table C1.Bias of XCH4monthly means between Garmisch and Zugspitze measurements and corresponding 95 % confidence intervals.
Results are presented for time intervals with different optical configurations and both a posteriori mispointing-corrected and uncorrected measurements.
Time interval Sep 2010–Aug 2012 Sep 2012–Oct 2014 Nov 2014–Mar 2015
Bias uncorrected (%) 2.04±0.18 1.46±0.27 2.24±0.37 Bias a posteriori-corrected (%) 1.96±0.19 1.60±0.19 2.05±0.36
Appendix C: Bias of XCH4monthly means between Zugspitze and Garmisch measurements
Acknowledgements. We thank the anonymous referees for their constructive and helpful comments, which led to signif-icant improvements of this manuscript. We furthermore thank H. P. Schmid (KIT/IMK-IFU) for his continual interest in this work and Markus Rettinger (KIT/IMK-IFU) for careful review of all algorithms. Funding by the Bavarian State Ministry of the Environment and Consumer Protection (contracts TLK01U-49581 and VAO-II TP I/01) is gratefully acknowledged. We are grateful for support by the Deutsche Forschungsgemeinschaft and Open Access Publishing Fund of the Karlsruhe Institute of Technology.
The article processing charges for this open-access publication were covered by a Research
Centre of the Helmholtz Association.
Edited by: A. Hofzumahaus
References
Adrian, G. P., Baumann, M., Blumenstock, T., Fischer, H., Friedle, A., Gerhardt, L., Maucher, G., Oelhaf, H., Scheuerpflug, W., Thomas, P., Trieschmann, O., and Weg-ner, A.: First results of ground-based FTIR measurements of atmospheric trace gases in North Sweden and Greenland during EASOE, Geophys. Res. Lett., 21, 1343–1346, 1994.
Borsdorff, T. and Sussmann, R.: On seasonality of stratomeso-spheric CO above midlatitudes: new insight from solar FTIR spectrometry at Zugspitze and Garmisch, Geophys. Res. Lett., 36, L21804, doi:10.1029/2009GL040056, 2009.
Giles, P. M.: Time-Distance Measurements of Large-Scale Flows in the Solar Convection Zone, PhD thesis, Stanford University, CA, USA, 2000.
Gisi, M., Hase, F., Dohe, S., and Blumenstock, T.: Camtracker: a new camera controlled high precision solar tracker sys-tem for FTIR-spectrometers, Atmos. Meas. Tech., 4, 47–54, doi:10.5194/amt-4-47-2011, 2011.
Gardiner, T., Forbes, A., de Mazière, M., Vigouroux, C., Mahieu, E., Demoulin, P., Velazco, V., Notholt, J., Blumenstock, T., Hase, F., Kramer, I., Sussmann, R., Stremme, W., Mellqvist, J., Strand-berg, A., Ellingsen, K., and Gauss, M.: Trend analysis of green-house gases over Europe measured by a network of ground-based remote FTIR instruments, Atmos. Chem. Phys., 8, 6719–6727, doi:10.5194/acp-8-6719-2008, 2008.
Hase, F.: Inversion von Spurengasprofilen aus hochaufgelösten bo-dengebundenen FTIR-Messungen in Absorption, PhD thesis, FZK Report No. 6512, Karlsruhe Institute of Technology, Ger-many, available at: http://www.imk-asf.kit.edu/downloads/bod/ disshase.pdf (last access: 17 June 2015), 2000.
Hase, F., Hannigan, J. W., Coffey, M. T., Goldman, A., Höpfner, M., Jones, N. B., Rinsland, C. P., and Wood, S. W.: Intercompari-son of retrieval codes used for the analysis of high-resolution, ground-based FTIR measurements, J. Quant. Spectrosc. Ra., 87, 25–52, doi:10.1016/j.jqsrt.2003.12.008, 2004.
Kasten, F., and Young, A. T.: Revised optical air mass ta-bles and approximation formula, Appl. Opt. 28, 4735–4738, doi:10.1364/AO.28.004735, 1989.
Kohlhepp, R., Ruhnke, R., Chipperfield, M. P., De Mazière, M., Notholt, J., Barthlott, S., Batchelor, R. L., Blatherwick, R. D.,
Blumenstock, Th., Coffey, M. T., Demoulin, P., Fast, H., Feng, W., Goldman, A., Griffith, D. W. T., Hamann, K., Hanni-gan, J. W., Hase, F., Jones, N. B., Kagawa, A., Kaiser, I., Ka-sai, Y., Kirner, O., Kouker, W., Lindenmaier, R., Mahieu, E., Mittermeier, R. L., Monge-Sanz, B., Morino, I., Murata, I., Nakajima, H., Palm, M., Paton-Walsh, C., Raffalski, U., Red-dmann, Th., Rettinger, M., Rinsland, C. P., Rozanov, E., Schnei-der, M., Senten, C., Servais, C., Sinnhuber, B.-M., Smale, D., Strong, K., Sussmann, R., Taylor, J. R., Vanhaelewyn, G., Warneke, T., Whaley, C., Wiehle, M., and Wood, S. W.: Ob-served and simulated time evolution of HCl, ClONO2, and HF total column abundances, Atmos. Chem. Phys., 12, 3527–3556, doi:10.5194/acp-12-3527-2012, 2012.
Liu, X., Blatherwick, R. D., Murcray, F. J., Keys, J. G., and Solomon, S.: Measurements and model calculations of HCl col-umn amounts and related parameters over McMurdo during the austral spring in 1989, J. Geophys. Res., 97, 20795–20804, doi:10.1029/92JD02435, 1992.
Mahieu, E., Chipperfield, M. P., Notholt, J., Reddmann, T., An-derson, J., Bernath, P. F., Blumenstock, T., Coffey, M. T., Dhomse, S. S., Feng, W., Franco, B., Froidevaux, L., Grif-fith, D. W. T., Hannigan, J. W., Hase, F., Hossaini, R., Jones, N. B., Morino, I., Murata, I., Nakajima, H., Palm, M., Paton-Walsh, C., Russell III, J. M., Schneider, M., Servais, C., Smale, D., and Walker, K. A.: Recent Northern Hemisphere stratospheric HCl increase due to atmospheric circulation changes, Nature, 515, 104–107, doi:10.1038/nature13857, 2014. Notholt, J., and Schrems, O.: Shipborne FT-IR Measurements of Atmospheric Trace Gases on a South (33◦S) to North (53◦N) Atlantic Traverse, Appl. Spectrosc., 49, 1525–1527, 1995. Ostler, A., Sussmann, R., Rettinger, M., Deutscher, N. M., Dohe, S.,
Hase, F., Jones, N., Palm, M., and Sinnhuber, B.-M.: Multistation intercomparison of column-averaged methane from NDACC and TCCON: impact of dynamical variability, Atmos. Meas. Tech., 7, 4081–4101, doi:10.5194/amt-7-4081-2014, 2014.
Ostler, A., Sussmann, R., Patra, P. K., Wennberg, P. O., Deutscher, N. M., Grith, D. W. T., Blumenstock, T., Hase, F., Kivi, R., Warneke, T., Wang, Z., de Mazière, M., Robinson, J., and Ohyama, H.: The imprint of stratospheric transport on column-averaged methane, Atmos. Chem. Phys., submitted, 2015. Palm, M., Melsheimer, C., Noël, S., Heise, S., Notholt, J.,
Bur-rows, J., and Schrems, O.: Integrated water vapor above Ny Ålesund, Spitsbergen: a multi-sensor intercomparison, Atmos. Chem. Phys., 10, 1215–1226, doi:10.5194/acp-10-1215-2010, 2010.
Pougatchev, N. S. and Rinsland, C. P.: Spectroscopic study of the seasonal variation of carbon monoxide vertical distribu-tion above Kitt Peak, J. Geophys. Res., 100, 1409–1416, doi:10.1029/94JD02387, 1995.
Pougatchev, N. S., Connor, B. J., Jones, N. B., and Rins-land, C. P.: Validation of ozone profile retrievals from infrared ground-based solar spectra, Geophys. Res. Lett., 23, 1637–1640, doi:10.1029/96GL01501, 1996.
Rinsland, C. P., Mahieu, E., Zander, R., Jones, N. B., Chipper-field, M. P., Goldman, A., Anderson, J., Russell, J. M., De-moulin, P., Notholt, J., Toon, G. C., Blavier, J.-F., Sen, B., Suss-mann, R., Wood, S. W., Meier, A., Griffith, D. W. T., Chiou, L. S., Murcray, F. J., Stephen, T. M., Hase, F., Mikuteit, S., Schulz, A., and Blumenstock, T.: Long-term trends of inorganic chlorine from ground-based infrared solar spectra: past increases and evidence for stabilization, J. Geophys. Res., 108, 4252–4272, doi:10.1029/2002JD003001, 2003.
Schneider, M. and Hase, F.: Technical Note: Recipe for monitoring of total ozone with a precision of around 1 DU applying mid-infrared solar absorption spectra, Atmos. Chem. Phys., 8, 63–71, doi:10.5194/acp-8-63-2008, 2008.
Schneider, M., Hase, F., and Blumenstock, T.: Water vapour pro-files by ground-based FTIR spectroscopy: study for an optimised retrieval and its validation, Atmos. Chem. Phys., 6, 811–830, doi:10.5194/acp-6-811-2006, 2006.
Sepúlveda, E., Schneider, M., Hase, F., García, O. E., Gomez-Pelaez, A., Dohe, S., Blumenstock, T., and Guerra, J. C.: Long-term validation of tropospheric column-averaged CH4mole frac-tions obtained by mid-infrared ground-based FTIR spectrometry, Atmos. Meas. Tech., 5, 1425–1441, doi:10.5194/amt-5-1425-2012, 2012.
Snodgrass, H. B. and Ulrich, R. K.: Rotation of Doppler fea-tures in the solar photosphere, Astrophys. J., 351, 309–316, doi:10.1086/168467, 1990.
Sussmann, R. and Schäfer, K.: Infrared spectroscopy of tro-pospheric trace gases: combined analysis of horizontal and vertical column abundances, Appl. Optics, 36, 735–741, doi:10.1364/AO.36.000735, 1997.
Sussmann, R., Borsdorff, T., Rettinger, M., Camy-Peyret, C., De-moulin, P., Duchatelet, P., Mahieu, E., and Servais, C.: Technical Note: Harmonized retrieval of column-integrated atmospheric water vapor from the FTIR network – first examples for long-term records and station trends, Atmos. Chem. Phys., 9, 8987– 8999, doi:10.5194/acp-9-8987-2009, 2009.
Sussmann, R., Forster, F., Rettinger, M., and Jones, N.: Strategy for high-accuracy-and-precision retrieval of atmospheric methane from the mid-infrared FTIR network, Atmos. Meas. Tech., 4, 1943–1964, doi:10.5194/amt-4-1943-2011, 2011.
Sussmann, R., Forster, F., Rettinger, M., and Bousquet, P.: Renewed methane increase for five years (2007–2011) observed by so-lar FTIR spectrometry, Atmos. Chem. Phys., 12, 4885–4891, doi:10.5194/acp-12-4885-2012, 2012.
Sussmann, R., Ostler, A., Forster, F., Rettinger, M., Deutscher, N. M., Griffith, D. W. T., Hannigan, J. W., Jones, N., and Patra, P. K.: First intercalibration of column-averaged methane from the Total Carbon Column Observing Network and the Network for the Detection of Atmospheric Composition Change, Atmos. Meas. Tech., 6, 397–418, doi:10.5194/amt-6-397-2013, 2013.
Toon, G., Blavier, J.-F., Washenfelder, R., Wunch, D., Keppel-Aleks, G., Wennberg, P., Connor, B., Sherlock, V., Griffith, D., Deutscher, N., and Notholt, J.: Total Column Carbon Observing Network (TCCON), available at: http://www.tccon.caltech.edu/ publications/OSA_FTS_Meeting_20090323.pdf (last access: 10 September 2015), 2009.
Vigouroux, C., De Mazière, M., Demoulin, P., Servais, C., Hase, F., Blumenstock, T., Kramer, I., Schneider, M., Mellqvist, J., Strand-berg, A., Velazco, V., Notholt, J., Sussmann, R., Stremme, W., Rockmann, A., Gardiner, T., Coleman, M., and Woods, P.: Eval-uation of tropospheric and stratospheric ozone trends over West-ern Europe from ground-based FTIR network observations, At-mos. Chem. Phys., 8, 6865–6886, doi:10.5194/acp-8-6865-2008, 2008.
Washenfelder, R. A., Wennberg, P. O., and Toon, G. C.: Tropospheric methane retrieved from ground-based near-IR solar absorption spectra, Geophys. Res. Lett., 30, 2226, doi:10.1029/2003GL017969, 2003.
Washenfelder, R. A., Toon, G. C., Blavier, J.-F., Yang, Z., Allen, N. T., Wennberg, P. O., Vay, S. A., Matross, D. M., and Daube, B. C.: Carbon dioxide column abundances at the Wisconsin Tall Tower site, J. Geophys. Res., 111, D22305, doi:10.1029/2006JD007154, 2006.
Wunch, D., Toon, G. C., Blavier, J.-F. L., Washenfelder, R. A., Notholt, J., Connor, B. J., Griffith, D. W. T., Sherlock, V., and Wennberg, P. O.: The Total Carbon Column Observ-ing Network, Philos. T. Roy. Soc. A, 369, 2087–2112, doi:10.1098/rsta.2010.0240, 2011.
Zander, R., Roland, G., Delbouille, L. Sauval, A., Farmer, C. B., and Norton, R. H.: Monitoring of the integrated column of hydrogen fluoride above the Jungfraujoch Station since 1977 – the HF/HCl column ratio, J. Atmos. Chem., 5, 385–394, doi:10.1007/BF00113901, 1987.