Longitudinal comparison between plasma and seminal HIV-1
viral loads during antiretroviral treatment
Comparação longitudinal entre cargas virais seminais e plasmáticas do HIV-1
durante terapia anti-retroviral
Lauro Ferreira da Silva Pinto Neto,1,2, Nilo F.R. Vieira2, Moacir Soprani2, Carla B. Cunha1, Valéria P. Cabral1, Reynaldo Dietze1 and Rodrigo Ribeiro-Rodrigues1
Abstract This study was designed to investigate the impact of anti-retroviral therapy on both plasma and seminal HIV-1 viral loads and the correlation between viral loads in these compartments after treatment. Viral load, CD4+
and CD8+ T-cell counts were evaluated in paired plasma and semen samples from 36 antiretroviral therapy-naïve
patients at baseline and on days 45, 90, and 180 of treatment. Slopes for blood and seminal viral loads in all treated patients were similar (p = 0.21). Median HIV-1 RNA titers in plasma and semen at baseline were 4.95 log10 and 4.48 log10 copies/ml, respectively. After 180 days of therapy, the median viral load declined to 3.15 log10 copies/ml (plasma) and 3.2 log10 copies/ml (semen). At this timepoint 22 patients presented HIV-1 viral load below 400 copies/ml in either plasma or semen, but only 9 had viral loads below 400 copies/ml in both compartments.
Key-words: Viral load. Semen. HIV-1. Antiretroviral therapy. Plasma.
Resumo Este estudo foi desenhado para investigar o impacto do tratamento com anti-retrovirais na evolução das cargas virais plasmáticas e seminais do HIV-1. A carga viral do HIV-1 e a contagem de linfócitos T CD4+ e
CD8+ foi determinada em amostras pareadas de sangue e sêmen de 36 pacientes virgem de tratamento nos
dias 0, 45, 90 e 180 após o início da terapia. As curvas de declínio das cargas virais plasmática e seminal foram semelhantes (p= 0.21). As medianas da carga viral plasmática e seminal no pré-tratamento (dia 0) foram 4.95 e 4.48 log10 cópias/ml, respectivamente. Seis meses após o início da terapia, a mediana da carga viral plasmática era 3.15 log10 cópias/ml e a seminal 3.2 log10 cópias/ml. Neste mesmo periodo, 22 pacientes apresentavam carga viral abaixo de 400 cópias/ml no plasma e/ou sêmen, enquanto apenas 9 pacientes apresentavam carga viral abaixo do limite de detecção nos dois compartimentos.
Palavras-chaves: Carga viral. Sêmen. HIV-. Terapia antiretroviral. Plasma.
1. Cellular and Molecular Immunology Laboratory, Núcleo de Doenças Infecciosas, Universidade Federal do Espírito Santo, Vitória, ES, Brazil. 2. Santa Casa de Misericórdia de Vitória, Vitória, ES, Brazil.
Address to: Dr. Rodrigo Ribeiro-Rodrigues. Núcleo de Doenças Infecciosas/CBM/UFES. Av. Marechal Campos 1468, Maruípe 29040-091 Vitória, ES, Brazil. Tel: 55 27 335-7207, Fax: 55 27 335-7204
e-mail: [email protected]
Recebido para publicação em 15/4/2002 Aceito em 10/11/2003
Despite the fact that HIV-1 was first recovered from semen samples in 1984, and sexual activity continues to be the most common form of HIV transmission, little is known about the impact of seminal viral load on HIV-1 infection1 8. A wide variety of biological and
behavioral factors have been associated with the risk of sexual transmission of HIV-114. Recently, a strong
association between HIV-1 plasma viral load and the risk of heterosexual transmission was reported13. It
has been suggested that high levels of HIV-1 replication probably contribute to both rapid disease progression and enhanced sexual transmission3 5 18. Small
short-term studies have demonstrated that antiretroviral therapy reduces both blood and seminal viral load and may diminish HIV transmission6 7 18. We have shown
that the correlation between plasma and seminal viral loads in therapy-naïve patients decreases in parallel with declining CD4 cell counts13.
The current study was conducted to prospectively evaluate the impact of antiretroviral therapy on HIV viral loads in plasma and semen of antiretroviral-naïve HIV-1+ patients; and, to compare viral loads in both
MATERIAL AND METHODS
Institutional Review Board. Prior to its
implementation, this study was submitted and approved by the Biomedical Center Internal Review Board. A signed informed consent was obtained from all enrolled patients before their inclusion in the study.
Patients. The study population consisted of 36
consecutive adult anti-retroviral therapy-naïve HIV-1+
men attending the HIV clinic at Santa Casa de Misericórdia, Vitória. ES, Brazil, between March 1998, and July 1999. All patients were free of signs or symptoms of sexually transmitted diseases. Clinical staging was performed according to the CDC classification system2. These patients were treated
with either two-drug (two nucleoside analogs reverse transcriptase inhibitors) or three-drug (two nucleoside analogs reverse transcriptase inhibitors plus one protease inhibitor or one non-nucleoside reverse transcriptase inhibitor regimens) schemes according to Brazilian Consensus on Antiretroviral Therapy, current at the time of the study10. After informed
consent, all 36 patients were requested to donate blood and semen samples at baseline and 45, 90, and 180 days after beginning therapy.
Quantitation of CD4+ lymphocytes in blood
samples. Blood was collected by venipuncture in
Vacuntainer tubes (Becton Dickinson, Franklin Lakes, New Jersey, USA) using K3-EDTA as an anticoagulant
and processed within 4 hours of collection. Peripheral blood CD4 and CD8 cell counts per microliter were determined by flow cytometry (FACScount, Becton & Dickinson, Mountain View, CA, USA) using standardized protocol recommended by the manufacturer. Results were expressed as mean ± standard deviation.
Quantitation of HIV-1 RNA in blood and seminal plasma samples. Plasma was obtained from K3
-EDTA-treated whole blood samples centrifuged at 600 x g for 7 minutes and stored in aliquots at -70°C within 4 hours of collection. In order to ensure the quality of semen samples, patients were asked to comply with a 72-hour sexual abstinence prior to sample collection. Semen samples were processed within 4h of ejaculation as described by Vernazza et al18. Briefly,
the total volume of semen was measured and the sample diluted 1:2 with viral transpor t medium (plain RPMI 1640 + 1000U/ml penicillin + 1000mg/ ml streptomycin). Diluted sample was centrifuged at 1,600 x g for 5 min, and the supernatant was
collected. Aliquots were stored at -70°C until used for the quantification of HIV-1 RNA. Semen samples are referred to as seminal plasma. HIV-1 viral load in either blood plasma (PVL) or seminal plasma (SVL) were quantified by the NASBA method (Organon Teknika, Durham, Nor th Carolina, USA)4 16. The
detection limit of the assay was 400 HIV-1 RNA copies/ml. Both plasma and seminal viral load results were expressed as medians. In order to evaluate inter-sample variability in PVL and SVL, 2 consecutive paired blood and semen samples were collected and analyzed (interval of 11.2 ±7.5 weeks between the two collection points) from 17 therapy-naïve patients before the treatment began.
Treatment. Antiretroviral regimen for each patient
was selected by the physician in charge following the guidelines of the Brazilian Consensus on Antiretroviral Therapy in place at the time of the study. Twelve patients were treated with two nucleoside analog reverse transcriptase inhibitors (9 used AZT + ddI and 3 used AZT + ddC). Whereas, 24 patients were treated with three drugs, 2/24 patients were treated with nucleoside analogs (AZT + 3TC) and a non-nucleoside reverse transcriptase inhibitors (Efavirenz) and the remaining 22 patients were treated with two nucleoside analogs (AZT + 3TC) and a protease inhibitor (10 with Indinavir, 8 with Ritonavir and 4 with Nelfinavir). For fur ther analysis and discussion of results, these patients were divided into those receiving two-drug regimens (12 patients) and those receiving three-drug regimens (24 patients). Patient compliance was encouraged and followed by the clinical team throughout the protocol.
Statistical analysis. Considering the non-normal
distribution of RNA concentrations, confirmed by Kolmogorov-Smirnov tests, continuous variables were analyzed following log transformation and linear regression analysis by the Wilcoxon’s test. Correlations between non-parametric variables (HIV-1 RNA titers on blood and semen, CD4 and CD8 counts) were evaluated using Spearman’s rank correlation test. The decline of viral load slopes on blood plasma and semen samples were compared by multivariate analysis. All statistical analyses were carried out using SPSS 8.0 software (SPSS Inc) and by SAS (SAS institute Inc. SAS/STAT guide for personal computers, version 6, Cary, NC, USA).
RESULTS
The mean age for the 36 enrolled patients was 33.7 ±9.6 years, with a predominance of Caucasians (58.3%, 21/36 patients). Twenty-three patients were homosexual/ bisexual, 9 were heterosexuals and 4 were intravenous-drug users. At baseline 7 patients (19%) had CD4 cell counts higher than 500 cells/µl, 15 (42%) had cell counts
between 499 and 200 CD4 cells/µl and 14 (39%) patients had CD4 counts less than 200 CD4 cells/µl.
(4 patients), tuberculosis (3 patients), cryptococcal meningitis (2 patients), neurotoxoplasmosis (1 patient), esophageal candidiasis (2 patients), recurrent bacterial pneumonia (1 patient), five patients presented more than one of the oppor tunistic infections/clinical manifestations described above.
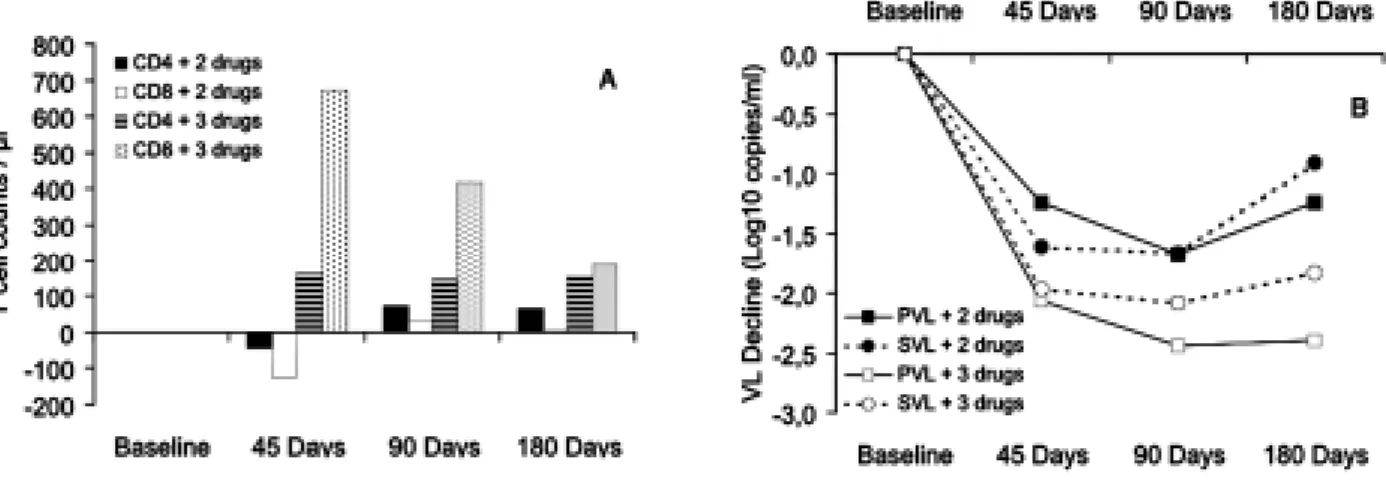
The mean CD4+ and CD8+ T cell counts, at baseline,
were 313 ± 242 cells/ml (32 - 964 cells/µl) and 1,189 ±486 cells/ml (266 - 2,292 cells/µl), respectively (Table 1). At 6 months of treatment CD4+ cell counts
improved with antiretroviral therapy, patients with a mean increase of 123 CD4+ cells/µl (Table 1 and Figure
1A). Improvement in CD4+ and CD8+ T cell counts were
significantly greater among patients taking 3-drug when compared to those on 2-drug combinations. After therapy began, CD4/CD8 T cell ratios improved at 90 and 180 days after initiation of antiretroviral therapy and were 0.30, and 0.34, respectively, when compared to the ratio at baseline (CD4/CD8 = 0.27).
HIV-1 RNA was detected and quantified at baseline on all blood and semen samples. Inter-sample variability in PVL and SVL was evaluated using 2
consecutive paired blood and semen samples collected from 17 treatment-naïve patients. Albeit PVL and SVL in these 17 patients were not significantly different (p = 0.463 and p = 0.906, respectively), SVL samples presented a broader variation when compared to their paired PVL samples (data not shown).
Baseline PVL and SVL for all antiretroviral-naive patients studied were 4.95 log10 copies/ml (3.51 - 5.92 log10 copies/ml) and 4.48 log10 copies/ml (3.04 - 6.11log/ml), respectively. After therapy initiation, a significant reduction in plasma samples was observed (p = 0.000): PVL at days 45, 90 and 180 were 3.08, 2.86, and 3.15 log10 copies/ ml, respectively. A similar significant decrease was also observed for SVL at 45, 90, and 180 days of therapy (3.26, 2.47, and 3.2 log10 copies/ml, respectively) (Table 1 and Figure 1B). Patients receiving 2-drug versus 3-drug regimen presented significant differences only on PVL reduction (p = 0.011). However no statistical difference was seen between SVL reduction in patients receiving 2-versus 3-drug regimens (Figure 1B). When all patients were considered, reduction rates in PVL and SVL were similar during treatment, as demonstrated by multivariate analysis (F3.210 = 1.52; p = 0.21) (Table 1 and Figure 2).
Table 1 - Evolution of CD4 & CD8 counts; plasmatic and seminal HIV-1 viral burden with therapy*.
Timepoints
Baseline 45days 90 days 180 days
CD4+ T cells 313 ± 242 415 ± 214 437 ± 227 436 ± 258 CD8+ T cells 1189 ± 486 1608 ± 1067 1490 ± 626 1279 ± 484
PVL 4.95 3.08 2.86 3.15
SVL 4.48 3.26 2.47 3.20
* CD4 & CD8 cell counts are expressed as mean ± standard deviation of cell counts/µl. PVL and SVL are expressed as medians of log10 copies/ml.
Only 9/36 (25%) patients presented both PVL and SVL below the assay’s detection limit after 6 months of antiretroviral therapy, 2 patients receiving 2-drug regimens and 7 on 3-drug combinations (Table 2). At 6 months, 13 patients presented discordant HIV-1 viral loads, 6/36 (17%)
had non-detectable PVL but detectable SVL (1 patient receiving 2-drug and 5 on 3-drug regimens). On the other hand, 7/36 (19%) patients presented non-detectable SVL but a detectable PVL (2 patients receiving 2-drug combinations and 5 on 3-drug regimens) (Table 1).
Figure 2 - Median HIV-1 viral load on both plasma and seminal samples from all 36 patients receiving antiretroviral therapy.
PVL = plasma viral load and SVL = seminal viral load. Median±SEM (standard of the mean).
DISCUSSION
In the present work, we investigated the impact of anti-retroviral therapy on CD4 counts, PVL and SVL in 36 patients with HIV infection during a 6-month period after treatment initiation. In our study, the mean increase in CD4 counts after 6 months of treatment was lower than that previously reported12 15. This
difference was probably due to the fact that a subset of patients had received a 2-drug regimen during follow-up. In fact, when only patients taking 3-drug (24/36) were considered, an increase of 161 CD4+ cells/µl was
observed, which is similar to the improvement (150 CD4+ cells/µl) previously reported by Schooley et al15.
After 6 months of antiretroviral therapy, 25% of patients (9/36) had undetectable PVL and SVL, 2 treated with 2-drug regimens and 7 with a 3-drug combination (Table 2). Some patients presented discordant HIV-1 viral loads, 6/36 (17%) had non-detectable PVL but detectable SVL and 7 (19%) presented non-detectable SVL but a detectable PVL. Fifteen out of 36 treated patients (42%) had PVL below the detection limit after 6 months of therapy. Again, if separated according to their therapeutic schemes, 25% (3/12) of the patients taking 2 drugs and 50% (12/24) of the patients taking 3 drugs had non-detectable PVL. The difference between the two groups was not significant (p = 0.27), probably due to the size of our cohort.
At baseline, when patients were grouped according to their CD4 cell counts, correlation between PVL and
SVL was dependent on the CD4 cell counts. No correlation between PVL and SVL was observed among patients with CD4 counts below 200 CD4+ cells/µl.
However, after 6 months of treatment, the correlation between PVL and SVL was no longer dependent on CD4+ cell counts (data not shown). During treatment,
a similar decrease was observed in both PVL and SVL (p = 0.21), confirming previously published results indicating an overall correlation between PVL and SVL4 17.
Our study confirms the decline in SVL after antiretroviral therapy as described by other authors1 6 11 18.
However, the lack of correlation between PVL and SVL in a significant number of patients in our cohort suggests that, in a clinical setting, when inhibition of HIV-1+ replication in blood plasma is achieved it may
not be the case in another compartment, such as germinal tissues. Clearly, it may amplify the risk of development of drug-resistant mutants as described before9. Therefore,
more studies are needed to fully investigate the efficacy of antiretroviral therapy on HIV load in semen from HIV-1+ patients and its impact on viral shedding.
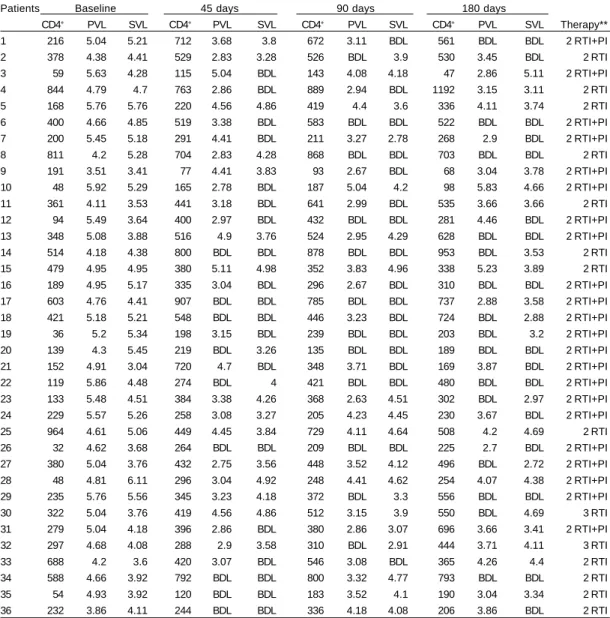
Table 2 - CD4+ cell counts and viral load determination at baseline, 45, 90 and 180 days of antiretroviral therapy*.
Patients Baseline 45 days 90 days 180 days
CD4+ PVL SVL CD4+ PVL SVL CD4+ PVL SVL CD4+ PVL SVL Therapy**
1 216 5.04 5.21 712 3.68 3.8 672 3.11 BDL 561 BDL BDL 2 RTI+PI
2 378 4.38 4.41 529 2.83 3.28 526 BDL 3.9 530 3.45 BDL 2 RTI
3 59 5.63 4.28 115 5.04 BDL 143 4.08 4.18 47 2.86 5.11 2 RTI+PI
4 844 4.79 4.7 763 2.86 BDL 889 2.94 BDL 1192 3.15 3.11 2 RTI
5 168 5.76 5.76 220 4.56 4.86 419 4.4 3.6 336 4.11 3.74 2 RTI
6 400 4.66 4.85 519 3.38 BDL 583 BDL BDL 522 BDL BDL 2 RTI+PI
7 200 5.45 5.18 291 4.41 BDL 211 3.27 2.78 268 2.9 BDL 2 RTI+PI
8 811 4.2 5.28 704 2.83 4.28 868 BDL BDL 703 BDL BDL 2 RTI
9 191 3.51 3.41 77 4.41 3.83 93 2.67 BDL 68 3.04 3.78 2 RTI+PI
10 48 5.92 5.29 165 2.78 BDL 187 5.04 4.2 98 5.83 4.66 2 RTI+PI
11 361 4.11 3.53 441 3.18 BDL 641 2.99 BDL 535 3.66 3.66 2 RTI
12 94 5.49 3.64 400 2.97 BDL 432 BDL BDL 281 4.46 BDL 2 RTI+PI
13 348 5.08 3.88 516 4.9 3.76 524 2.95 4.29 628 BDL BDL 2 RTI+PI
14 514 4.18 4.38 800 BDL BDL 878 BDL BDL 953 BDL 3.53 2 RTI
15 479 4.95 4.95 380 5.11 4.98 352 3.83 4.96 338 5.23 3.89 2 RTI
16 189 4.95 5.17 335 3.04 BDL 296 2.67 BDL 310 BDL BDL 2 RTI+PI
17 603 4.76 4.41 907 BDL BDL 785 BDL BDL 737 2.88 3.58 2 RTI+PI
18 421 5.18 5.21 548 BDL BDL 446 3.23 BDL 724 BDL 2.88 2 RTI+PI
19 36 5.2 5.34 198 3.15 BDL 239 BDL BDL 203 BDL 3.2 2 RTI+PI
20 139 4.3 5.45 219 BDL 3.26 135 BDL BDL 189 BDL BDL 2 RTI+PI
21 152 4.91 3.04 720 4.7 BDL 348 3.71 BDL 169 3.87 BDL 2 RTI+PI
22 119 5.86 4.48 274 BDL 4 421 BDL BDL 480 BDL BDL 2 RTI+PI
23 133 5.48 4.51 384 3.38 4.26 368 2.63 4.51 302 BDL 2.97 2 RTI+PI
24 229 5.57 5.26 258 3.08 3.27 205 4.23 4.45 230 3.67 BDL 2 RTI+PI
25 964 4.61 5.06 449 4.45 3.84 729 4.11 4.64 508 4.2 4.69 2 RTI
26 32 4.62 3.68 264 BDL BDL 209 BDL BDL 225 2.7 BDL 2 RTI+PI
27 380 5.04 3.76 432 2.75 3.56 448 3.52 4.12 496 BDL 2.72 2 RTI+PI
28 48 4.81 6.11 296 3.04 4.92 248 4.41 4.62 254 4.07 4.38 2 RTI+PI
29 235 5.76 5.56 345 3.23 4.18 372 BDL 3.3 556 BDL BDL 2 RTI+PI
30 322 5.04 3.76 419 4.56 4.86 512 3.15 3.9 550 BDL 4.69 3 RTI
31 279 5.04 4.18 396 2.86 BDL 380 2.86 3.07 696 3.66 3.41 2 RTI+PI
32 297 4.68 4.08 288 2.9 3.58 310 BDL 2.91 444 3.71 4.11 3 RTI
33 688 4.2 3.6 420 3.07 BDL 546 3.08 BDL 365 4.26 4.4 2 RTI
34 588 4.66 3.92 792 BDL BDL 800 3.32 4.77 793 BDL BDL 2 RTI
35 54 4.93 3.92 120 BDL BDL 183 3.52 4.1 190 3.04 3.34 2 RTI
36 232 3.86 4.11 244 BDL BDL 336 4.18 4.08 206 3.86 BDL 2 RTI
*PVL = Blood plasma viral load. SVL = Seminal plasma viral load; CD4 expressed as CD4+ cells/µl and both PVL and SVL expressed as Log10 copies/ml. BDL = Below detection limit (400 copies/ml; 2.6 Log10 copies/ml). ** RTI = Reverse Transcriptase Inhibitors. PI = Protease Inhibitor.
REFERENCES
1. Barroso PF, Schechter M, Gupta P, Melo MF, Vieira M, Murta FC, Souza Y, Harrison LH. Effect of antiretroviral therapy on HIV shedding in semen. Annals of Internal Medicine 133: 280-284, 2000.
2. Centers for Diseases Control and Prevention. 1993 revised classification system for HIV infection and expanded
surveillance case definition for AIDS among adolescents and adults. Mortality and Morbidity Weekly Report 41: 1-19, 1992.
genital ulcer disease in HIV-1—infected men in Malawi. Journal of Infectious Diseases 177: 224-227, 1998a.
4. Dyer JR, Gillian BL, Eron JR JJ, Grosso L, Cohen MS, Fiscus SA. Quantitation of human immunodeficiency virus type 1 RNA in cell free seminal plasma: comparison of NASBA with Amplicor reverse transcription-PCR amplification and correlation with quantitative culture. Journal of Virological Methods 60: 161-170, 1996.
5. Dyer JR, Kazembe P, Vernazza PL, Gilliam BL, Maida M, Zimba D, Hoffman IF, Royce RA, Schock JL, Fiscus SA, Cohen MS, Eron JJ Jr. High levels of human immunodeficiency virus type 1 in blood and semen of seropositive men in Sub-Saharan Africa. Journal of Infectious Diseases 177: 1742-1746, 1998b.
6. Gilliam BL, Dyer JR, Fiscus SA, Marcus C, Zhou S, Wathen L, Freimuth WW, Cohen MS, Eron JJ Jr. Effects of reverse transcriptase inhibitor therapy on the HIV-1 viral burden in semen. Journal of Acquired Immune Deficiency Syndrome and Human Retrovirology 15: 54-60, 1997.
7. Gupta P, Mellors J, Kingsley L, Riddler S, Singh MK, Schreiber S, Cronin M, Rinaldo CR. High viral load in semen of human immunodeficiency virus type 1-infected men at all stages of disease and its reduction by therapy with protease and nonnucleoside reverse transcriptase inhibitors. Journal of Virology 71: 6271-6275, 1997.
8. Ho DD, Schooley RT, Rota TR, Kaplan JC, Flynn T, Salahuddin SZ, Gonda MA, Hirsch MS. HTLV-III in the semen and blood of a healthy homosexual man. Science 226: 451-453, 1984.
9. Mayer KH, Boswell S, Goldstein R, Lo W, Xu C, Tucker L, DePasquale MP, D’Aquila R, Anderson DJ. Persistence of human immunodeficiency virus in semen after adding indinavir to combination antiretroviral therapy. Clinical Infectious Diseases 28: 1252-1259, 1999.
10. Ministério da Saúde. Coordenação Nacional de DST/AIDS. Guia de tratamento clínico das infeções pelo HIV em adultos e adolescentes. Brasília, 1997.
11. Musicco M, Lazzarin A, Nicolosi A, Gasparini M, Costigliola P, Arici C, Saracco A. Antiretroviral treatment of men infected with human immunodeficiency virus type 1 reduces the incidence of heterosexual transmission. Archives of Internal Medicine 154: 1971-1976, 1994.
12. Pakker NG, Notermans DW, de Boer RJ, Roos MT, de Wolf F, Hill A, Leonard JM, Danner SA, Miedema F, Schellekens PT. Biphasic kinetics of peripheral blood T cells after triple combination therapy in HIV-1 infection: a composite of redistribution and proliferation. Nature Medicine 4: 208-214, 1998.
13. Pinto-Neto LF, Vieira NF, Soprani M, Cunha CB, Dietze R, Ribeiro-Rodrigues R. Lack of correlation between seminal and plasma HIV-1 viral loads is associated with CD4 T cell depletion in therapy-naive HIV-1+ patients. Memórias do Instituto Oswaldo Cruz 97:563-567, 2002.
14. Quinn TC, Wawer MJ, Sewankambo N, Serwadda D, Li C, Wabwire-Mangen F, Meehan MO, Lutalo T, Gray RH. Viral load and heterosexual transmission of human immunodeficiency virus type 1. Rakai Project Study Group. New England Journal of Medicine 342: 921-929, 2000.
15. Schooley RT. Longer-term immunologic effects and side effects of successful antiretroviral therapy. Clinical Infectious Diseases 29: 12-18, 1999.
16. van Gemen B, van Beuningen R, Nabbe A, van Strijp D, Jurriaans S, Lens P, Kievits T. A one-tube quantitative HIV-1 RNA NASBA nucleic acid amplification assay using electrochemiluminescent (ECL) labelled probes. Journal of Virological Methods 49: 157-168, 1994.
17. Vernazza PL, Dyer JR, Fiscus SA, Eron JJ, Cohen MS. HIV-1 viral load in blood, semen and saliva. [Letter] AIDS 11: 1058-1059, 1997.