Lack of Correlation between Seminal and Plasma HIV-1 Viral
Loads is Associated with CD4
T Cell Depletion in Therapy-naïve
HIV-1
+
Patients
Lauro FS Pinto-Neto*, Nilo FR Vieira*, Moacir Soprani*, Carla B Cunha, Reynaldo Dietze,
Rodrigo Ribeiro-Rodrigues/
+Laboratório de Imunologia Celular e Molecular, Núcleo de Doenças Infecciosas, Universidade Federal do Espírito Santo, Av. Marechal Campos 1468, 29040-091 Vitória, ES, Brasil *Santa Casa de Misericordia de Vitoria, Vitória, ES, Brasil
The present study was conducted to investigate a possible correlation between plasma (PVL) and seminal viral load (SVL) on treatment-naïve HIV-1-infected patients in Vitória, ES, Brazil. We also evaluated whether the pro-gressive immunosuppression associated with HIV disease (as evidenced by declining CD4 T cell counts) has any impact on the correlation between PVL and SVL HIV-1. Viral load on paired blood and semen samples from 56 consecutive treatment-naïve patients were evaluated and compared to CD4 cell counts. Viral load and T cell counts (cells/µl) were determined by NASBA and by flow cytometry, respectively. Overall, a strong positive correlation between PVL and SVL (rho = 0.438, p = 0.001) was observed. However, when patients were grouped according to their CD4 counts, this correlation was only significant among patients with CD4 counts > 200 cells/µl. Results presented here demonstrate the existence of a strong correlation between PVL and SVL on patients with CD4 cell counts > 200 cells/µl, suggesting that this association may correlate with disease progression.
Key words: seminal viral load - plasmatic viral load - HIV - compartmentalization - CD4 T cell counts
Measures to prevent the continued propagation of the HIV pandemic not only require diagnosis of infected individuals, but also means for identifying subjects who are most likely to transmit HIV to others. Peripheral blood CD4 T-cell counts provide a good estimate of immune function (or disease stage), whereas HIV-1 viral load in plasma of infected individuals may be useful in assessing both the likelihood of disease progression and the likeli-hood of transmission of HIV-1 to previously uninfected persons (Quinn et al. 2000). Correlation between blood plasma viral load (PVL) and seminal viral load (SVL) has been a controversial issue (Hamed et al. 1993, Liuzzi et al. 1996, Gupta et al. 1997, Vernazza et al. 1997). Ho et al. (1984) were the first authors to demonstrate the presence of HIV-1 in semen samples. Although, HIV pandemic is still driven by sexual transmission, little is known about the role of seminal viral load on HIV-1 infection. Data from other authors indicates that the efficiency of sexual transmission is directly associated with the inoculum’s size (Miller et al. 1992, Levy 1993, Dyer et al. 1998) and that SVL correlates strongly with HIV-1 shedding in semi-nal cell cultures (Vernazza et al. 1997). According to Dyer et al. (1998) high levels of HIV-1 replication probably con-tribute to both rapid disease progression and enhanced
This work was partially supported by the Brazilian Ministry of Health/CN-DST and AIDS/UDAT.
+Corresponding author. Fax: +55-27-335.7207. E-mail:
[email protected] Received 6 August 2001 Accepted 30 November 2001
sexual transmission. Taken together these results sug-gest that SVL may correlate with HIV infectivity.
This cross-sectional study was designed to investi-gate the correlation between PVL and SVL in paired blood and seminal samples and their association with CD4 cell counts on anti-retroviral therapy naïve patients in Vitória, ES, Brazil.
MATERIALS AND METHODS
Patients - Fifty-six consecutive adult HIV-1+ men at-tending to the HIV clinic at Hospital da Santa Casa de Misericórdia, Vitória, from March 1998 to July 1999 were enrolled in the present study. All patients were treat-ment-naïve and did not display signs or symptoms of sexu-ally transmitted diseases other than HIV and were asked to donate two blood and one semen sample at enrollment. Prior to its inception, this study was submitted and ap-proved by the local ethical committee. A signed informed consent was obtained from all patients, preceding their inclusion in the study. Clinical staging was performed according to the revised Centers for Disease Control and Prevention classification system (CDC 1992).
Quantification of CD4+ lymphocytes in blood samples - Whole blood was collected in Vacutainer tubes (Becton Dickinson, Franklin Lakes, New Jersey, USA) using K3 -EDTA as anticoagulant. Blood CD4 T-cell counts (ex-pressed as total numbers of lymphocytes per microliter of blood) were determined by flow cytometry (FACScount, Becton & Dickinson, Mountain View, CA, USA) using the standard protocol recommended by the manufacturer. Blood samples were processed within 4 h of collection.
that described above) by centrifugation at 600 x g for 7 min. Cell free plasma samples were stored in aliquots at -70°C until assessment of viral load by NASBA. Prior to sample collection, patients were asked to adhere to a 72-hour sexual abstinence. Semen samples were processed within 4 h of ejaculation as described by Vernazza et al. (1996). HIV-1 RNA on both blood plasma and seminal plasma were quantified by the NASBA method (Nuclisens, Organon Teknika, Durham, North Carolina) (Dyer et al. 1996). This assay has a lower limit of detection of 400 HIV-1 RNA copies/ml.
Statistical analysis - The non-normal distribution of HIV-1 RNA titers in plasma and seminal samples was con-firmed by Kolmogorov-Smirnov tests. Data were analyzed following log transformation and linear regression analy-sis by the Wilcoxon’s test. Correlations between non-parametric variables (PVL and SVL, CD4 and CD8 counts) were evaluated using Spearman’s rank correlation test. All statistical analyses were carried out using the SPSS 8.0 (SPSS Inc.) and SAS (SAS Institute Inc. SAS/STAT guide for personal computers, version 6, Cary, NC, USA) softwares.
RESULTS
Characteristics of the studied population - Clinical staging, CD4 cell counts and age are summarized in the Table. The observed CD4 counts for the 56 patients ranged from 10 to 964 cells/µl (AVG ± SD = 359 ± 250 CD4+ cells/ µl), and CD8counts from 260 to 2292 CD8+ cells/µl (AVG ± SD = 1132 ± 500 CD8+ cells/µl) (Table).
When patients were grouped according to their clini-cal stage, 15 patients (27%) were classified as Group 1 (CD4 > 500/µl), 24 (43%) as Group 2 (200/µl < CD4 < 500/ µl) and 17 (30%) as Group 3 (CD4 < 200/µl). The average CD4counts for patients at Groups 1, 2, and 3 were 703 ± 114 cells/µl, 328 ± 99 cells/µl, and 98 ± 46 cells/µl, respec-tively, whereas the mean average (AVG ± SD) CD8 counts for Groups 1, 2, and 3 were 1308.3 ± 396, 1163.7 ± 676 and 930 ± 105 cells/µl, respectively. The average CD4/CD8 ratios were 0.53, 0.28, and 0.10 for Groups 1, 2, and 3, respectively.
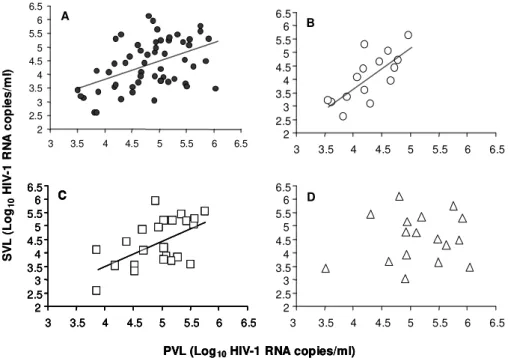
The median PVL and SVL were 4.92 log10 copies/ml and 4.33 log10 copies/ml, respectively. When patients were grouped according to their CD4 cell counts/µl, the median PVL for Groups 1, 2, and 3 were 4.20, 5.04, and 5.11 log10 copies/ml, respectively, whereas the median SVL was 4.06 log10 copies/ml for Group 1, 4.15 log10 copies/ml for Group 2, and 4.51 log10 copies/ml for Group 3 (Table). Correlation between viral load and T cell counts -When samples from all patients were considered, Spearman’s rank correlation test revealed a correlation (Spearman’s rank = 0.438, p < 0.001) between PVL and SVL, which was also confirmed by linear regression analy-sis (R2 = 0.209, p < 0.001, Fig. 1A).
A negative correlation (Spearman’s rank = -0.502, p < 0.0001; R2 = 0.239) was observed between PVL and CD4+ counts. Conversely, no correlation was observed between SVL and peripheral blood CD4+ counts (R2 = 0.018, p = 0.126), and between CD8+ cell counts and HIV-1 viral load (either PVL or SVL, Figs 2A, 2B).
Relationship between viral load and immunological status - Correlation between PVL and SVL was only ob-served in patients with CD4 counts > 200 cells/µl, and most strikingly so (Spearman’s rank = 0.697, p < 0.004 and R2 = 0.546) (Fig. 1B) on patients with the highest CD4 counts (Group 1). Although still significant, the correla-tion between PVL and SVL on patients in Group 2 was less pronounced (Spearman’s rank = 0.488, p < 0.016 and R2 = 0.290) (Fig. 1C). No correlation (Spearman’s = 0.044, p > 0.866 and R2 = 0.016) was observed on patients with CD4 counts < 200 cells/µl (Fig. 1D).
HIV-1 viral load on consecutive seminal or plasmatic samples - When paired samples were compared individu-ally, 32 out of 56 patients (57%) had significantly discor-dant PVL and SVL (difference > 0.5 log10). Among these 32 patients, 27 (84%) had PVL higher than SVL by more than > 0.5 log10, whereas PVL was significantly lower than SVL only in 5 patients (16%) (Table). A decrease of the correlation between PVL and SVL in parallel to a de-crease in the CD4 cell counts was also observed. Discor-dant results between PVL and SVL were most commonly observed among patients with more advanced HIV
dis-TABLE
Characteristics of the study population
Total Group 1 Group 2 Group 3
N (%) 56 (100) 15 (27) 24 (43) 17 (30)
Age 34.4 ± 8.8 34.2 ± 7.0 35.1 ± 10.7 33.5 ± 11.1
CD4 359 ± 250 703 ± 114 328 ± 99 98 ± 46
CD8 1132 ± 500 1308 ± 396 1164 ± 676 930 ± 105
PVL 4.92 4.20 5.04 5.11
SVL 4.33 4.06 4.15 4.51
PVL ≅ SVL (%) 24 (43) 8 (54) 10 (42) 6 (35)
PVL > SVL (%) 27 (48) 5 (33) 13 (54) 9 (53)
PVL < SVL (%) 5 (9) 2 (13) 1 (4) 2 (12)
ease, as evidenced by lower CD4 T cell counts. PVL and SVL were discordant in 65%, 58%, and 46% of study sub-jects in Groups 3, 2 and 1, respectively (Table). To ex-clude the possibility of inter-assay variability, we collected two consecutive (collection time varying from 3-26 weeks) paired blood and semen samples from a subset of 17 therapy-naïve patients and compared their PVL and SVL. SVL on collections 1 and 2 were discordant on 35.3% of patients; whereas, 17.6% of these 17 patients had discor-dant PVL (Fig. 3).
DISCUSSION
A strong correlation between PVL and SVL was ob-served for all 56 HIV-1 patients, regardless of their clinical stage, confirming previous reports (Gupta et al. 1997, Vernazza et al. 1997, Dyer et al. 1998, Coombs et al. 1998, Fiscus et al. 1998). However, once patients were grouped according to their CD4 cell counts, correlation between PVL and SVL decreased in parallel to the decline of CD4+ T cell counts. Patients with CD4 cell counts > 500 cells/µl presented the strongest correlation between PVL and SVL; a significant but less strong correlation was also observed on patients with 500 < CD4 < 200 cells/µl; and no correlation among patients with CD4 cell counts < 200 cells/µl. To our knowledge this is the first report to show that the correlation between PVL and SVL is dependent on the peripheral blood CD4+ T cell concentration.
One may question if the lack of correlation between PVL and SVL was due to inter-assay variability or due to an intermittent HIV-1 shedding pattern (Krieger et al. 1995, Gupta et al. 2000). We decided to investigate if a technical PVL (Log10HIV-1 RNA copies/ml)
2 2.5 3 3.5 4 4.5 5 5.5 6 6.5
3 3.5 4 4.5 5 5.5 6 6.5
2 2.5 3 3.5 4 4.5 5 5.5 6 6.5
3 3.5 4 4.5 5 5.5 6 6.5
2 2.5 3 3.5 4 4.5 5 5.5 6 6.5
3 3.5 4 4.5 5 5.5 6 6.5
2 2.5 3 3.5 4 4.5 5 5.5 6 6.5
3 3.5 4 4.5 5 5.5 6 6.5 A C B D SV L (Lo g10 H IV -1 R N A co p ies /m l)
PVL (Log10HIV-1 RNA copies/ml) 2 2.5 3 3.5 4 4.5 5 5.5 6 6.5
3 3.5 4 4.5 5 5.5 6 6.5
2 2.5 3 3.5 4 4.5 5 5.5 6 6.5
3 3.5 4 4.5 5 5.5 6 6.5
2 2.5 3 3.5 4 4.5 5 5.5 6 6.5
3 3.5 4 4.5 5 5.5 6 6.5
2 2.5 3 3.5 4 4.5 5 5.5 6 6.5
3 3.5 4 4.5 5 5.5 6 6.5 A
C
B
D
PVL (Log10HIV-1 RNA copies/ml) 2 2.5 3 3.5 4 4.5 5 5.5 6 6.5
3 3.5 4 4.5 5 5.5 6 6.5
2 2.5 3 3.5 4 4.5 5 5.5 6 6.5
3 3.5 4 4.5 5 5.5 6 6.5
2 2.5 3 3.5 4 4.5 5 5.5 6 6.5
3 3.5 4 4.5 5 5.5 6 6.5
2 2.5 3 3.5 4 4.5 5 5.5 6 6.5
3 3.5 4 4.5 5 5.5 6 6.5 A C B D 2 2.5 3 3.5 4 4.5 5 5.5 6 6.5
3 3.5 4 4.5 5 5.5 6 6.5
2 2.5 3 3.5 4 4.5 5 5.5 6 6.5
3 3.5 4 4.5 5 5.5 6 6.5
2 2.5 3 3.5 4 4.5 5 5.5 6 6.5
3 3.5 4 4.5 5 5.5 6 6.5
2 2.5 3 3.5 4 4.5 5 5.5 6 6.5
3 3.5 4 4.5 5 5.5 6 6.5 A C B D SV L (Lo g10 H IV -1 R N A co p ies /m l)
Fig. 1A: correlation between plasmatic viral load (PVL) and seminal viral load (SVL) on paired samples from all 56 patients enrolled regardless of immunological status (Spearman’s rank = 0.438, p < 0.001 and R2 = 0.209, p < 0.001); B: correlation between PVL and SVL load on patients with CD4 > 500 cells/µl (Spearman’s rank = 0.697, p < 0.004 and R2 = 0.546, p < 0.004); C: patients with 500 > CD4 >
200 cells/µl (Spearman’s rank = 0.488, p < 0.016 and R2 = 0.290, p < 0.001); D: patients with CD4 < 200 cells/µl (Spearman’s = 0.044, p
> 0.866 and R2 = 0.016, p > 0.342)
3 3,5 4 4,5 5 5,5 6 6,5
0 200 400 600 800 1000 1200
3 3,5 4 4,5 5 5,5 6 6,5
0 200 400 600 800 1000 1200
CD4+ T cell counts (cells/µl)
PV L (Log10 ) SV L (Log10 ) A B 3 3,5 4 4,5 5 5,5 6 6,5
0 200 400 600 800 1000 1200
3 3,5 4 4,5 5 5,5 6 6,5
0 200 400 600 800 1000 1200
CD4+ T cell counts (cells/µl)
PV L (Log10 ) SV L (Log10 ) A B
Fig. 2: correlations between CD4 cell counts and either plasmatic (PVL) or seminal viral load (SVL) on paired samples from the whole studied population. A: strong negative correlation between CD4 cell counts and PVL (Spearman’s rank = -0.502, p < 0.0001; R2= 0.239, p < 0.000); B: lack of correlation between seminal
HIV-1 RNA titers and peripheral blood CD4+ counts (R2 = 0.018, p =
artifact or intermittent shedding was responsible for the loss of correlation between PVL and SVL; by evaluating PVL and SVL on two consecutive samples from 17 drug naïve patients. In three patients (17.6%) PVL of two con-secutive samples differed significantly, whereas SVL was discordant on six patients (35.3%). Although SVL varied more than PVL, HIV-1 RNA was detected in all semen samples on both collection points; suggesting, therefore, that these patients shed HIV-1 continuously but at differ-ent viral load levels.
When paired PVL with SVL from each one of the 56 patients were compared, PVL and SVL were significantly different in 32 patients. Among these discordant pa-tients, a higher PVL was more frequent (84.4%) than a higher SVL (15.6%). Since leukocytes were not quanti-fied in semen samples, we were not able to exclude the possibility of enrolled patients having asymptomatic uro-genital infections, which could increase SVL. However, PVL was frequently higher than SVL in patients with dis-cordant viral loads, suggesting that these patients were not harboring asymptomatic urogenital infections. Al-beit, Coombs et al. (1998) reported a weak inverse correla-tion between blood CD4 cell counts and SVL, these find-ings could not be confirmed in our experiments. Recently, Ball et al. (1999) demonstrated that seminal HIV-1 proviral DNA, but not seminal HIV RNA was associated with el-evated semen leukocyte counts.
Data presented here demonstrates for the first time that correlation between PVL and SVL decreases with the depletion of CD4+ T cells, suggesting an important role for CD4 cell counts in the maintenance of this correlation
1 2 3 4 5 6
1 2 3 4 5 6
Sample collection points
PVL1 PVL2
SVL1 SVL2
HI
V
-1 vi
ra
l
lo
a
d
(L
o
g10
co
p
ies/
ml
)
and support the hypothesis of HIV-1 compartmentaliza-tion (Gupta et al. 1997, Coombs et al. 1998, Ball et al. 1999). A larger study aimed at the investigation of a possible correlation between seminal immune components and ei-ther PVL or SVL on paired semen and blood samples is currently been conducted at our laboratory, and may help to better understand the association between immune sta-tus and seminal viral load.
ACKNOWLEDGEMENTS
To Drs Christina Hirsch and Zahra Toossi for their sugges-tions and critical discussions.
REFERENCES
Ball JK, Curran R, Irving WL, Dearden AA 1999. HIV-1 in semen: determination of proviral and viral titres compared to blood, and quantification of semen leukocyte popula-tions. J Med Virol 59: 356-363.
CDC-Centers for Diseases Control and Prevention 1992. 1993 revised classification system for HIV infection and expanded surveillance case definition for AIDS among adolescents and adults. MMWR 41: 1-19.
Coombs RW, Speck CE, Hughes JP, Lee W, Sampoleo R, Ross SO, Dragavon J, Peterson G, Hooton TM, Collier AC, Corey L, Koutsky L, Krieger JN 1998. Association between culturable human immunodeficiency virus type 1 (HIV-1) in semen and HIV-1 RNA levels in semen and blood: evi-dence for compartmentalization of HIV-1 between semen and blood. J Infect Dis 177: 320-330.
Dyer JR, Gillian BL, Eron JJ, Grosso L, Cohen MS, Fiscus SA 1996. Quantitation of human immunodeficiency virus type 1 RNA in cell free seminal plasma: comparison of NASBATM with AmplicorTM reverse transcription-PCR
amplification and correlation with quantitative culture. J Virol Methods 60: 161-170.
Dyer JR, Kazembe P, Vernazza PL, Gilliam BL, Maida M, Zimba D, Hoffman IF, Royce RA, Schock JL, Fiscus SA, Cohen MS, Eron JJ 1998. High levels of human immunodeficency virus type 1 in blood and semen of seropositive men in Sub-Saharan Africa. J Infec Dis 177: 1742-1746.
Fiscus SA, Vernazza PL, Gilliam B, Dyer J, Eron JJ, Cohen MS 1998. Factors associated with changes in HIV shedding in semen. AIDS Res Hum Retroviruses 14: S27-S31. Gupta P, Leroux C, Patterson BK, Kingsley L, Rinaldo C, Ding
M, Chen Y, Kulka K, Buchanan W, McKeon B, Montelaro R 2000. Human immunodeficiency virus type 1 shedding pattern in semen correlates with the compartmentalization of viral Quasi species between blood and semen. J Infect Dis 182: 79-87.
Gupta P, Mellors J, Kingsley L, Riddler S, Singh MK, Schreiber S, Cronin M, Rinaldo CR 1997. High viral load in semen of human immunodeficiency virus type 1-infected men at all stages of disease and its reduction by therapy with pro-tease and nonnucleosyde reverse transcriptase inhibitors. J Virol 71: 6271-6275.
Hamed KA, Winters MA, Holodniy M, Katzenstein DA, Merigan TC 1993. Detection of immunodeficiency virus type 1 in semen: effects of disease stage and nucleoside therapy. J Infect Dis 167: 798-802.
Ho DD, Schooley RT, Rota TR, Kaplan JC, Flynn T, Salahuddin SZ, Gonda MA, Hirsch MS 1984. HTLV-III in the semen and blood of a healthy homosexual man. Science 226: 451-453.
Krieger JN, Coombs RW, Collier AC, Ho DD, Ross SO, Zeh JE, Corey L 1995. Intermittent shedding of human immu-nodeficiency virus in semen: implications for sexual
mission. J Urology 154: 1035-1040.
Levy JA 1993. The transmission of HIV and factors influenc-ing progression to AIDS. Am J Med 95: 86-100.
Liuzzi G, Chirianni A, Clementi M, Bagnarelli P, Valenza A, Cataldo PT, Piazza M 1996. Analysis of HIV-1 load in blood, semen and saliva: evidence for different viral com-partments in a cross-sectional and longitudinal study. AIDS 10: F51-F56.
Miller CJ, Vogel P, Alexander NJ, Sutjipto S, Hendrickx AG, Marx PA 1992. Localization of SIV in the genital tract of chronically infected female rhesus macaques. Am J Pathol 141: 655-660.
Quinn TC, Wawer MJ, Sewankambo N, Serwadda D, Li C, Wabwire-Mangen, F, Meehan MO, Lutalo T, Gray RH 2000. Viral load and heterosexual transmission of human immunodeficiency virus type 1. N Engl J Med 342: 921-929.
Vernazza PL, Eron JJ, Fiscus AS 1996. Sensitive method for the detection of infectious HIV in semen of seropositive individuals. J Virol Methods 56: 33-40.