Angela Carvalho FreitasI
Valdir OkanoII
Júlio Cesar Rodrigues PereiraIII
I Programa de Pós-Graduação em Saúde Pública. Departamento de Epidemiologia. Faculdade de Saúde Pública. Universidade de São Paulo. São Paulo, SP, Brasil II Laboratório de Epidemiologia e Estatística.
Instituto “Dante Pazzanese” de Cardiologia. São Paulo, SP, Brasil
III Departamento de Epidemiologia. Faculdade de Saúde Pública. Universidade de São Paulo. São Paulo, SP, Brasil
Correspondence:
Angela Carvalho Freitas
Serviço de Extensão e Atendimento ao Paciente HIV/aids (SEAP-HIV/AIDS) Hospital da Clínicas da
Universidade de São Paulo R. Frei Caneca, 557 Bela Vista
01307-001 São Paulo, SP, Brasil E-mail: [email protected] Received: 6/8/2010
Approved: 5/11/2011
Article available from: www.scielo.br/rsp
Pertussis booster vaccine for
adolescents and young adults in
São Paulo, Brazil
Avaliação de reforços vacinais contra
a coqueluche para adolescentes e
adultos na cidade de São Paulo
ABSTRACT
OBJECTIVE: To develop a model to assess different strategies of pertussis
booster vaccination in the city of São Paulo.
METHODS: A dynamic stationary age-dependent compartmental model with
waning immunity was developed. The “Who Acquires Infection from Whom” matrix was used to modeling age-dependent transmission rates. There were tested different strategies including vaccine boosters to the current vaccination schedule and three of them were reported: (i) 35% coverage at age 12, or (ii) 70% coverage at age 12, and (iii) 35% coverage at age 12 and 70% coverage at age 20 at the same time.
RESULTS: The strategy (i) achieved a 59% reduction of pertussis occurrence
and a 53% reduction in infants while strategy (ii) produced 76% and 63% reduction and strategy (iii) 62% and 54%, respectively.
CONCLUSION: Pertussis booster vaccination at age 12 proved to be the best
strategy among those tested in this study as it achieves the highest overall reduction and the greatest impact among infants who are more susceptible to pertussis complications.
DESCRIPTORS: Pertussis Vaccine, administration & dosage. Whooping
Whooping cough in infants can be clinically severe and progress to complications or sequelae including death. Immunization is complete after booster vaccination at the age of two and progressively wanes out by the age of six to 12. Pertussis reservoirs are infected people or asymptomatic carriers, either children or adults. Thus, disease may go undiagnosed. While whooping cough is often clinically exuberant in children, it can present as a chronic cough in adults.24 Postels-Multani et al19 reported 30.7% of undiagnosed pertussis infection in adults, of which 8% presented with typical whooping cough.
The Pan American Health Organization (PAHO) estimates that every year 20 to 40 millions people are affected globally.18 Of these, 200 to 400 thousands die of pertussis, 90% in developing countries. These deaths are not evenly distributed by age and the great impact on infants has been long acknowledged. According Hill (1933),13 “...improvement in the death-rates over the last seventy years, though very considerable at all ages under fi ve, was least in infancy and most at ages over two years”. Pertussis is primarily controlled through vaccination. Mass immunization began in the 1950s when the diphtheria-tetanus-pertussis (DTP) vaccine
RESUMO
OBJETIVO: Desenvolver um modelo capaz de acessar resultados de diferentes
possíveis estratégias de reforço vacinal contra a coqueluche, na cidade de São Paulo.
MÉTODOS: O modelo matemático dinâmico proposto é dependente da idade
e considerou perda da imunidade vacinal com o avanço da idade. A matriz
“who acquire infection from whom” foi utilizada para inserir as diferentes
dinâmicas de contatos entre os grupos etários. Diferentes estratégias vacinais foram testadas, acrescentando reforços vacinais ao atual esquema utilizado, e três diferentes estratégias foram reportadas: (i) 35% ou (ii) 70% de cobertura vacinal na idade de 12 anos e (iii) coberturas vacinais de 35% aos 12 anos e 70% aos 20 anos ao mesmo tempo.
RESULTADOS: A estratégia (i) produziu redução de 59% nos casos de coqueluche e 53% de redução entre os menores de um ano; a estratégia (ii) alcançou redução de 76% nos casos e de 63% entre os menores de um ano; a estratégia (iii) reduziu em 62% o total de casos e 54% entre os menores de um ano.
DISCUSSÃO: Reforço vacinal contra a coqueluche aos 12 anos é a melhor
estratégia dentre as testadas, pois gera maior redução de casos em todas as idades e alcança maior impacto entre os menores de um ano, os mais vulneráveis às complicações da coqueluche.
DESCRITORES: Vacina contra Coqueluche, administração & dosagem.
Coqueluche, prevenção & controle. Cobertura Vacinal. Modelos Matemáticos.
INTRODUCTION
a Shimizu SMM, Espindola LCF. Adolescent hepatites B vaccine coverage at São Paulo City:2001 to 2005 [essay]. São Paulo: Faculdade de Saúde Pública da Universidade de São Paulo; 2006.
was implemented in different countries leading to a reduction greater than 90% in disease incidence and mortality.24 A regular pertussis vaccination program was introduced in Brazil in the 1970s. The vaccine schedule consists of three doses for infants and boosters at 15 to 18 months and fi ve to six years of age. There has been reported coverage greater than 90% for infants and booster vaccine coverage estimated at 82% and 89% for 15-18 month-olds and 5-6 year-olds, respectively, in the last decades in Brazil.a
Although effective for disease prevention, pertussis vaccination does not prevent bacteria circulation even when coverage is high.24 In the last ten to 20 years, despite adequate vaccination coverage, many countries reported disease outbreaks with increasing incidence among adolescents and adults,11,17,24 which in turn increases the risk of infection in infants.11,23,24
b Ministério da Saúde. DATASUS. Série histórica de casos de óbitos de doenças de notifi cação compulsória – Brasil. 1980 a 2005 [cited 2007 Jan 2]. Available from: http://portal.saude.gov.br/portal/arquivos/pdf/planilhas_dnc_casos_e_obitos_todas_2006.pdf
c Secretaria de Estado da Saúde de São Paulo, Centro de Vigilância Epidemiológica “Prof. Alexandre Vranjac”. Coqueluche: distribuição de casos confi rmados, óbitos, coefi ciente de incidência e letalidade, segundo ano de início de sintomas e faixa etária, Estado de São Paulo, 2000 a 2011 [cited 2008 Apr 20]. Available from: http://www.cve.saude.sp.gov.br/htm/resp/coque_tab.htm
on genetic changes conducted in Japan, Canada, US and several European countries have suggested that though these changes are detected they cannot explain the increase in whooping cough rates.4,10,11
The annual incidence rate of whooping cough in Brazil was 30 x 10-5 in 1980. Since the introduction of regular children vaccination, this rate steeply declined to 1 x 10⁻⁵ and less than 2,000 cases are reported each year since 1996.b In the state of São Paulo, southeastern Brazil, the annual incidence rate by age from 2000 to 2007 showed that infants are the most affected.c The incidence rate in 2002 was 7.43 x 10⁻⁵ and an increasing number of cases are reported every year, reaching 16.6 x 10⁻⁵ in 2005 when an outbreak was detected. Children aged one to four years are the second most affected group with rates ranging from 0.2 to 0.3 x 10⁻⁵ in recent years. The rates in other age groups mainly reported in 2001, 2005 and 2007 were not as high. This is in agree-ment with a known cyclic behavior of pertussis disease which could produce peaks every three to four years even when there is high vaccine coverage.7
Current surveillance data in Brazil do not show a signifi cant rise in pertussis incidence rates. However, these data are not reliable since several clinical forms of pertussis are not easily diagnosed, and because pertussis incidence is passively reported in Brazil. Luz et al17 modeling of pertussis epidemic in Rio de Janeiro, south-eastern Brazil, showed a 31% increase in pertussis cases by the year 2020 assuming that the current pertussis vaccination schedule in Brazil remains unchanged.
This study aimed to develop a model to assess different strategies of pertussis booster vaccination.
METHODS
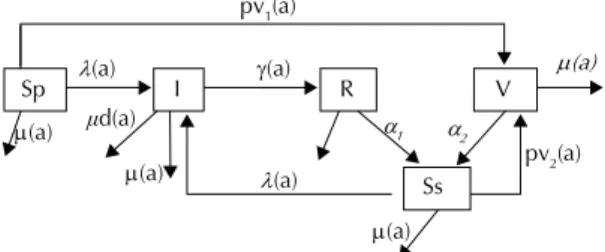
A model was proposed and constructed based on the classical susceptible-infected-removed (SIR) disease model.1 This is a dynamic stationary age-dependent compartmental model with waning immunity after disease or vaccine designed to assess whooping cough dynamics across age groups in different scenarios of pertussis booster vaccination at ages 12 and 20 in the city of São Paulo. Disease behavior was assumed steady over time, i.e., frequency distribution of subsets within compartments do not change over time. The model (Figure 1), described by a system of differential equa-tions, was designed with fi ve compartments, each one with subsets of the age groups studied. The assumption of steady epidemiological profi le was not preposterous since a narrow time period was considered and a few decades would be required to assess changes over time.
The following differential equations describe the dynamics suggested in Figure 1:
where was the transmission
rate (i) for a given age group a = i from all j age groups according to j’s contact rate ( ij) and j’s infected compart-ment (I). Seven different values (a = 1, 2, …7) of age groups were used according to the categories as defi ned in the Brazilian health database (DATASUS) (<1 year; 1 to 4; 5 to 9; 10 to 14; 15 to 19; 20 to 39; 40 or more). This is a realistic approach that can provide information where age is a discrete variable, though higher accuracy was sought through calculation of monthly rates.
The compartments were: primary susceptible (Sp) (indi-viduals with no previous exposure to either pertussis bacteria or vaccine, given the mean live birth rate in the city of São Paulo in the last fi ve years); infected (I) (individuals infected with Bordetella pertussis who became ill and infective; the estimated whooping cough incidence rates, adjusted to ages groups, in the city of São Paulo); vaccinated (V) (vaccinated individuals
Sp I R V
Ss pv1(a)
pv2(a) (a)
(a)
1 2
ȝd(a) (a)
(a)
(a)
(a)
(a)
Figure 1. Whooping cough age-dependent compartmental
model.
Sp: primary susceptible; Ss: secondary susceptible; I: infected;
R:recovered from disease and immune; V: immune after
vaccine; (a): age-dependent transmission rate; (a):
age-dependent recovery rate; α1 and α2: rates of waning immunity;
pv1(a) and pv2(a): age-dependent immunization rates; (a):
age-dependent mortality rate; d(a): age-dependent pertussis
within an estimated eight-year window of protection); recovered (R) (individuals who recovered from disease within an estimated 12–year window of protection); secondary susceptible (Ss) (individuals who became susceptible after being immune by either disease or vaccine).
Transmission rate or force of infection, ( (a)) defi ned for each age group, ascertained the speed at which cases of disease were brought into this group from all age groups included in the susceptible compartments (Sp & Ss) according to effective contact rates ( ij) and number of infected people (Ij).
( (a)): <1 year = 33.5 x 10⁻⁵; one to four years = 0.94 x 10⁻⁵; fi ve to nine years = 2.43 x 10⁻⁵; ten to 14 years = 2.62 x 10⁻⁵; 15 to 19 years = 3.77 x 10⁻⁵; 20 to 39 years = 0.59 x 10⁻⁵; and >40 years = 0.32 x 10⁻⁵.
It was thus designed to take into consideration differ-ences by age but not the nature of susceptibility (primary or secondary). One could wonder whether incidence rates in primary susceptible could be greater than in secondary susceptible individuals. Nevertheless, given the high coverage of DTP vaccine in children in São Paulo, primary susceptible indi-viduals were mainly restricted to infants who have not achieved proper age for vaccination, and secondary susceptible ones were older individuals with incidence rate differences adjusted for age.
As there was no appropriate data on incidence rate available in São Paulo, the estimates for the infected compartment according to age group (Ij) was based on data from the city of Ribeirão Preto, southeastern Brazil. Ribeirão Preto is a large city in the state of São Paulo with similar patterns of social exposures, and had an active epidemiological surveillance system for whooping cough. Cases were those with clinically suspected pertussis, confi rmed through oropharyngeal swab culture or by evidence of exposure to previously confi rmed case.
Crude incidence rates were calculated at a monthly basis and standardized by the reference age group of less than one year in 2005. Data for the last available six years were processed and mean ages were estimated
as the initial transmission rate, or force of infection ( (a)) using Berkeley Madonna® software. A numerical solution taking into account the age groups of São Paulo population ascertained the number of infected individuals by age group (Ij) .
The contact rate ( ij) estimated the probability that an individual gets infected through this exposure. Anderson & May2 Who Acquires Infection from Whom (WAIFW) matrix was used to assess the impact of exposure on each age group (Figure 2). Suggestions for effective exposure rates ( ij) were taken from a study conducted by Baptista et al.3 This study assessed vaccine effi cacy and sources of infection in infants providing patterns of exposure across age groups.
Determinant calculus was used to estimate contact rate
ij by means of equation 6. Both vectors ( )and Ij had
seven components related to seven age groups. Ij was
calculated by the equation 2 using the force of infection
i= ( (a)) and assuming no new vaccine introduction.
The recovery rate
assessed the rate of moving from the Infected (I) to the Immune compartment after disease (R) regardless of clinical status (active and inactive disease). It was calculated as the inverse of the mean time an individual is supposedly infective after being infected. The refer-ence values were taken from Edwards & Decker.7 Simulations showed that few children reached the age of 10 without being exposed to either vaccine or disease, and that few cases of disease among these came from the secondary susceptible compartment. The recovery rate was assessed on a monthly basis (<10 years = 1.71 and ≥10 years = 3.53).
The rate at which immunity wanes
ascertained speed of migration from the compartments of immune individuals (R and V) to that of secondary susceptible (Ss) on a monthly basis [after disease (α1) = 1/144 months (12 years) = 0.0069 and after vaccine (α2) = 1/96 months (8 years) = 0.0104]. The assumption of the ages eight and 12 was based on a recent literature
9 9 9 9 9 8 9 9 9 9 9 9 8 9 9 9 8 8 8 8 8 9 9 8 8 8 8 8 9 9 8 8 8 8 8 9 9 8 8 8 8 8 9 9 8 8 8 8 7 10 * 9 . 2 10 * 9 . 2 10 * 9 . 2 10 * 9 . 2 10 * 9 . 2 10 * 1 . 1 10 * 9 . 2 10 * 9 . 2 10 * 25 . 6 10 * 25 . 6 10 * 25 . 6 10 * 25 . 6 10 * 1 . 1 10 * 25 . 6 10 * 9 . 2 10 * 25 . 6 10 * 93 . 4 10 * 93 . 4 10 * 93 . 4 10 * 1 . 1 10 * 93 . 4 10 * 9 . 2 10 * 25 . 6 10 * 93 . 4 10 * 17 . 8 10 * 73 . 5 10 * 1 . 1 10 * 1 . 1 10 * 9 . 2 10 * 25 . 6 10 * 93 . 4 10 * 73 . 5 10 * 73 . 5 10 * 1 . 1 10 * 1 . 1 10 * 9 . 2 10 * 25 . 6 10 * 1 . 1 10 * 1 . 1 10 * 1 . 1 10 * 1 . 1 10 * 1 . 1 10 * 9 . 2 10 * 25 . 6 10 * 93 . 4 10 * 1 . 1 10 * 1 . 1 10 * 1 . 1 10 * 15 . 8 7 7 7 7 7 2 7 7 6 6 6 6 2 6 7 6 5 5 5 2 5 7 6 5 4 3 2 2 7 6 5 3 3 2 2 7 6 2 2 2 2 2 7 6 5 2 2 2 1
Figure 2. The Who Acquires Infection From Whom (WAIFW) matrix showing the estimated effective contact rates ( ij) across
review study by De Carvalho & Pereira.4
The age-dependent mortality rate( (a)) assessed the rate at which individuals exited the system due to death regardless of its causes. It was estimated as mean monthly mortality rate in the age groups in São Paulo from 2000 to 2004 (<1 year = 13.3 x 10⁻⁴; one to four years = 0.5 x 10⁻⁴; fi ve to 14 years = 0.2 x 10⁻⁴; 15 to 39 years = 1.7 x 10⁻⁴; 40 to 49 years = 3.8 x 10⁻⁴; 50 to 59 = 7.9 x 10⁻⁴; and >60 years = 26 x 10-4).
The age-dependent pertussis mortality rate( d(a)) deter-mined disease fatality on a monthly basis. São Paulo health authorities reporteda a yearly fatality rate of 17.5 10–3 among infants and no deaths in any other age group. Thus, monthly age-dependent pertussis mortality rate was applied only to infants as d(infants) = 0.1510–3.
The age-dependent immunization rates (pv1 (a) & pv2 (a)) assessed the effect of vaccination according to age, vaccine coverage, and effi cacy. They refl ected how fast individuals from primary susceptible and secondary susceptible compartments moved to the vaccinated compartment. It was assumed an 80% vaccine effi -cacy.7,22 The rate pv
1(a) described the transition from compartment Sp (primary susceptible) to V (vaccinated) in the ages two to six months. The rate pv2(a) described the transition from compartment Ss (secondary suscep-tible) to V (vaccinated) in the ages 15 to 18 months (fi rst booster) and four to six years (second booster) in the current vaccination schedule. When new booster vaccinations were introduced for adolescents, pv2(a) described these transitions at these ages.
The pv1 and pv2 values were drawn from the numeric calculus obtained from each iteration step during inte-gration of differential equations. It provided the right number of individuals moving from the susceptible to the vaccinated compartment based on vaccine effi cacy and coverage for each age group vaccinated. Coverage rates were conservatively set at 35% based on data from the current hepatitis B vaccine coverage in adolescents in the city of São Paulo, and a more vigorous scenario was considered by doubling this fi gure (70%).
Basic reproduction ratio by age group (R0,i) was assessed using the equation provided by Anderson & May.2 This calculus showed which age group was responsible for disease dissemination.
, where
(i) = recovery rate in the ith age group;
N(i) = = population in the ith age group;
(i,a) = is the matrix ijreferred above.
Data was retrieved from public databases (DATASUS,
Ministry of Health) and databases at the state level (Epidemiological Surveillance System, São Paulo State Health Department). General data on disease behavior including infection and immunity duration were obtained from the literature.
Different intervention strategies were tested with the use of the Berkeley Madonna® (integration of differ-ential equations) and Microsoft Excel® (impact of new dose vaccine on all age groups) in successive iterations (Appendix 1 and Appendix 2). The scenarios tested were based on the current vaccination schedule in Brazil (National Immunization Program): DTP at two, four, and six months; DTP booster at 15 to 18 months; DTP booster at four to six years of age. Boosters at 12 and/or 20 years were examined according to different coverage rates.
Effective vaccination by age group (vaccine coverage plus vaccine effi cacy) was applied to susceptible (Sp, Ss) individuals to provide the number of immunized (V) using the Madonna function “squarepulse,” an adapted Dirac delta function. The effects on the age groups were assessed in Excel using the WAIFW matrix (Appendix 1). This second step corrected Madonna output that does not evaluate the effect on age groups younger than those at which booster vaccination is introduced.
A second Appendix was added to describe step 5 in the Appendix 1 concerning adjustment of the infected compartment. It describes the procedures for correcting the number of infected individuals which could be overlooked otherwise. We were not able to estimate the baseline number of infected (expected number in a non-vaccinated population) because the population was being actively vaccinated. The initial ijmatrix was
tainted by existing immunization and, correction was needed to avoid overestimating the effect of vaccine introduction (repeat vaccination).
The model was validated by correctly simulating the average of the last six years pertussis incidence rate by age group Ribeirão Preto before running the model with São Paulo data.
Changes in parameters were tested (sensitivity analysis):
Crude incidence rate: tested against the standardized (a) aspreviously described;
Recovery rate without controlling for age: calculated as a single = 1,71 tested against stratifi ed recovery rate as previously described;
Age-dependent pertussis mortality rate reduced to d = 0.10 × 10⁻³ tested against the original d = 0.15 × 10⁻³.
described. If any alternative were to be tested, it should have a more solid ground that the one considered and, thus, rather than taken for sensitivity analysis should replace the initial choice at once.
RESULTS
After testing of different scenarios of vaccine coverage and ages for booster vaccination, the results converged to three solutions summarized trends. Table 1 shows the basic reproduction ratio (R0) and expected whooping cough reduction by age group.
Young adult vaccine booster did not seem to add a signifi cant impact to adolescent booster even with a high coverage at this age. A single adolescent booster may provide substantial reduction of overall pertussis occurrence and can particularly contribute with disease reduction among infants. The basic reproduction ratio (R0) suggests that for a non-immunized population individuals aged less than one year and fi ve to nine years would likely spread the disease. Since they are already targeted in the current vaccination schedule, it would be reasonable to consider that disease spread could move forward to the next age group. This is consistent with the fi nding that booster vaccination at the age of 12 provides the best results.
Based on the previously defi ned conditions for sensi-tivity analysis, if crude incidence rates were used, booster vaccination of 12-year-olds would require 90% coverage to achieve a reduction that would mostly be seen among adolescents. Among infants, it would have an impact lower than 10%. A 95% of coverage would be required for a booster vaccination of 12-years-old to achieve a 20% reduction among infants. If a booster vaccination of 20–years-old were added, the impact among infants would be no more than 27% reduction (Table). This suggests that the model was sensitive to changes in incidence rate estimates. The standardization
of raw data was an important adjustment procedure that is required when dealing with incomplete or scarce raw data. The model was not sensitive to changes in recovery rate and fatality rate.
DISCUSSION
The proposed model is an effi cient tool for evaluating the introduction of booster vaccination when there is little information available. Resorting to the available data and current knowledge, and using procedures of standardization and stratifi cation some nontrivial conclusions were achieved. The intuitive idea that adult vaccination should improve disease control was found to be of little importance while booster vaccination of adolescents can provide important results when there is good coverage. Forsyth9 pointed out that though high coverage of adult vaccination can reduce adult cases high compliance with this initiative is not expected since public awareness about the disease is low. Apart from its feasibility, adult vaccination is expensive and may not be cost-effective as suggested by Lee et al.16 They tested different strategies assessing cost per case prevented and cost per quality-adjusted life years saved by means of a Markov model and concluded that adolescent vaccination seemed preferable.
Van Rie & Hethcote21 and Coudeville et al5 studies on adolescent booster vaccination suggested that a reduc-tion would be expected in those younger than 20 and those older than 40 but at the expense of an increase among individuals aged 20 to 40, which would recom-mend a young adult booster vaccination. This contrasts with our results but these authors used much lower infant transmission rates than those studied here. In addition, the age groups were different: transmission rates in those one to 18 were twice as high as that in those less than one year, making it a tabula rasa of immunity waning over one to 18 years of age. Van
Table. The basic reproduction ratio (R0) by age group and expected whooping cough reduction (%) by age group, and standardized
or crude incidences rates in the city of São Paulo after the introduction of booster vaccination at given ages and coverage.São
Paulo, Southeastern Brazil, 2007.
Standardized incidence rate Crude incidence rate
Age group
(years) R0
Vaccine coverage
35% in 12–year-olds (%)
70% in 12-year-olds (%)
35% in 12-year-olds 70% in 20-year-olds
(%)
90% in 12-year-olds (%)
95% in 12–year-olds (%)
95% in 12-year-olds 90% in 20–year-olds
(%)
<1 1.75 53 66 54 9 20 27
1 to 4 0.50 56 78 67 29 29 43
5 to 9 1.31 67 78 63 31 46 46
10 to 14 0.71 68 82 71 62 69 69
15 to 19 0.61 66 80 66 48 57 61
20 to 39 0.20 61 75 69 28 39 57
>40 0.13 56 76 64 17 25 42
Boven et al20 emphasized the importance of taking into consideration waning immunity when investigating the causes of the 1996–1997 pertussis epidemics in the Netherlands. They constructed a time-and age-depen-dent dynamic model and found that an increased rate of waning immunity was a major factor associated with the outbreak probably due to some pathogen change. The same emphasis on waning immunity and pathogen changes was recently given in a study of pertussis epidemiological profi le in Poland and Argentina.12,14
Van Rie & Hethcote21 study showed that concomitant adolescent and young adult booster vaccination seem to signifi cantly reduce pertussis rates in all age groups including infants. Nevertheless, similar to Coudeville et al5 results, no evidence of any important contribution of an added young adult vaccination was shown over single vaccination of adolescents. This is relevant in the case of São Paulo, not only from a cost perspective but also concerning compliance since the current adult diphtheria and tetanus (dT) vaccine booster coverage is lower than 10%.d Assuring adequate immunization coverage of adults would be a even greater challenge than that of adolescents. Both these studies considered alternative schedules as “cocoon strategy” or regular boosters at fi xed times which were not examined in the current study.
Edwards & Halasa8 acknowledged the increase in pertussis incidence and suggested that each country
should have a tailored monitoring system and develop the most effective strategy based on their own data. Although mathematical modeling is a well-established epidemiological tool since Kermack & McKendrick15 seminal paper in 1927, there are few pertussis modeling experiences in the literature, they are all limited because a unclear association of many factors in pertussis epide-miology, and they are all hardly comparable, as recently pointed out by Crowcroft & Pebody.6 Tackling pertussis demands local efforts for understanding disease behavior. The Global Pertussis Initiative10 emphasizes that research and discussion should focus on “preventing infant morbidity and mortality from pertussis and tailoring strategies to fi t the needs of each country”.
As in any study based on the axiomatic method, infer-ence is limited by the model’s premises. An adolescent booster vaccination should be considered under the light of each and every item of methodological defi ni-tion discussed in the methods. They were built upon the best available information, but were any of them (e.g., stationary model, borrowed transmission rates, or else) to be disputed and different conclusions could be achieved.
ACKNOWLEDGEMENTS
To professors Eduardo Massad and Pedro A Tonelli of Universidade de São Paulo for their suggestions during the modeling process.
1. Anderson RM, May RM. Infectious diseases of humans: dynamics and control. Oxford: New York: University Press; 1992. p.87-143. (Oxford Science Publications).
2. Anderson RM, May RM. Infectious diseases of humans: dynamics and control. Oxford: New York: Oxford University Press; 1992. p.172-207. (Oxford Science Publications).
3. Baptista PN, Magalhães V, Rodrigues LC, Rocha MW, Pimentel AM. Pertussis vaccine effectiveness in reducing clinical disease, transmissibility and proportion of cases with a positive culture after household exposure
in Brazil. Pediatr Infect Dis J. 2006;25(9):844-6.
DOI:10.1097/01.inf.0000232642.25495.95
4. Carvalho AP, Pereira EMC. Acellular pertussis
vaccines for adolescents. J Pediatr (Rio J).
2006;82(3 Suppl):S15-24. DOI:10.1590/S0021-75572006000400003
5. Coudeville L, van Rie A, Andre P. Adult pertussis vaccination strategies and their impact on pertussis in the United States: evaluation of routine and targeted
(cocoon) strategies. Epidemiol Infect.
2008;136(5):604-20. DOI:10.1017/S0950268807009041
6. Crowcroft NS, Pebody RG. Recent developments
in pertussis. Lancet. 2006;367(9526):1926-36.
DOI:10.1016/S0140-6736(06)68848-X
7. Edwards KM, Decker MD. Pertussis vaccine. In: Plotkin SA, Orestein WA, editors. Vaccines. 4.ed. Philadelphia: Saunders; 2004. p.471-528.
8. Edwards KM, Halasa NB. Commentary: is pertussis
disease increasing? Int J Epidemiol. 2004;33(2):365-6.
DOI:10.1093/ije/dyh066
9. Forsyth K. Pertussis, still a formidable foe. Clin Infect
Dis. 2007;45(11):1487-91. DOI:10.1086/522660
10. Forsyth KD, Wirsing von König CH, Tan T, Caro J, Plotkin S. Prevention of pertussis: recommendations derived from the second Global Pertussis Initiative
roundtable meeting. Vaccine. 2007;25(14):2634-42.
DOI:10.1016/j.vaccine.2006.12.017
11. Guris D, Strebel PM, Bardenheier B, Brennan M, Tachdjian R, Finch E, et al. Changing epidemiology of pertussis in the United States: increasing reported incidence among adolescents and adults,
1990-1996. Clin Infect Dis. 1999;28(6):1230-7.
DOI:10.1086/514776
12. Gzyl A, Augustynowicz E, Rabczenko D, Gniadek
G, Slusarczyk J. Pertussis in Poland. Int J Epidemiol.
2004;33(2):358-65. DOI:10.1093/ije/dyh012
13. Hill AB. Some aspects of the mortality from
Whooping-Cough. J R Stat Soc. 1933;96(2):240-85.
14. Hozbor D, Mooi F, Flores D, Weltman G, Bottero D, Fossatti S, et al. Pertussis epidemiology in Argentina:
trends over 2004-2007. J Infect. 2009;59(4):225-31.
DOI:10.1016/j.jinf.2009.07.014
15. Kermack WO, McKendrick AG. Contributions to the
mathematical theory of epidemics. Proc R Soc Lond A
Math Phys Sci. 1927;115(772):700-21.
16. Lee GM, Lebaron C, Murphy TV, Lett S, Schauer S, Lieu TA. Pertussis in adolescents and adults: should
we vaccinate? Pediatrics. 2005;115(6):1675-84.
DOI:10.1542/peds.2004-2509
17. Luz P, Codeço CT, Werneck GL, Struchiner CJ. A modelling analysis of pertussis transmission and
vaccination in Rio de Janeiro, Brazil. Epidemiol
Infect. 2006;134(4):850-62. DOI:10.1017/ S095026880500539X
18. Pan American Health Organization. Control of
diphtheria, tetanus, pertussis, Haemophilus infl uenzae
type b, and hepatitis B: fi eld guide. Washington (DC); 2005. (PAHO-Scientifi c and Technical Publication, 604).
19. Postels-Multani S, Schmitt HJ, Wirsing von König CH, Bock HL, Bogaerts H. Symptoms and complications of
pertussis in adults. Infection. 1995;23(3):139-42.
20. van Boven M, de Melker HE, Schellekens JF, Kretzschmar M. Waning immunity and sub-clinical infection in an epidemic model: implications
for pertussis in The Netherlands. Math Biosci.
2000;16(2):161-82. DOI:10.1016/S0025-5564(00)00009-2
21. Van Rie A, Hethcote HW. Adolescent and adult pertussis vaccination: computer simulations of fi ve
new strategies. Vaccine. 2004;22(23-24):3154-65.
DOI:10.1016/j.vaccine.2004.01.067
22. Ward JI, Cherry JD, Chang SJ, Partridge S, Lee H, Treanor J, et al. Effi cacy of an acellular pertussis
vaccine among adolescent and adults. N Engl J Med.
2005;353(15):1555-63. DOI:10.1056/NEJMoa050824
23. Wharton M. Prevention of pertussis among adolescents by vaccination: taking action on what we know and
acknowledging what we do not know. Clin Infect Dis.
2004;39(1):29-30. DOI:10.1086/421096
24. World Health Organization. Pertussis vaccine: WHO
position paper. Wkly Epidemiol Rec. 2005;80(4):31-9.
REFERENCES
Freitas AC was supported by Centro de Vigilância Epidemiológica da Secretaria de Estado da Saúde de São Paulo (EPISUS/ CVE/SES/São Paulo).
Study partially supported by the International Society for Infectious Diseases Small Grant Program Award, 2007.
At the software Madonna, calculate the new n° of infected
per age group with the current vaccines doses.
At the Madonna, calculate the new n° of infected per age group, adding the new
booster(s)
Repeat steps 4, 5 and 6 in successive iterations until the convergence of the
values
Multiply lj** by the
corresponding adjusting factor (af) At the Excel®: I
j*xȕij = Ȝi*
At the Excel®: I
ja**xȕij = Ȝi**
At Excel reduce estimated lj at the
age group(s) at which booster(s) is introduced, according to pv1 and pv2
Step 1
Step 3
Step 4
Step 6
Back to Step 5
Back to Step 6 Back to Step 4
Step 5 Step 2 lj
lj*
lj**
lja**
lj** 1
,lj** 2
...lj** n
lja*** 1
,lja*** 2
...lja*** n
Ȝi*
Ȝi
Ȝi**...Ȝi***
n
Appendix 1. Steps for the estimation of force of infection (i)and number of infected people (Ij) after the introduction of booster
vaccination in adolescents and young adults.
i: age-dependent transmission rate, Ij: number of infected by age group, Ija: adjusted number of infected by age group, ij:
Step 1 WAIFW matrix
calculus
Ij values for São Paulo
city without any pertussis vaccine
Calculus of the Ij values for São Paulo city with current vaccine doses at 2, 4, 6, 15 and 60 months
of age (Madonna®)
Step 2 – appendix 1 Without booster
introduction Estimated
current Ij for São Paulo
city
Step 4 appendix 1 Without booster
introduction
Since the correct Ij** must be = Ij,
we define: Ij = Ij** x af = Ija
Ij** < Ij
Ij* = Ij
Step 2 Accounting for current vaccine
schedule
ȜiȜi
as ȕij came
from no vaccination
Step 3
Ȝi* yields
paradoxical
Ij**
At the Excel®: I
j* x ȕij = Ȝi*
Step 1 – appendix 1
Step 3 – appendix 1
Step 5 – appendix 1
Ȝi
Ȝi
Ȝi*
ȕij
i: age-dependent transmission rate, Ij: number of infected by age group, Ija: adjusted number of infected by age group, ij:
WAIFW matrix, af: adjusting factor, * (uppercase asterisk) means updated parameter.
Appendix 2. Adjusting factor (af): adjustment of compartment I to provide adequate i. This shows why step 5 is required in