Cop
yright
© ABE&M t
odos os dir
eit
os r
eser
vados
.
Cop
yright
© ABE&M t
odos os dir
eit
os r
eser
vados
.
Trabecular bone score:
perspectives of an imaging
technology coming of age
Escore de osso trabecular: perspectivas de um método de imagem em aprimoramento
Barbara C. Silva1, John P. Bilezikian2
ABSTRACT
The trabecular bone score (TBS) is a new method to describe skeletal microarchitecture from the dual energy X-ray absorptiometry (DXA) image of the lumbar spine. While TBS is not a di-rect physical measurement of trabecular microarchitecture, it correlates with micro-computed tomography (µCT) measures of bone volume fraction, connectivity density, trabecular number, and trabecular separation, and with vertebral mechanical behavior in ex vivo studies. In human subjects, TBS has been shown to be associated with trabecular microarchitecture and bone strength by high resolution peripheral quantitative computed tomography (HRpQCT). Cross--sectional and prospective studies, involving a large number of subjects, have both shown that TBS is associated with vertebral, femoral neck, and other types of osteoporotic fractures in postmenopausal women. Data in men, while much less extensive, show similar indings. TBS is also associated with fragility fractures in subjects with secondary causes of osteoporosis, and preliminary data suggest that TBS might improve fracture prediction when incorporated in the fracture risk assessment system known as FRAX. In this article, we review recent advances that have helped to establish this new imaging technology. Arq Bras Endocrinol Metab. 2014;58(5):493-503
Keywords
Trabecular bone score; osteoporosis; fracture risk; bone mineral density; microarchitecture
RESUMO
TBS (do inglês, “trabecular bone score”) é um novo método que estima a microarquitetura
óssea a partir de uma imagem de densitometria óssea (DXA) da coluna lombar. Apesar de o TBS não ser uma medida física direta da microarquitetura trabecular, ele correlaciona-se com o volume ósseo, densidade da conectividade trabecular, número de trabéculas e separação trabecular medidos por microtomograia computadorizada (µCT), e com medidas mecânicas da resistência óssea vertebral em estudos ex vivo. Estudos em humanos conirmaram que o
TBS associa-se a microarquitetura trabecular e resistência óssea medidas por tomograia com-putadorizada quantitativa periférica de alta resolução (HRpQCT). Estudos transversais e pros-pectivos, envolvendo um grande número de indivíduos, mostraram que o TBS é associado com fratura vertebral, de colo de fêmur e com outros tipos de fraturas osteoporóticas em mulheres na pós-menopausa. Dados em homens, apesar de escassos, mostram resultados semelhantes. Além disso, o TBS foi associado a fraturas por fragilidade em indivíduos com diversas causas secundárias de osteoporose e, dados preliminares, sugerem que o uso do TBS pode melhorar a previsão de fratura quando incorporado ao sistema de avaliação de risco de fratura (FRAX). Este artigo faz uma revisão de avanços recentes que têm ajudado a estabelecer esse novo mé-todo de imagem. Arq Bras Endocrinol Metab. 2014;58(5):493-503
Descritores
TBS; osteoporose; risco de fratura; densidade mineral óssea; microarquitetura
1 Medical School, Federal University of Minas Gerais (UFMG), Belo Horizonte, MG, Brazil 2 Metabolic Bone Diseases Unit, Division of Endocrinology, Department of Medicine, College of Physicians and Surgeons, Columbia University, New York, NY, United States
Correspondence to:
John P. Bilezikian Department of Medicine, College of Physicians and Surgeons 630 W. 168th Street, New York, NY
10032
[email protected] Received on May/12/2014 Accepted on May/22/2014
Cop
yright
© ABE&M t
odos os dir
eit
os r
eser
vados
.
INTRODUCTION
O
steoporosis is deined as a skeletal disorder char-acterized by compromised bone strength, pre-disposing to an increased risk of fracture (1). The major determinants of bone strength are both bone mineral density (BMD) and skeletal microarchitecture. While BMD can be readily measured by dual-energy X-ray absorptiometry (DXA), the technologies used to de-termine skeletal microarchitecture, such as histomor-phometric analysis and micro-computed tomography (µCT) of the transiliac crest bone biopsy (2,3), high resolution peripheral quantitative computed tomogra-phy (HRpQCT) (4), and magnetic resonance imaging (MRI) (5) are not routinely available. To this end, and based upon previous studies using 2D X-ray images to estimate bone microstructure (6-8), the trabecular bone score (TBS), a new approach for assessing skeletal microarchitecture from 2D DXA images (9-11), has been developed.TBS is an indirect index of trabecular microarchitec-ture based upon evaluating pixel gray-level variations in the DXA image. TBS is not a direct physical mea-surement of trabecular microarchitecture, but rather an overall descriptor of bone quality (9). A low TBS value is associated with fewer, less well-connected and more widely distributed trabeculae, while high TBS va lues are correlated with better trabecular structure (11). TBS can be readily applied to a DXA image through the use of a speciic software, and has an attractive fea-ture which is the possibility of being retrospectively cal-culated from an existing DXA image without the need for further imaging (12).
TRABECULAR BONE SCORE: TECHNICAL ASPECTS
TBS takes into account the pixel gray-level variations in the DXA image. The basic principles of TBS include the following points: a 2D projection image of a po-rous trabecular structure has a low number of pixel value variations of high amplitude, whereas the projec-tion of a well-structured trabecular bone onto a plane produces an image with a large number of pixel value variations of small amplitude (9). TBS is derived from an experimental variogram of those projected images, calculated as the sum of the squared gray-level differ-ences between pixels at a speciic distance and angle. TBS is then calculated as the slope of the log-log trans-form of the 2D variogram. A low TBS value is
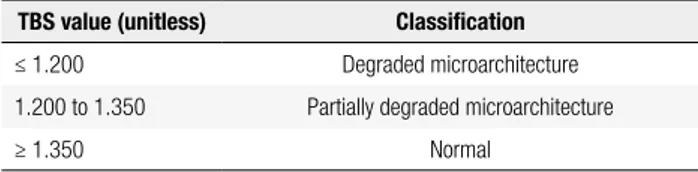
associ-ated with worse bone structure, while high TBS values are correlated with better bone structure (11). Table 1 shows the TBS cutoff points in postmenopausal women as suggested by expert opinion (13). Equivalent ranges for TBS in men have not yet been proposed.
Table 1. TBS cutoff points in postmenopausal women proposed by an international working group of TBS users (13)
TBS value (unitless) Classiication
≤ 1.200 Degraded microarchitecture
1.200 to 1.350 Partially degraded microarchitecture
≥ 1.350 Normal
TBS: trabecular bone score.
TBS, typically measured at the lumbar spine (LS), has a short-term in vivo precision of 1.12% - 2.1% (14-17). The TBS result is given for each vertebra and for the overall lumbar spine, as is done for the calcula-tion of BMD. Fractured vertebrae are excluded from the TBS calculation. While a previous study has sug-gested that osteoarthritic changes of the LS have little effect on TBS (14), vertebrae with overt osteoarthritic changes are also excluded from the TBS analysis.
Several technical limitations of TBS analyses should be noted. As TBS is computed from DXA images, any image “noise” can inluence the TBS evaluation. Ad-ditionally, TBS results may not be comparable across different densitometers, unless a TBS cross-calibration process utilizing a gray-level TBS phantom is utilized. Finally, excessive soft tissue in the abdomen, overlying the region of interest, may reduce the TBS estimate. In order to mitigate this problem in vivo, the TBS calcula-tion is adjusted for body mass index (BMI). The use of BMI, however, is limited since it can not distinguish central abdominal weight accumulation, which would inluence TBS derived from LS DXA, from adiposity at other sites. Of note, the adjustment in TBS for BMI is optimized when BMI is between 15 and 35 kg/m².
ASSOCIATION OF TBS WITH 3D MEASUREMENTS
OF TRABECULAR MICROSTRUCTURE AND BONE
STRENGTH
Cop
yright
© ABE&M t
odos os dir
eit
os r
eser
vados
.
(10,11), and trabecular number (Tb.N) (10,11), and inversely associated with µCT indices of trabecular separation (Tb.Sp) (10,11) and structural model index (SMI) (18). Surprisingly, TBS was either not associated (18) or negatively correlated (11) with trabecular thick-ness (Tb.Th). These reported associations between TBS and µCT parameters were not adjusted for age, and it remains unclear whether or not age-adjusted cor-relations would remain signiicant. Of note, TBS was also correlated with vertebral mechanical behavior in
an ex vivo study of 16 human L3 lumbar vertebrae (18).
Studies by our group examined, for the irst time in vivo, the correlations between TBS and 3D microarchi-tecture parameters (19,20). We assessed TBS from spine DXA images and correlated it with HRpQCT measure-ments at the radius and tibia in 22 postmenopausal women with primary hyperparathyroidism (PHPT) and in 115 pre- and postmenopausal Chinese-American and Caucasian women. The study of subjects with PHPT revealed signiicant correlations between LS TBS and HRpQCT measurements of Tb.N (r = 0.505), Tb.Sp (r = -0.492), cortical thickness (r = 0.453), volumetric densities (r = 0.476 to 0.507), and whole bone stiff-ness (r = 0.442) at the radius (all p < 0.05) (19). TBS was also positively associated with measures of cortical thickness (r = 0.515), volumetric densities (r = 0.471 to 0.619), and whole bone stiffness at the tibia (r = 0.516; all p < 0.05), but its association with Tb.N and Tb.Sp was signiicant only after controlling for body weight (r = 0.573 and r = -0.524, respectively). TBS was not as-sociated with Tb.Th or trabecular stiffness at either the radius or the tibia.
In the study of Chinese-American and Caucasian women (71 pre- and 44 postmenopausal), all HRpQCT indices at the radius and tibia, except cortical thickness at the radius and Tb.Th at the tibia, were correlated with LS TBS. These correlations, however, were weak to moderate (r = 0.20 to 0.52; all p < 0.05) (20). In this cohort, we have also examined the associations bet-ween LS TBS and indices of central quantitative com-puted tomography (QCT) at the LS and femur. TBS was directly associated with QCT parameters of LS tra-becular volumetric BMD (r = 0.664), with tratra-becular and cortical volumetric densities and with an estimate of cortical thickness at the femoral neck (r = 0.641, 0.346, and 0.540 respectively) and total hip (r = 0.547, 0.491, and 0.541, respectively) (all p < 0.001). Adjust-ment for weight or BMI did not change the direction or signiicance of the correlations. The combination of
TBS with LS aBMD better predicted the variance in QCT measures than aBMD alone.
More recently, the association of TBS with HRpQCT indices was investigated in 72 healthy pre-menopausal women (mean age 33.8 years) (21). TBS was associated with trabecular volumetric BMD (r = 0.49 to 0.57), Tb.N (r = 0.43 to 0.58), Conn.D (r = 0.43 to 0.46), and Tb.Sp (r = -0.43 to -0.57), at the radius and tibia (all p < 0.01). There was a weak corre-lation between TBS and Tb.Th at the radius (r = 0.37; p < 0.01), but not at the tibia. TBS was either weakly or not associated with HRpQCT measures of cortical density, thickness and porosity.
RELATIONSHIP OF TBS WITH AGE AND MAJOR
CLINICAL RISK FACTORS
TBS tends to decline with age as shown in cross-sec-tional studies (14,22,23). Dufour and cols. observed, in 5,942 Caucasian French women (BMI < 40 kg/m2),
a linear decline of 14.5% in L1-L4 TBS between 45 and 85 years of age (14). Age related declines in LS BMD and TBS were also observed in a large cross-sectional study of 29,407 women ≥ 50 years from the province of Manitoba, Canada (22). Similarly, a negative correla-tion between L2-L4 TBS and age (r = -0.39, p < 0.001) was observed in 4,907 Lebanese women from 20 to 90 years of age (23).
In addition, TBS was associated with many of the risk factors that are predictive of osteoporotic fractures (22). Reduced TBS (lowest versus highest tertile) was associated, after adjusting for age and bone preserving treatment, with prior major fracture, rheumatoid ar-thritis, chronic obstructive pulmonary disease, recent glucocorticoid use, alcohol or other substance abuse, and higher BMI.
ASSOCIATION OF TBS WITH FRACTURE RISK
A number of cross-sectional (24-29) and prospective (15,16,30,31) studies have shown an association be-tween LS TBS and vertebral, hip, and other types of osteoporotic fractures in postmenopausal women. A recent published cross-sectional study has also demon-strated that TBS is associated with fractures in men (32).
Cross-sectional studies
Cop
yright
© ABE&M t
odos os dir
eit
os r
eser
vados
.
general, retrospective case-control studies, in which cases were women with vertebral fractures [conirmed either by radiographs or vertebral fracture assessment (VFA)] or with a history of hip (27) or other types of osteoporotic fractures (24-26,28,29). Control groups comprised women without evidence of any type of fra-gility fracture either not matched for age or BMD with cases (27,29), or matched with cases for age (25,26,28) or for age and BMI (24). Overall, TBS was signiicantly lower in cases than in controls, and both TBS and any BMD measurement were associated with fractures (Ta-ble 2). In a few studies, the combination of TBS with LS BMD was a better predictor of vertebral fractures than LS BMD alone (25,26).
Data in men, while limited, are similar. A retrospec-tive non-randomized case-control study enrolled 180 men ≥ 40 years old (BMI ranging from 17 to 36 kg/cm2),
45 of whom had a history of a low-energy fracture af-ter the age of 40 (32). Study subjects had sustained 59 fractures, including spine (34%), hip (14%), forearm (19), ankle (13%), humerus and rib (5% each) fractures. The control group consisted of 135 age- and LS BMD-matched men without evidence of low-energy fractures by self-report. TBS was lower in men with than in those without fractures (1.102 ± 0.129 vs. 1.159 ± 0.134, respectively; p = 0.013). Unadjusted odds ratios (ORs) for osteoporotic fractures and vertebral fracture (n = 17) were, respectively, 1.55 (95% CI 1.09–2.20), and
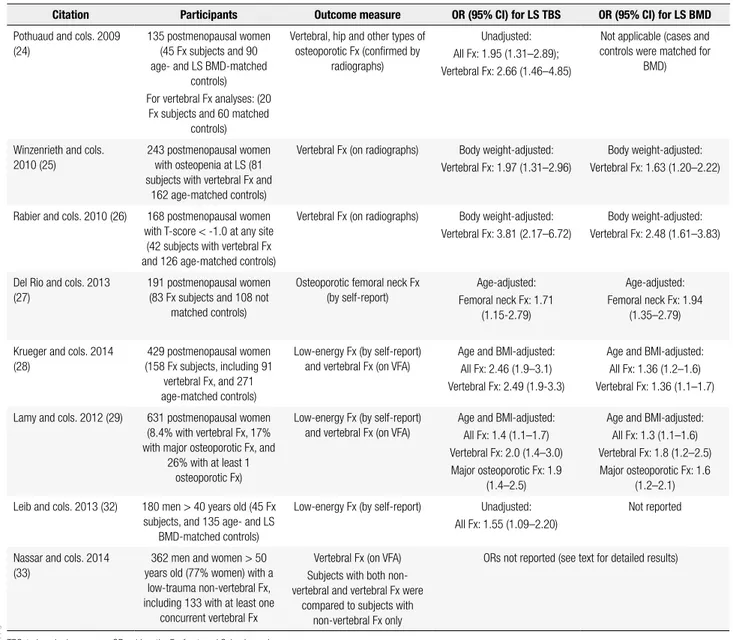
Table 2. Summary of cross-sectional studies
Citation Participants Outcome measure OR (95% CI) for LS TBS OR (95% CI) for LS BMD
Pothuaud and cols. 2009 (24)
135 postmenopausal women (45 Fx subjects and 90 age- and LS BMD-matched
controls) For vertebral Fx analyses: (20
Fx subjects and 60 matched controls)
Vertebral, hip and other types of osteoporotic Fx (conirmed by
radiographs)
Unadjusted: All Fx: 1.95 (1.31–2.89); Vertebral Fx: 2.66 (1.46–4.85)
Not applicable (cases and controls were matched for
BMD)
Winzenrieth and cols. 2010 (25)
243 postmenopausal women with osteopenia at LS (81 subjects with vertebral Fx and
162 age-matched controls)
Vertebral Fx (on radiographs) Body weight-adjusted: Vertebral Fx: 1.97 (1.31–2.96)
Body weight-adjusted: Vertebral Fx: 1.63 (1.20–2.22)
Rabier and cols. 2010 (26) 168 postmenopausal women with T-score < -1.0 at any site
(42 subjects with vertebral Fx and 126 age-matched controls)
Vertebral Fx (on radiographs) Body weight-adjusted: Vertebral Fx: 3.81 (2.17–6.72)
Body weight-adjusted: Vertebral Fx: 2.48 (1.61–3.83)
Del Rio and cols. 2013 (27)
191 postmenopausal women (83 Fx subjects and 108 not
matched controls)
Osteoporotic femoral neck Fx (by self-report)
Age-adjusted: Femoral neck Fx: 1.71
(1.15-2.79)
Age-adjusted: Femoral neck Fx: 1.94
(1.35–2.79)
Krueger and cols. 2014 (28)
429 postmenopausal women (158 Fx subjects, including 91
vertebral Fx, and 271 age-matched controls)
Low-energy Fx (by self-report) and vertebral Fx (on VFA)
Age and BMI-adjusted: All Fx: 2.46 (1.9–3.1) Vertebral Fx: 2.49 (1.9-3.3)
Age and BMI-adjusted: All Fx: 1.36 (1.2–1.6) Vertebral Fx: 1.36 (1.1–1.7)
Lamy and cols. 2012 (29) 631 postmenopausal women (8.4% with vertebral Fx, 17% with major osteoporotic Fx, and
26% with at least 1 osteoporotic Fx)
Low-energy Fx (by self-report) and vertebral Fx (on VFA)
Age and BMI-adjusted: All Fx: 1.4 (1.1–1.7) Vertebral Fx: 2.0 (1.4–3.0) Major osteoporotic Fx: 1.9
(1.4–2.5)
Age and BMI-adjusted: All Fx: 1.3 (1.1–1.6) Vertebral Fx: 1.8 (1.2–2.5) Major osteoporotic Fx: 1.6
(1.2–2.1)
Leib and cols. 2013 (32) 180 men > 40 years old (45 Fx subjects, and 135 age- and LS
BMD-matched controls)
Low-energy Fx (by self-report) Unadjusted: All Fx: 1.55 (1.09–2.20)
Not reported
Nassar and cols. 2014 (33)
362 men and women > 50 years old (77% women) with a
low-trauma non-vertebral Fx, including 133 with at least one
concurrent vertebral Fx
Vertebral Fx (on VFA) Subjects with both non-vertebral and non-vertebral Fx were
compared to subjects with non-vertebral Fx only
ORs not reported (see text for detailed results)
Cop
yright
© ABE&M t
odos os dir
eit
os r
eser
vados
.
2.07 (95% CI 1.14–3.74), for each SD decline in TBS. It is noteworthy that the control men had a TBS score that would be considered to be low for women, under-scoring the point that there are not normal TBS stan-dards yet for men.
LS TBS in a group of men and women was also examined in a cross-sectional study that included 362 subjects over 50 years old (77% women, mean age 74 ± 12 years) who had been hospitalized, within 4 to 90 days prior to the enrollment, for the treatment of a low-trauma non-vertebral fracture (33). Vertebral fractures were then assessed by VFA, and subjects were allocated to one of 2 groups based on the absence (n = 229) or presence of at least one vertebral fracture (n = 133; 57 grade 1, 47 grade 2, and 29 grade 3). TBS was signiicantly lower in patients with vertebral and non-vertebral fractures than in those with non-non-vertebral fractures only (1.157 ± 0.108 vs. 1.227 ± 0.107; p < 0.0001), as was BMD T-score at the LS, femoral neck, and total hip. TBS, LS BMD and total hip BMD pre-dicted vertebral fractures equally well, with areas under the receiving operator curve (AUCs) of 0.677, 0.669, and 0.692, respectively. The combination of TBS with LS BMD improved vertebral fracture discrimination as compared to LS BMD alone (p = 0.043), but not with total hip alone (p = 0.327). In the 173 subjects with BMD T-scores in the non-osteoporotic range, among whom 38 had a prevalent a vertebral fracture, TBS was a better discriminator of vertebral fractures than LS BMD alone (AUCs of 0.671 vs. 0.541; p = 0.035), but similar to total hip BMD alone (AUCs of 0.670 vs.
0.585; p = 0.264). The small number of cases, how-ever, limits this analysis.
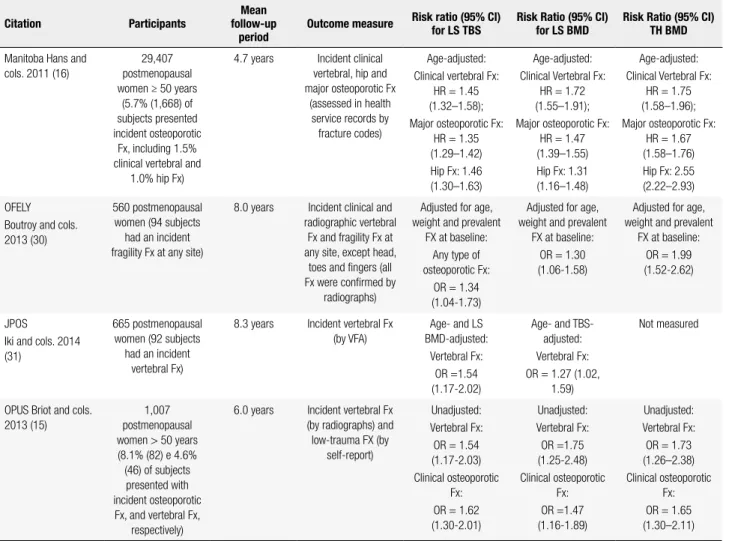
Prospective studies
Data from prospective studies are summarized in table 3 (15,16,30,31). The Manitoba study was the largest one to examine the ability of LS TBS to predict frac-ture risk (16). The study enrolled 29,407 women ≥ 50 years from the Canadian province of Manitoba, and showed that LS TBS at baseline predicted new clinical vertebral, hip and major osteoporotic fractures over a mean follow-up of 4.7 years. The combination of TBS with any BMD measurement (LS, femoral neck or to-tal hip) was a better predictor of osteoporotic fracture than BMD alone (p < 0.0001). However, the AUC for TBS + BMD was only slightly greater than the AUC for BMD alone (+ 0.02, + 0.01, and + 0.01, compared to
LS, femoral neck and total hip, respectively). Of note, LS TBS remained a predictor of fracture even after ad-justing for BMD and additional clinical risk factors.
In another prospective study, Boutroy and cols. (30) evaluated 560 postmenopausal Caucasian wo-men from the OFELY cohort, and showed that TBS and LS BMD predicted any type of fragility fracture equally well. The association between TBS and fracture remained even after controlling for age, body weight and prevalent fracture at baseline. Thirty-seven percent of fractures occurred in women with LS TBS < 1.209 (lowest quartile), and having a TBS below that thre-shold was a predictor of fracture risk in non-osteopo-rotic women [OR 2.75 (95% CI 1.47-5.17)], but not in osteoporotic subjects.
In the prospective study by Iki and cols. (31), TBS was a predictor of incident vertebral fractures on VFA (Table 3). LS BMD, TBS, and LS BMD + TBS pre-dicted vertebral fractures equally well, with AUCs of 0.673, 0.682, and 0.700, respectively. There was a higher incidence rate of vertebral fracture in the lower TBS tertile group in each BMD stratum.
Finally, the Osteoporosis and Ultrasound Study (OPUS) (15) examined the added value of TBS to BMD for prediction of fractures in 1,007 postmeno-pausal women (Table 3). Women with incident fractures were older than non-fractured subjects. The AUCs for TBS, BMD (at LS, femoral neck, and total hip), and the combination of TBS with any BMD measurement were similar. The performance of TBS, BMD and TBS + BMD for fracture prediction was examined using reassignment analysis assessed by net reclassiication improvement (NRI). While for prediction of incident clinical osteoporotic fractures the combination of TBS with LS BMD was similar to LS BMD alone (NRI = 10.5%, p = 0.105), for prediction of vertebral fractures, TBS and LS BMD together increased the performance over LS BMD alone (NRI = 8.6%, p = 0.046).
ROLE OF TBS IN SECONDARY OSTEOPOROSIS
Diabetes mellitus
follow-Cop
yright
© ABE&M t
odos os dir
eit
os r
eser
vados
.
Table 3. Summary of prospective studies
Citation Participants
Mean follow-up
period
Outcome measure Risk ratio (95% CI) for LS TBS
Risk Ratio (95% CI) for LS BMD
Risk Ratio (95% CI) TH BMD
Manitoba Hans and cols. 2011 (16)
29,407 postmenopausal women ≥ 50 years
(5.7% (1,668) of subjects presented incident osteoporotic
Fx, including 1.5% clinical vertebral and
1.0% hip Fx)
4.7 years Incident clinical vertebral, hip and major osteoporotic Fx
(assessed in health service records by fracture codes)
Age-adjusted: Clinical vertebral Fx:
HR = 1.45 (1.32–1.58); Major osteoporotic Fx:
HR = 1.35 (1.29–1.42) Hip Fx: 1.46 (1.30–1.63)
Age-adjusted: Clinical Vertebral Fx:
HR = 1.72 (1.55–1.91); Major osteoporotic Fx:
HR = 1.47 (1.39–1.55) Hip Fx: 1.31 (1.16–1.48)
Age-adjusted: Clinical Vertebral Fx:
HR = 1.75 (1.58–1.96); Major osteoporotic Fx:
HR = 1.67 (1.58–1.76) Hip Fx: 2.55 (2.22–2.93)
OFELY Boutroy and cols. 2013 (30)
560 postmenopausal women (94 subjects
had an incident fragility Fx at any site)
8.0 years Incident clinical and radiographic vertebral
Fx and fragility Fx at any site, except head,
toes and ingers (all Fx were conirmed by
radiographs)
Adjusted for age, weight and prevalent
FX at baseline: Any type of osteoporotic Fx:
OR = 1.34 (1.04-1.73)
Adjusted for age, weight and prevalent
FX at baseline: OR = 1.30 (1.06-1.58)
Adjusted for age, weight and prevalent
FX at baseline: OR = 1.99 (1.52-2.62)
JPOS
Iki and cols. 2014 (31)
665 postmenopausal women (92 subjects
had an incident vertebral Fx)
8.3 years Incident vertebral Fx (by VFA)
Age- and LS BMD-adjusted:
Vertebral Fx: OR =1.54 (1.17-2.02)
Age- and TBS-adjusted: Vertebral Fx: OR = 1.27 (1.02,
1.59)
Not measured
OPUS Briot and cols. 2013 (15)
1,007 postmenopausal women > 50 years (8.1% (82) e 4.6% (46) of subjects presented with incident osteoporotic Fx, and vertebral Fx,
respectively)
6.0 years Incident vertebral Fx (by radiographs) and low-trauma FX (by
self-report)
Unadjusted: Vertebral Fx: OR = 1.54 (1.17-2.03) Clinical osteoporotic
Fx: OR = 1.62 (1.30-2.01) Unadjusted: Vertebral Fx: OR =1.75 (1.25-2.48) Clinical osteoporotic Fx: OR =1.47 (1.16-1.89) Unadjusted: Vertebral Fx: OR = 1.73 (1.26–2.38) Clinical osteoporotic
Fx: OR = 1.65 (1.30–2.11)
TBS: trabecular bone score; BMD: bone mineral density; OR: odds ratio; HR: hazard ratio; Fx: fracture; LS: lumbar spine; TH: total hip.
up period of 4.7 years, and after covariate adjustment, the risk for major osteoporotic fracture was 49% greater (HR 95% CI 1.27–1.74) in women with diabetes than in those without diabetes. While BMD did not predict fracture among the diabetes cohort, TBS was a BMD-independent predictor of fracture, and predicted frac-tures in those with diabetes (adjusted HR 1.27, 95%CI 1.10-1.46) as well as in nondiabetic women (HR 1.31, 95%CI 1.24-1.38).
Primary hyperparathyroidism
The association of vertebral fracture and TBS was exa-mined in a cross-sectional study of 73 postmenopausal women with primary hyperparathyroidism (PHPT) compared to 74 age-matched healthy women (35). While LS BMD and femoral neck BMD were similar between the groups, TBS was signiicantly lower in subjects with PHPT (1.19 ± 0.10) than in controls (1.24 ± 0.09, p < 0.01). Total hip and 1/3 radius
BMDs were also lower in PHPT subjects (p < 0.01). In the PHPT group, TBS was signiicantly lower in subjects with (n = 29) than in those without (n = 44) radiographic vertebral fractures (1.14 ± 0.10 vs. 1.22 ± 0.10, respectively; p < 0.01), with an AUC of 0.716 (95%CI: 0.590-0.841; p = 0.002). PHPT patients with (n = 18) and without (n = 55) non-vertebral fractures had similar TBS values.
Cop
yright
© ABE&M t
odos os dir
eit
os r
eser
vados
.
greater risk of vertebral fracture (OR 1.4, 95%CI 1.1-1.9, p = 0.02), regardless of LS BMD, age, BMI and gender. In the PHPT group, 20 subjects who under-went parathyroidectomy were compared with 10 non-surgically treated cases after 24 months. At month 24, TBS improved in surgically treated patients, whereas it remained stable in conservatively treated subjects. A recent study conirmed that TBS improves at 1 year fol-lowing parathyroidectomy in subjects with PHPT (37).
Rheumatoid arthritis
A cross-sectional study evaluated 185 women (mean age 56 ± 14 years) known to have rheumatoid arthritis (RA) for 15.5 ± 9.9 years (38). Approximately 60% of the study population (n = 112) was in use of glucocor-ticoids (mean daily dose of 6.4 mg equivalent to pred-nisone). Both BMD T-scores and TBS were signiicant-ly lower among patients with vertebral fracture (n = 33; 17.8%) than in non-fractured individuals. The AUCs for vertebral fracture were similar for TBS (0.704), LS BMD (0.621), femoral neck BMD (0.727), and total hip BMD (0.719).
Adrenal incidentaloma and subclinical hypercortisolism
The association between TBS and fractures was ex-plored in 102 patients with adrenal incidentaloma [AI; 63 females; 34 with subclinical hypercortisolism (SH)], and 70 matched controls (39). In patients, vertebral fractures were assessed by X-rays. Z-scores were used to report TBS and BMD. TBS (-3.18 ± 1.21) was lower in subjects with SH than in patients without SH (-1.70 ± 1.54, p < 0.0001) or controls (-1.19 ± 0.99, p < 0.0001), as was LS BMD and total femur BMD. A low TBS, as deined by a TBS Z–score < -1.5, was associated with the presence of vertebral fracture, re-gardless of age, BMI, and gender [OR = 4.8 (95% CI 1.85–12.42), p < 0.001]. A subgroup of 40 patients was followed for 24 months, and among them, TBS predicted the occurrence of a new fracture even after adjusting for LS BMD, BMI, and age (OR = 11.2; 95%CI, 1.71–71.41, p < 0.012).
Other conditions
A recent prospective study evaluated the effect of growth hormone (GH) replacement on TBS in 147 subjects with growth hormone deiciency (GHD; mean age 35.1 years; 84 males) (40). Compared to baseline,
there was a signiicant increase in BMD at LS (+14%) and total femur (+7%) at 2 years of GH replacement (both p ≤ 0.001). TBS, obtained in a subgroup of 32 subjects with GHD, was also improved after 2 years of GH replacement. However, the reported result (4% gain at 2 years) was recorded at the level of L4 only, which limits this analysis.
Data reported in abstracts also showed that TBS is related to fractures in individuals with chronic kidney disease (41) and on long-term glucocorticoid (GC) therapy (42). The study of 47 women with CKD (grade not reported), and 94 healthy women (73% postmeno-pausal) showed that, compared to controls, subjects with CKD have reduced TBS (p < 0.0001) (41). In the CKD group, while no difference was seen for BMD (p = 0.46), TBS was signiicantly lower in subjects with a prior fracture (number of fractures not reported) than in non-fractured subjects (p = 0.034), with an unad-justed OR of 2.5 (95% CI 1.02-6.15), and AUC of 0.756 (0.609-0.870). Age- or BMI-adjusted ORs were not reported.
Finally, the impact of long-term GC therapy on TBS was explored in 136 women, aged 45 to 80 years, treated with GCs (≥ 5 mg/day) for ≥ 1 year (42). Com-pared with the age-matched normal values, GC-treated patients had a 4% decrease in TBS (p < 0.0001), but no change in BMD (p = 0.49). In GC treated-patients, the age-adjusted OR for TBS was 1.62 (95% CI 1.02-2.59) for vertebral fracture and 1.60 (95% CI 1.04–2.47) for osteoporotic peripheral fracture. The association be-tween fracture risk and BMD was not signiicant.
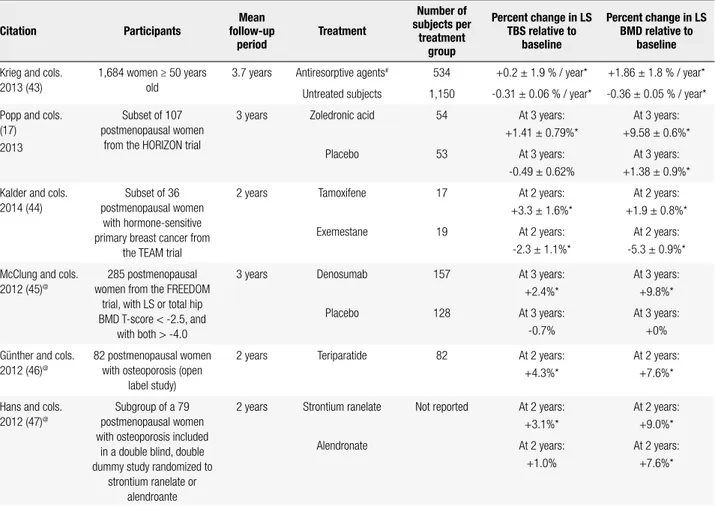
EFFECT OF OSTEOPOROSIS THERAPY ON TBS
Cop
yright
© ABE&M t
odos os dir
eit
os r
eser
vados
.
Table 4. Summary of studies that evaluated the impact of different osteoporosis therapies on LS TBS
Citation Participants
Mean follow-up
period
Treatment
Number of subjects per
treatment group
Percent change in LS TBS relative to
baseline
Percent change in LS BMD relative to
baseline
Krieg and cols. 2013 (43)
1,684 women ≥ 50 years old
3.7 years Antiresorptive agents# 534 +0.2 ± 1.9 % / year* +1.86 ± 1.8 % / year*
Untreated subjects 1,150 -0.31 ± 0.06 % / year* -0.36 ± 0.05 % / year*
Popp and cols. (17) 2013
Subset of 107 postmenopausal women
from the HORIZON trial
3 years Zoledronic acid 54 At 3 years:
+1.41 ± 0.79%*
At 3 years: +9.58 ± 0.6%*
Placebo 53 At 3 years:
-0.49 ± 0.62%
At 3 years: +1.38 ± 0.9%*
Kalder and cols. 2014 (44)
Subset of 36 postmenopausal women
with hormone-sensitive primary breast cancer from
the TEAM trial
2 years Tamoxifene 17 At 2 years:
+3.3 ± 1.6%*
At 2 years: +1.9 ± 0.8%*
Exemestane 19 At 2 years:
-2.3 ± 1.1%*
At 2 years: -5.3 ± 0.9%*
McClung and cols. 2012 (45)@
285 postmenopausal women from the FREEDOM
trial, with LS or total hip BMD T-score < -2.5, and
with both > -4.0
3 years Denosumab 157 At 3 years:
+2.4%*
At 3 years: +9.8%*
Placebo 128 At 3 years:
-0.7%
At 3 years: +0%
Günther and cols. 2012 (46)@
82 postmenopausal women with osteoporosis (open
label study)
2 years Teriparatide 82 At 2 years:
+4.3%*
At 2 years: +7.6%*
Hans and cols. 2012 (47)@
Subgroup of a 79 postmenopausal women with osteoporosis included
in a double blind, double dummy study randomized to
strontium ranelate or alendroante
2 years Strontium ranelate Not reported At 2 years: +3.1%*
At 2 years: +9.0%*
Alendronate At 2 years:
+1.0%
At 2 years: +7.6%*
TBS: trabecular bone score; LS: lumbar spine; BMD: bone mineral density; HORIZON trial: Health Outcomes and Reduced Incidence with Zoledronic acid Once Yearly; FREEDOM trial: Fracture Reduction Evaluation of Denosumab in Osteoporosis Every 6 Months; TEAM Study: Tamoxifene Exemestane Adjuvant Multinational Study.
* P < 0.05 compared to baseline. # 86% bisphosphonates, 10% raloxifene, and 4% calcitonin. @ Data reported in abstracts.
CONCLUSIONS – TRABECULAR BONE SCORE:
FACTS AND FUTURE
TBS is an indirect index of bone microarchitecture that has a major clinical advantage of being readily avail-able from DXA images. It is associated with 3D direct measures of trabecular microarchitecture, and with di-rect and indidi-rect measures of bone strength. TBS de-clines with age, and is correlated with major clinical risk factors that are predictive of osteoporotic fractures. Seve ral cross-sectional and prospective studies, invol-ving a large number of postmenopausal women, have conirmed the association of TBS with vertebral and non-vertebral fractures. Data in men, while much less extensive, show similar indings. There is also evidence that, while TBS and LS BMD predict fracture equally well, TBS slightly improves fracture prediction when combined with any BMD measurement.
Indeed, these results provide support for utilizing TBS in conjunction with BMD to estimate fracture
risk. This approach may be especially useful in indivi-duals with BMD values in the osteopenic range. This is of interest, since most individuals with fragility fractures will have BMD values not in the osteoporotic range but rather in the osteopenic or even normal range (48,49). This observation could be explained by other aspects of bone quality, such as bone microarchitecture, or even by readily assessable clinical risk factors that increase fracture risk independent of the BMD measurement. Thus, for those with BMD in the osteopenic range, TBS, when used in combination with the fracture risk assessment system (FRAX®), which incorporates clinical
risk factors along with BMD (50), may have a role in fracture risk assessment. In fact, preliminary data have shown that TBS may improve fracture prediction when used in combination with FRAX® (51,52).
osteoporo-Cop
yright
© ABE&M t
odos os dir
eit
os r
eser
vados
.
sis. This is particularly attractive in those conditions in which the increase in fracture risk is largely independent of BMD by DXA, such as diabetes mellitus or long-term GC exposure. Similarly, in asymptomatic PHPT, the trabecular bone as assessed by LS BMD appears re-latively well preserved, whereas epidemiological studies show increased fracture risk in vertebral and non-ver-tebral sites. While these unexpected indings between fracture risk and BMD by DXA may be explained by an inferior bone microarchitecture, current methods to assess microstructure are not routinely available, so that TBS could be used, combined with BMD, for fracture-risk assessment in such cases of secondary osteoporosis. Finally, current data do not support the use of TBS to estimate antifracture effectiveness of diverse osteopo-rosis treatments, and further research is needed to eva-luate the value of TBS for monitoring treatment effect. There are a number of areas for future research and delineation. A well-established TBS cut-point that clas-siies normal and abnormal TBS values has not yet been deined. The TBS reference range that has been pro-posed so far (Table 1), which applies to postmenopau-sal women only, was recommended by a working group of TBS users. This deinition remains to be deinitively established across age and gender. Also, as noted be-fore, the use of TBS in subjects with BMI below 15 kg/m2 and over 35 kg/m2 has not been validated.
Additionally, while there are extensive data estab-lishing an association between TBS and fracture risk in postmenopausal women, data in men are limited. Of note, when TBS is derived from DXA images obtained in GE-Lunar densitometers, TBS appears to be lower in men than in women, which is surprising given the previous observations of better trabecular microarchi-tecture in aging men than in women by histomorpho-metry and HRpQCT (53,54).
Finally, despite the strong correlations between TBS and 3D measures of trabecular microarchitecture in ex vivo studies, studies in vivo have shown only moderate correlations. Additionally, the majority of the studies did not ind an association between TBS and trabecu-lar thickness, indicating that TBS may not fully capture some aspects of bone microstructure assessed by higher resolution imaging modalities.
In conclusion, current data on lumbar spine TBS are promising. If further studies establish TBS cut-points across age and gender, and conirm that TBS improves fracture prediction from FRAX, TBS could become a valuable adjunctive clinical tool in fracture risk
assess-ment, assisting in therapeutic decision-making particu-larly in those at intermediate risk for fracture.
Acknowledgments: Barbara C. Silva and John P. Bilezikian met guidelines for authorship: drafting the manuscript and approv-ing its inal version. Supported by Coordenação de Aperfeiçoa-mento de Pessoal de Nível Superior (Capes) (to Barbara C. Silva), and National Institutes of Health grant DK32333 (to John P. Bilezikian).
Disclosure: no potential conlict of interest relevant to this article was reported.
REFERENCES
1. Osteoporosis prevention, diagnosis, and therapy. NIH Consens Statement. 2000;17(1):1-45.
2. Kulak CA, Dempster DW. Bone histomorphometry: a concise review for endocrinologists and clinicians. Arq Bras Endocrinol Metabol. 2010;54(2):87-98.
3. Hildebrand T, Laib A, Müller R, Dequeker J, Rüegsegger P. Direct three-dimensional morphometric analysis of human cancellous bone: microstructural data from spine, femur, iliac crest, and cal-caneus. J Bone Miner Res. 1999;14(7):1167-74.
4. Boutroy S, Bouxsein ML, Munoz F, Delmas PD. In vivo assess-ment of trabecular bone microarchitecture by high-resolution peripheral quantitative computed tomography. J Clin Endocrinol Metab. 2005;90(12):6508-15.
5. Krug R, Carballido-Gamio J, Banerjee S, Burghardt AJ, Link TM, Majumdar S. In vivo ultra-high-ield magnetic resonance imaging of trabecular bone microarchitecture at 7 T. J Magn Reson Imag-ing. 2008;27(4):854-9.
6. Prouteau S, Ducher G, Nanyan P, Lemineur G, Benhamou L, Cour-teix D. Fractal analysis of bone texture: a screening tool for stress fracture risk? Eur J Clin Invest. 2004;34(2):137-42.
7. Chappard D, Guggenbuhl P, Legrand E, Baslé MF, Audran M. Tex-ture analysis of X-ray radiographs is correlated with bone histo-morphometry. J Bone Miner Metab. 2005;23(1):24-9.
8. Vokes TJ, Giger ML, Chinander MR, Karrison TG, Favus MJ, Dixon LB. Radiographic texture analysis of densitometer-generated cal-caneus images differentiates postmenopausal women with and without fractures. Osteoporos Int. 2006;17(10):1472-82.
9. Pothuaud L, Carceller P, Hans D. Correlations between grey-level variations in 2D projection images (TBS) and 3D microarchitec-ture: applications in the study of human trabecular bone microar-chitecture. Bone. 2008;42(4):775-87.
10. Winzenrieth R, Michelet F, Hans D. Three-dimensional (3D) micro-architecture correlations with 2D projection image gray-level vari-ations assessed by trabecular bone score using high-resolution computed tomographic acquisitions: effects of resolution and noise. J Clin Densitom. 2013;16(3):287-96.
11. Hans D, Barthe N, Boutroy S, Pothuaud L, Winzenrieth R, Krieg MA. Correlations between trabecular bone score, measured us-ing anteroposterior dual-energy X-ray absorptiometry acquisi-tion, and 3-dimensional parameters of bone microarchitecture: an experimental study on human cadaver vertebrae. J Clin Den-sitom. 2011;14(3):302-12.
12. Silva BC, Leslie WD, Resch H, Lamy O, Lesnyak O, Binkley N, et al. Trabecular bone score: a non-invasive analytical method based upon the DXA image. J Bone Miner Res. 2014;29(3):518-30. 13. Cormier C, Lamy O, Poriau S. TBS in routine clinial practice:
Cop
yright
© ABE&M t
odos os dir
eit
os r
eser
vados
.
14. Dufour R, Winzenrieth R, Heraud A, Hans D, Mehsen N. Genera-tion and validaGenera-tion of a normative, age-speciic reference curve for lumbar spine trabecular bone score (TBS) in French women. Osteoporos Int. 2013;24(11):2837-46.
15. Briot K, Paternotte S, Kolta S, Eastell R, Reid DM, Felsenberg D, et al. Added value of trabecular bone score to bone mineral den-sity for prediction of osteoporotic fractures in postmenopausal women: The OPUS study. Bone. 2013;57(1):232-6.
16. Hans D, Goertzen AL, Krieg MA, Leslie WD. Bone microarchitec-ture assessed by TBS predicts osteoporotic fracmicroarchitec-tures indepen-dent of bone density: the Manitoba study. J Bone Miner Res. 2011;26(11):2762-9.
17. Popp AW, Guler S, Lamy O, Senn C, Buffat H, Perrelet R, et al. Effects of zoledronate versus placebo on spine bone mineral density and microarchitecture assessed by the trabecular bone score in postmenopausal women with osteoporosis: a three-year study. J Bone Miner Res. 2013;28(3):449-54.
18. Roux JP, Wegrzyn J, Boutroy S, Bouxsein ML, Hans D, Chapurlat R. The predictive value of trabecular bone score (TBS) on whole lumbar vertebrae mechanics: an ex vivo study. Osteoporos Int. 2013;24(9):2455-60.
19. Silva BC, Boutroy S, Zhang C, McMahon DJ, Zhou B, Wang J, et al. Trabecular bone score (TBS)--a novel method to evaluate bone microarchitectural texture in patients with primary hyperparathy-roidism. J Clin Endocrinol Metab. 2013;98(5):1963-70.
20. Silva BC, Walker MD, Abraham A, Boutroy S, Zhang C, McMa-hon DJ, et al. Trabecular bone score is associated with volumetric bone density and microarchitecture as assessed by central QCT and HRpQCT in Chinese American and white women. J Clin Den-sitom. 2013;16(4):554-61.
21. Popp AW, Buffat H, Eberli U, Lippuner K, Ernst M, Richards RG, et al. Microstructural Parameters of Bone Evaluated Using HR-pQCT Correlate with the DXA-Derived Cortical Index and the Trabecular Bone Score in a Cohort of Randomly Selected Premenopausal Women. PLoS One. 2014;9(2):e88946.
22. Leslie WD, Krieg MA, Hans D; Manitoba Bone Density Program. Clinical Factors Associated With Trabecular Bone Score. J Clin Densitom. 2013;16(3):374-379.
23. El Hage R, Khairallah W, Bachour F, Issa M, Eid R, Fayad F, et al. In-luence of Age, Morphological Characteristics, and Lumbar Spine Bone Mineral Density on Lumbar Spine Trabecular Bone Score in Lebanese Women. J Clin Densitom. 2013 Apr 9. pii: S1094-6950(13)00049-8.
24. Pothuaud L, Barthe N, Krieg MA, Mehsen N, Carceller P, Hans D. Evaluation of the potential use of trabecular bone score to com-plement bone mineral density in the diagnosis of osteoporosis: a preliminary spine BMD-matched, case-control study. J Clin Den-sitom. 2009;12(2):170-6.
25. Winzenrieth R, Dufour R, Pothuaud L, Hans D. A retrospective case-control study assessing the role of trabecular bone score in postmenopausal Caucasian women with osteopenia: analyzing the odds of vertebral fracture. Calcif Tissue Int. 2010;86(2):104-9. 26. Rabier B, Heraud A, Grand-Lenoir C, Winzenrieth R, Hans D. A
multicentre, retrospective case-control study assessing the role of trabecular bone score (TBS) in menopausal Caucasian women with low areal bone mineral density (BMDa): Analysing the odds of vertebral fracture. Bone. 2010;46(1):176-81.
27. Del Rio LM, Winzenrieth R, Cormier C, Di Gregorio S. Is bone microarchitecture status of the lumbar spine assessed by TBS related to femoral neck fracture? A Spanish case-control study. Osteoporos Int. 2013;24(3):991-8.
28. Krueger D, Fidler E, Libber J, Aubry-Rozier B, Hans D, Binkley N. Spine trabecular bone score subsequent to bone mineral den-sity improves fracture discrimination in women. J Clin Densitom. 2014;17(1):60-5.
29. Lamy O, Krieg MA, Stoll D, Aubry-Rozier B, Metzger M, Hans D. The OsteoLaus Cohort Study: Bone mineral density, micro-architecture score and vertebral fracture assessment extracted from a single DXA device in combination with clinical risk factors improve signiicantly the identiication of women at high risk of fracture. Osteologie. 2012;21:77-82.
30. Boutroy S, Hans D, Sornay-Rendu E, Vilayphiou N, Winzenrieth R, Chapurlat R. Trabecular bone score improves fracture risk predic-tion in non-osteoporotic women: the OFELY study. Osteoporos Int. 2013;24(1):77-85.
31. Iki M, Tamaki J, Kadowaki E, Sato Y, Dongmei N, Winzenrieth R, et al. Trabecular bone score (TBS) predicts vertebral fractures in Japanese women over 10 years independently of bone den-sity and prevalent vertebral deformity: the Japanese Population-Based Osteoporosis (JPOS) cohort study. J Bone Miner Res. 2014;29(2):399-407.
32. Leib E, Winzenrieth R, Aubry-Rozier B, Hans D. Vertebral micro-architecture and fragility fracture in men: A TBS study. Bone. 2014;62:51-5. doi: 10.1016/j.bone.2013.12.015. Epub 2013 Dec 19. 33. Nassar K, Paternotte S, Kolta S, Fechtenbaum J, Roux C, Briot K.
Added value of trabecular bone score over bone mineral density for identiication of vertebral fractures in patients with areal bone mineral density in the non-osteoporotic range. Osteoporos Int. 2014;25(1):243-9.
34. Leslie WD, Aubry-Rozier B, Lamy O, Hans D. TBS (Trabecular Bone Score) and Diabetes-Related Fracture Risk. J Clin Endocrinol Metab. 2013;98(2):602-9.
35. Romagnoli E, Cipriani C, Nofroni I, Castro C, Angelozzi M, Scarpi-ello A, et al. “Trabecular Bone Score” (TBS): an indirect measure of bone micro-architecture in postmenopausal patients with pri-mary hyperparathyroidism. Bone. 2013;53(1):154-9.
36. Eller-Vainicher C, Filopanti M, Palmieri S, Ulivieri FM, Morelli V, Zhukouskaya VV, et al. Bone quality, as measured by trabecular bone score, in patients with primary hyperparathyroidism. Eur J Endocrinol. 2013;169(2):155-62.
37. Rolighed L, Rejnmark L, Sikjaer T, Heickendorff L, Vestergaard P, Mosekilde L, et al. Vitamin D treatment in primary hyperparathy-roidism: a randomized placebo controlled trial. J Clin Endocrinol Metab. 2014: jc20133978.
38. Breban S, Briot K, Kolta S, Paternotte S, Ghazi M, Fechtenbaum J, et al. Identiication of rheumatoid arthritis patients with vertebral fractures using bone mineral density and trabecular bone score. J Clin Densitom. 2012;15(3):260-6.
39. Eller-Vainicher C, Morelli V, Ulivieri FM, Palmieri S, Zhukouskaya VV, Cairoli E, et al. Bone quality, as measured by trabecular bone score in patients with adrenal incidentalomas with and without subclini-cal hypercortisolism. J Bone Miner Res. 2012;27(10):2223-30. 40. Kuzma M, Kuzmova Z, Zelinkova Z, Killinger Z, Vanuga P,
Lazur-ova I, et al. Impact of the growth hormone replacement on bone status in growth hormone deicient adults. Growth Horm IGF Res. 2014;24(1):22-8.
41. Leib E, Stoll D, Winzenrieth R, Hans D. Lumbar spine microarchi-tecture impairment evaluation in chronic kidney disease: a TBS study. J Clin Densitom. 2013;16(Suppl):266(abstract).
42. Colson F, Picard A, Rabier B, Piperno M, Vignon E. Trabecular bone microarchitecture alteration in glucocorticoids treated women in clinical routine?: A TBS Evaluation. J Bone Miner Res. 2009;24(Suppl 1.):Abstract.
43. Krieg MA, Aubry-Rozier B, Hans D, Leslie WD. Effects of anti-re-sorptive agents on trabecular bone score (TBS) in older women. Osteoporos Int. 2013;24(3):1073-8.
as-Cop
yright
© ABE&M t
odos os dir
eit
os r
eser
vados
.
sessed by DXA in women with breast cancer. J Clin Densitom. 2014;17(1):66-71.
45. McClung M, Lippuner K, Brandi M, Kaufman J-M, Zanchetta J, Krieg M, et al. Denosumab signiicantly improved trabecular bone score (TBS), an index of trabecular microarchitecture, in postmenopausal women with osteoporosis. J Bone Miner Res. 2012;27(Suppl 1):S58-S59 (abstract).
46. Günther B, Popp A, Stoll D, Rosier B, Perrelet R, Hans D, et al. Beneicial effect of PTH on spine BMD and microarchitecture (TBS) parameters in postmenopausal women with osteopo-rosis. A 2-year study. Osteoporosis Int. 2012;23(Suppl 2):S332-S333(abstract).
47. Hans D, Krieg M, Lamy O, Felsenberg D. Beneicial Effects of strontium ranelate compared to alendronate on trabecular bone score in post menopausal osteoporotic women. A 2-year study. Osteoporosis Int. 2012;23(Suppl 2):S265-S267(abstract). 48. Siris ES, Miller PD, Barrett-Connor E, Faulkner KG, Wehren LE,
Abbott TA, et al. Identiication and fracture outcomes of undi-agnosed low bone mineral density in postmenopausal women: results from the National Osteoporosis Risk Assessment. JAMA. 2001;286(22):2815-22.
49. Miller PD, Siris ES, Barrett-Connor E, Faulkner KG, Wehren LE, Abbott TA, et al. Prediction of fracture risk in postmenopausal
white women with peripheral bone densitometry: evidence from the National Osteoporosis Risk Assessment. J Bone Miner Res. 2002;17(12):2222-30.
50. Kanis JA, Oden A, Johnell O, Johansson H, De Laet C, Brown J, et al. The use of clinical risk factors enhances the performance of BMD in the prediction of hip and osteoporotic fractures in men and women. Osteoporos Int. 2007;18(8):1033-46.
51. Leslie W, Kanis J, Lamy O, Johansson H, Oden A, McCloskey E, et al. Adjustment of FRAX probability according to lumbar spine Trabecular Bone Score (TBS): The Manitoba BMD Cohort. J Clin Densitom. 2013;16(Suppl):267-268(abstract).
52. Lamy O, Krieg M, Stoll D, Aubry-Rozier B, Metzger M, Hans D. What is the performance in vertebral fracture discrimination by Bone mineral density (BMD), micro-architecture estimation (TBS), and FRAX in stand-alone, combined or adjusted approach-es: The OsteoLaus Study. ECTS abstract. 2013.
53. Aaron JE, Makins NB, Sagreiya K. The microanatomy of trabecu-lar bone loss in normal aging men and women. Clin Orthop Relat Res. 1987(215):260-71.