*Correspondence: L.A. Chiavacci. Departamento de Fármacos e Medicamen-tos, Faculdade de Ciências Farmacêuticas, Universidade Estadual Paulista “Júlio de Mesquita Filho”. Rod. Araraquara, km 1, Bairro Jaú, 14800-900 – Araraquara - SP, Brasil. E-mail: [email protected]
A
vol. 50, n. 3, jul./sep., 2014 http://dx.doi.org/10.1590/S1984-82502014000300025
Relationship between composition and organizational levels of
nanostructured systems formed by Oleth 10 and PPG-5-Ceteth-20
for potential drug delivery
Nathalia Cristina Rissi
1, Danila Aparecida Scatolin Guglielmi
1, Marcos Antônio Corrêa
1, Leila
Aparecida Chiavacci
1,*1Department of Drugs and Medicaments, Faculty of Pharmaceutical Sciences, University of State of São Paulo
“Júlio de Mesquita Filho”, Araraquara, SP, Brazil
In this paper, nanostructured systems were developed, with the aid of ternary phase diagrams, from two surfactants, of differing degrees of lipophilicity (PPG-5-Ceteth-20 and the Oleth 10) and two oil phases (oleic acid and isopropyl myristate). It was observed that there were differences between the four resulting phase diagrams in the physical properties of the systems they represent. Thus, due to the capacity of Oleth 10 (as surfactant) and oleic acid (as the oil phase) to reduce interfacial tension, large regions of translucent systems were seen on the diagrams produced by them. By polarized light microscopy, it was possible to
identify the isotropic and anisotropic properties of these systems, which were conirmed by small-angle
X-ray scattering (SAXS) analysis. Furthermore, it was found that increasing the proportion of water in the
formulations led to more highly organized structures, resulting in narrower and well deined SAXS peaks.
Uniterms: Ternary phase diagrams. Nanostructured systems. Small-angle X-ray scattering/proiles. Drugs/delivery systems.
Neste trabalho, os sistemas nanoestruturados com diferentes níveis de organização foram obtidos através
dos diagramas de fase ternários, utilizando tensoativos com de diferentes graus de lipoilicidade, o
PPG-5-Ceteth-20 e o Oleth 10, e ácido oleico e miristato de isopropila como fases oleosas. Através dos diagramas
foi possível observar diferenças signiicativas relacionadas com as características dos sistemas, devido
à capacidade que o Oleth 10 (como tensoativo) e o ácido oleico (como fase oleosa) têm em diminuir a tensão interfacial, facilitando a formação de uma extensa região de sistemas transparentes. Através da
microscopia de luz polarizada foi possível identiicar as características isotrópicas e anisotrópicas dos sistemas, sendo posteriormente conirmadas pelas curvas de dispersão de raios X de pequeno ângulo (SAXS). Além disso, foi possível veriicar que o aumento de água nas formulações proporcionou maior estruturação, permitindo a observação de picos mais estreitos e deinidos nas curvas de SAXS.
Unitermos: Diagramas de fases ternários. Sistemas nanoestruturados. Curvas de dispersão de raios X
de pequeno ângulo/peris. Fármacos/sistems de liberação.
INTRODUCTION
Important nanostructured systems are described by means of phase diagrams and used in the chemical and pharmaceutical industries for the development of drug delivery systems (Boonme et al., 2006; Corrêa et al., 2005). These systems can act as reservoirs controlling the
with nonionic surfactants are generally less affected by the presence of additives (buffer, electrolytes and preservatives) and changes in pH than those with ionic surfactants, and are safer and less likely to cause irritation (Kreilgaard, 2002; Garti et al., 2004).
For years, microemulsions formed by long-chain nonionic surfactants have been studied as drug delivery systems. However, there are few studies on liquid crystal phases produed by these surfactants for this purpose (Wang et al., 2006). In this study we used two nonionic surfactants, long chain polyoxyethylene (10) oleyl ether (Oleth 10) and polyoxypropylene, polyoxyethylene ether of cetyl alcohol (PPG-5-Ceteth-20), pharmacologically and toxicologically acceptable and capable of forming nanostructured systems (Ghosh et al., 2011; Wang et al., 2005; Bruschi et al., 2008; El-Hadiry et al., 2012). The oil component is also important, because it affects the structure of the system, which must be compatible with the drug used, especially if the latter is lipophilic (Podlogar
et al., 2005; Moreno, Ballesteros, Frutos, 2003). When these systems are applied to the skin, some fatty acids and esters can act as drug penetration enhancers, helping the percutaneous absorption of drugs that do not have good skin penetration (Agatonovic-Kustrin et al., 2003; Valenta, Schultz, 2004). Unsaturated fatty acids are more effective in promoting percutaneous absorption of drugs than their saturated homologues (Garti, Arsenin, 1996). Therefore, for the preliminary preparation of phase diagrams, the fatty acid ester, isopropyl myristate, and monounsaturated fatty acid, oleic acid, were utilizad.
MATERIAL AND METHODS
The main materials were: PPG-5-20-Ceteth (Procetyl®, CRODA, Brazil), Oleth 10 (Brij O® 10, Sigma - Aldrich, USA), oleic acid (Synth, Brazil), isopropyl myristate (Synth, Brazil) and ultrapure water (Milli-Q)
Ternary phase diagrams
The ternary phase diagrams were constructed in the form of an equilateral triangle, lines parallel to
each side representing concentrations of one of the components, at 10% intervals, up to 100% at the opposing vertex. Each point thus corresponds to a mixture of particular concentrations of surfactant, oil and water. The formulations were prepared by first mixing the components (w/w) at a temperature of 25 °C ± 2 °C, stirred by a vortex mixer and then centrifuged. Formulations leading to homogeneous mixtures and those with evidence of phase separation were stored at room temperature for one week and analyzed. The components of the systems in the four phase diagrams are shown in Table I.
Physicochemical characterization of the formulations
With the aim of understanding the behavior of the surfactant molecules, while varying the type of oil and the amount of water, formulations within each of the four diagrams were analyzed, in which the content of oil was
ixed at 10% and the surfactant and the water contents
were varied (Table II).
Polarized light microscopy
A small number of formulations (F1-F12 in Table II) were placed between a cover slip and a glass slide and examined under polarized light. An Optical Leica Leitz DM RXE Microscope, equipped with a Moticam 2000 image capture system, was used to analyze various
ields of each sample at room temperature. The isotropic
or anisotropic behavior of each sample was observed.
Photomicrographs were taken at 200 x magniication.
Small-angle X-ray scattering (SAXS)
The structural features of formulations listed in Table II were analyzed by SAXS measurements. Data were collected at the National Laboratory of Synchrotron Light (LNLS, Campinas, Brazil) at the SAXS1 beam line, equipped with a monochromator (λ = 1.488 Å). An X-ray detector in a vertical position and a multichannel analyzer were used to capture the intensity of the SAXS
TABLE I - Compositions of the phase diagrams
Diagram Surfactant Phase Oil Aqueous
D 1 PPG - 5 - Ceteth - 20 Oleic acid Water
D 2 PPG - 5 - Ceteth - 20 Isopropyl myristate Water
D 3 Oleth 10 Oleic acid Water
TABLE II - Formulations in which the proportion of the oil is ixed at 10% and the ratio of surfactant / water is varied
D1 F1 F2 F3 D2 F4 F5 F6
PPG-5-Ceteth-20 % 80 70 60 PPG-5-Ceteth-20 % 80 70 60
Oleic acid % 10 10 10 Isopropyl myristate % 10 10 10
Water % 10 20 30 Water % 10 20 30
D3 F7 F8 F9 D4 F10 F11 F12
Oleth 10 % 80 70 60 Oleth 10 % 80 70 60
Oleic acid % 10 10 10 Isopropyl myristate % 10 10 10
Water % 10 20 30 Water % 10 20 30
measurements, I(q), as a function of the scattering vector,
q. Data were normalized with respect to the beam decay, detector sensitivity and sample transmission. The parasitic scattering intensity (of the cell window and air) was subtracted from the total scattering intensity. This setup allowed the scattering vector, q, to be varied between approximately 0.1 and 2.3 Å-1.
RESULTS AND DISCUSSION
Ternary phase diagrams
The regions found in the phase diagrams were irstly
divided, by a visual assessment of the corresponding formulations, into translucent and opaque systems. Subsequently, these regions were reclassified in terms of viscosity. This was done by observing the meniscus in a test tube containing the formulation, after inclining it at 90°. In this test, the fluid velocity along the wall of the tube is noted: low-viscosity formulations show fast and continuous flow, similar to that of propylene glycol, while intermediate-viscosity formulations exhibit
slow low along the tube, as a viscous liquid, and high-viscosity formulations show practically no low along the
tube, like a gel. The regions in the diagrams were thus
classiied as translucent low-viscosity systems (TLVS),
translucent intermediate-viscosity systems (TIVS) and translucent high-viscosity systems (THVS). Systems with intermediate viscosity and a milky appearance were denominated intermediate-viscosity emulsion systems (IVES). Opaque systems with high-viscosity were
classiied as opaque high-viscosity systems (OHVS) and
systems with phase separation as (PS).
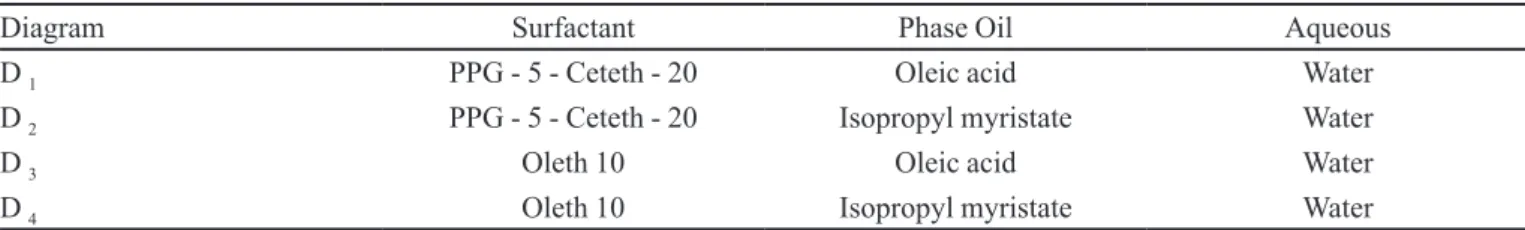
The results show that the diagrams formed by PPG-5-Ceteth-20, regardless of the oil phase, showed homogeneous systems with very different levels of organization, over a wide range of combination of components. Figure 1 shows diagram D1 (PPG-5-Ceteth-20, oleic acid and water). The TLVS region was
obtained at a low water (10 to 20%), medium oil (10% to 50%) and high surfactant (80% to 40%) content. It was observed that when the water content was increased (20 to 40%) and the surfactant remained between 50 and 60%, the region of TLVS was converted to a more viscous region of organized systems (TIVS). At intermediate contents of the oil component (40 to 60%), when the surfactant was 30% and the water in small amounts, emulsion systems were formed. At high concentrations of water or oil phase, the low surfactant concentration promoted phase separation.
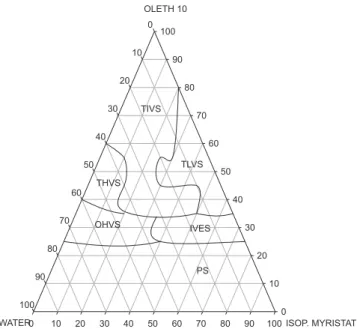
Figure 2 shows the diagram D2 (PPG-5-Ceteth-20, isopropyl myristate and water). In this diagram, some peculiarities were seen on increasing the volume of water. At concentrations about of 40% water, the formation of high-viscosity systems, mainly opaque (OHVS), was
FIGURE 1 – Ternary phase diagram D1 (PPG-5-Ceteth-20/Oleic
acid/water): (TLVS) Translucent low-viscosity system; (TIVS) Translucent intermediate-viscosity system; (THVS) Translucent high-viscosity system; (IVES) Intermediate-viscosity emulsion system and (PS) Phase separation.
WATER0 10 20 30 40 50 60 70 80 90 100
PPG - 5 - CETETH -20
0 10 20 30 40 50 60 70 80 90 100
OLEIC ACID 0
10
20
30
40
50
60
70
80
90
100
TLVS
TIVS
PS THVS
observed. This contrasts with diagram D1, where the use of oleic acid facilitated the formation of a large region of TIVS and THVS, these systems showing organized structures
and nanoscale sizes, relected in their translucence. This
effect was probably due to the oleic acid having the end group –COOH. Thus, it tends to act as a co-surfactant and cooperates in reducing interfacial tension, unlike isopropyl myristate, which has a nonpolar end group, -CH3 (Wang et al., 2006). The ability of surfactants to reduce the interfacial tension between oil and water allows translucent systems to form, based on structures smaller than a quarter of the wavelength of visible light, which do not scatter it (Garti, Aserin, 1996). The use of isopropyl myristate did not lead to the formation of emulsion systems. Phase separation again occurred at high concentrations of the oil and water or low concentrations of surfactant.
Other studies have also reported the potential of the components PPG5-Ceteth-20/oleic acid and PPG-5-Ceteth-20/isopropyl myristate to form nanostructured systems. Those studies referred to the importance of increasing the water content to raise the level of organization and viscosity of these systems, an effect exploited particularly in the development of precursors of liquid crystalline phases for potential nasal administration of zidovudine and administration of propolis in periodontal pockets (Bruschi et al., 2008; Carvalho et al., 2010).
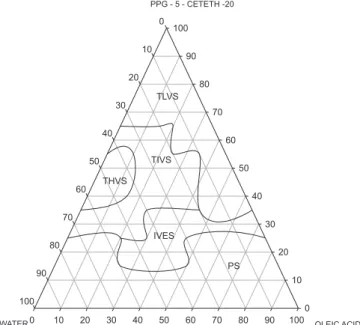
Diagrams D3 and D4 show that the surfactant Oleth 10, regardless of the oil used, also produced homogeneous
systems with very different levels of organization over a wide range of compositions. Figure 3 shows diagram D3 (Oleth 10, oleic acid and water). The TLVS region was obtained at low water (10 to 20%), medium oil (20 to 50%) and high surfactant (70 to 40%) concentrations. Differently from the diagrams obtained with PPG-5-Ceteth-20, Oleth 10 at high concentrations (between 80 and 70%) and low concentrations of water (10 to 20%) was able to form a larger TIVS region, this characteristic being related to the critical micellar concentration (CMC) of the surfactant, which is reached in these proportions, though it can be seen that the level of system organization still depended on increasing the water content (a feature
that will be conirmed by SAXS curves). The combination
of surfactant at intermediate concentrations (around 30%) and the oily component between 40 and 60% favored the formation of emulsion systems. Phase separation occurred at low concentrations of surfactant.
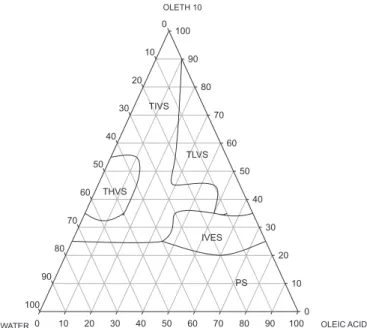
Figure 4 shows diagram D4 (Oleth 10, isopropyl myristate and water). In contrast to PPG-5-Ceteth-20, Oleth 10 led to the formation of an extended region of translucent and organized structures. This difference may be due to Oleth 10 possessing fewer ethylene oxide units than PPG-5-Ceteth-20, which represents a smaller amount of oxygen in the Oleth 10 molecule, thus reducing the number of possible hydrogen bonds with the water present in the formulation. Thus, surfactants with a higher
0 10 20 30 40 50 60 70 80 90 100 0 10 20 30 40 50 60 70 80 90 100 0 10 20 30 40 50 60 70 80 90 100
PPG - 5 - CETETH - 20
ISOP. MYRISTATE WATER TLVS PS THVS OHVS TIVS
FIGURE 2 – Ternary phase diagram D2 (PPG-5-Ceteth-20/
isopropyl myristate/water): (TLVS) Translucent low-viscosity system; (TIVS) Translucent intermediate-viscosity system; (THVS) Translucent high-viscosity system; (OHVS) Opaque high-viscosity systems and (PS) Phase separation.
WATER0 10 20 30 40 50 60 70 80 90 100
OLETH 10 0 10 20 30 40 50 60 70 80 90 100 OLEIC ACID 0 10 20 30 40 50 60 70 80 90 100 TLVS IVES PS TIVS THVS .
FIGURE 3 – Ternary phase diagram D3 (Oleth 10/oleic acid/
ISOP. MYRISTATE 0 10 20 30 40 50 60 70 80 90 100
OLETH 10
0 10 20 30 40 50 60 70 80 90 100
WATER
0
10
20
30
40
50
60
70
80
90
100
TIVS
OHVS THVS
PS TLVS
IVES
FIGURE 4 – Ternary phase diagram D4 (Oleth 10/isopropyl
myristate/water): (TLVS) Translucent low-viscosity system; (TIVS) Translucent intermediate-viscosity system; (THVS) Translucent viscosity system; (OHVS) Opaque high-viscosity systems; (IVES) Intermediate-high-viscosity emulsion system and (PS) Phase separation.
degree of ethoxylation show a lower capacity to reduce the interfacial tension, because the bonding between the oxygen atoms of the surfactant and the hydrogen of water hinder their mobility toward the surface of oil droplets, providing less translucentsystems(Neto et al., 2009). The region of TLVS was again obtained at low water (10 to 20%), medium oil (20 to 50%) and high surfactant (70 to 40%) concentrations. Diagram D4 features a small region of high-viscosity opaque systems (OHVS), at concentrations of water above 40%. By comparison with the other three diagrams, it appears that oleic acid extended the TIVS region. The formation of emulsion systems was seen at intermediate concentrations of the oil component (40 to 60%). Phase separation again occurred at low concentrations of surfactant.
Some other studies have also investigated the formation of nanostructured systems by mixtures of Oleth 10 with the oil phases: isopropyl myristate and oleic acid. These studies assessed in detail the nanostructures obtained, by means of rheological and SAXS analyses (Wang et al., 2005; Wang et al., 2006). However, they did not investigate the changes that occur in these systems as the water content is increased, or the effects of using surfactants with varying degrees of ethoxylation, a characteristic described earlier that interferes directly in the structure of these systems and, consequently, in the
diffusion and release of drugs incorporated in them.
Physicochemical characterization of the formulations
Polarized light microscopy
F i g u r e s 5 t o 7 s h o w p h o t o m i c r o g r a p h s o f formulations, which have a fixed proportion of the oil (10%), but varying amounts of surfactant and water. The composition of each formulation is shown in Table II. The formulations containing 80 to 70% surfactant and 10 to 20% water (F1, F2 of diagram D1 and F4 and F5 of
diagram D2) showed isotropic behavior (dark ield), as in
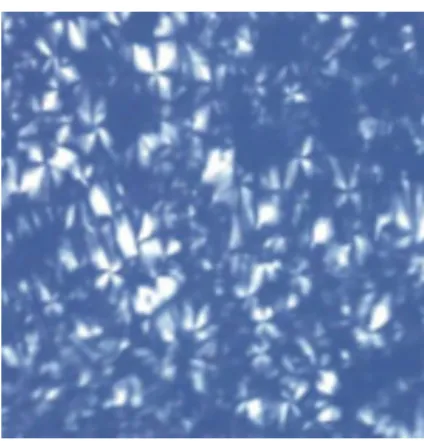
Figure 5, where the sample has only one refractive index in all directions, suggesting the formation of microemulsion systems. In diagram D1, as the concentration of water was raised to 30% and the surfactant fell to 60% (F3), the system became anisotropic, causing a deviation in the plane of polarized light (birefringence), revealed by the appearance of “maltese crosses” in the micrograph, which characterize a lamellar liquid crystalline phase (Figure 6). On the other hand, when the water was increased to 30% (F6) in diagram D2, there was a structural change in the system, making it more ordered and viscous, so that the anisotropy of the sample showed a hexagonal liquid crystal phase (Figure 7).
The formulations containing Oleth 10 (diagrams D3 and D4) at a high surfactant concentration (80%) and low water (10%) (F7 and F10) also caused a deviation in the plane of polarized light, resulting in the appearance of maltese crosses, as seen in Figure 6. Samples of F8 and F9 of the oleic acid diagram (D3) and F11 and F12 of the isopropyl myristate diagram (D4) also anisotropic behavior of the lamellar phase (maltese crosses).
Small-angle X-ray scattering (SAXS)
Figures 8-11 show the curves of scattering intensity I (q) as a function of the scattering vector (q). In the SAXS curves of formulations F1, F2, F4 and F5 (diagrams D1 and D2), there was a broad peak characteristic of microemulsions (Beaucage et al., 1995). For formulation F3 (diagram D1), the increase in water content to 30% and decrease in the surfactant to 60% led to a great shift in the position (qmax) of the peak intensity to lower q, indicating a greater distance between the scattering objects. It is possible to calculate this distance from the peak position (qmax), as d = 2π / qmax. A second peak can be seen at double
the q of the irst. The ratio between the two distances, d1/
d2 = 2 demonstrates a periodicity equivalent to a lamellar liquid crystalline phase, confirmed by the presence of “maltese crosses” in the polarized light micrograph. Formulation F6 (diagram D2), with the same increase in water content (30%), showed a smaller distance between
the scattering objects (more highly organized system) and
the ratios d1/d2 = 1.73 and d1/d3 = 2, a periodicity speciic
to a hexagonal liquid crystalline phase, which caused the streaks seen under polarized light microscopy in Figure 7.
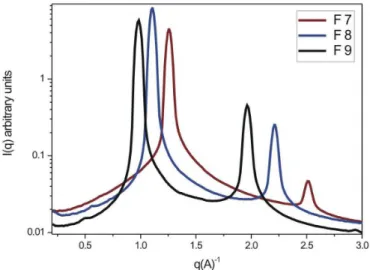
The formulations with high concentrations of Oleth 10 (80 to 70%) and low water concentrations (10 to 20%) (F7, F8, F10 and F11), produced SAXS curves with periodicity specifying a lamellar liquid crystalline phase. This effect on the organization of the formulations caused by high concentrations of this surfactant, in contrast to PPG-5-Ceteth-20, probably depends on its CMC, which enables the formation of micellar aggregates that are organized into ordered structures, with definite peaks.
Formulations F9 and F12 also showed deinite peaks and,
by the ratio d1/d2 = 2, showed a lamellar phase.
The SAXS analysis, besides identifying the nanostructures, also provides further information on the levels of organization of liquid crystalline arrangements. In the SAXS curves, it was observed that the peaks became narrower in formulations in which the proportion of water was raised. Thus, the increase in water afforded the thickening of the structure in these systems. This effect is probably related to the hydrophobic portion of the surfactant, which protects itself from the extra water, thus increasing its level of packaging. This consequently makes the distance between the scattering objects wider,
providing narrower and well-deined peaks.
According to Drummond and Fong (2000), the
release proile from a nanostructured system is inluenced
by characteristics of the drug, such as diffusion, solubility
and partition coeficient, and physicochemical properties FIGURE 6 – Representative photomicrograph of the formulation
containing 60% surfactant, 30% water and 10% oil, present in diagram (D1). Magniied 20 X.
FIGURE 7 – Representative photomicrograph of the formulation containing 60% surfactant, 30% water and 10% oil, present in diagram (D2). Magniied 20 X.
FIGURE 9 – SAXS profiles of systems stabilized by 80, 70 and 60% (PPG-5-Ceteth-20); 10, 20 and 30% (water) and 10% (isopropyl myristate).
FIGURE 10 – SAXS proiles of systems stabilized by 80, 70 and
60% (Oleth 10); 10, 20 and 30% (water) and 10% (oleic acid).
FIGURE 11 – SAXS proiles of systems stabilized by 80, 70 and
60% (Oleth 10); 10, 20 and 30% (water) and 10% (isopropyl myristate).
of the system, such as the nature and proportion of the components. Thus, Brinon et al. (1998) studied a study
about the inluence of surfactants with differing degrees of
lipophilicity on the diffusion and permeation of substances carried in liquid crystal systems. Specifically, they reported the effects of distinct liquid crystal arrangements on the diffusion and permeation of two compounds used as sunscreens, benzophenone-4 and 2- ethylhexyl methoxycinnamate, which have quite distinct solubility properties. They found that the systems formed by a lipophilic surfactant allowed faster diffusion of the lipid sunscreen (2- ethylhexyl methoxycinnamate) while the hydrophilic surfactant promoted faster diffusion of the hydrophilic sunscreen (benzophenone-4).
The entire set of results obtained in our study, from the creation of nanostructured systems until the structural characterization revealed the importance of the various components of the diagrams, as the concentration of each. By researching the organization levels of nanostructured systems, it is possible establishing parameters to understand the complex relationship between the composition and structure of these systems, with the diffusion and release of different kind of drugs.
CONCLUSION
the process of diffusion and release of these drugs.
ACKNOWLEDGMENT
We thank FAPESP and CNPq for the financial support and the National Laboratory of Synchrotron Light (LNLS, Campinas, Brazil) for the SAXS analysis.
REFERENCES
AGATONOVIC-KUSTRIN, S.; GLASS, B.D.; WISCH, M.H.; ALANY, G.G. Prediction of a stable microemulsion formulation for the oral delivery of a combination of antitubercular drugs using a methodology. Pharm. Res., v.20, p.1760-1765, 2003.
B E A U C A G E , G . ; U L I B A R R I , T. A . ; B L A C K , E . P. ; SCHAEFER, D.W. Multiple size scale structures im silica- siloxone composites studied by small – angle scattering. In: MARK J.E.; LEE C.Y.-C.; BIANCONI, P.A. Hybrid Organic–Inorganic Composites. Washington: American Chemical Society, 1995.Chap.9.
BOONME, P.; KRAUEL, K.; GRAF, A.; RADES, T.; JUYAPRASERT, V.B. Characterization of microemulsion structures in the pseudoternary phase diagram of palmitato de isopropila/water/brij 97: 1-butanol. AAPS Pharm. Sci. Tech., v.7, p.E1-E6, 2006.
BRINON, L.; GEIGER, S.; VALÉRIE, A.; DOUCET, J.; TRANCHANT, J.P.; COVARRAZE, G. Percutaneous absorption of sunscreens from liquid crystalline phases. J. Control. Release, v.60, p.67-76, 1999.
BRUSCHI, M.L.; FREIRAS, O.; LARA, E.H.; PANZERI, H.; GREMIÃO, M.P.; JONES, D.S. Precursor system of liquid crystalline phase containing propolis microparticles for the treatment of periodontal disease: Development and characterization. Drug Dev. Ind. Pharm., v.34. p.267-278, 2008.
CARVALHO, F.C.; SARMENTO, V.H.V.; CHIAVACCI, L.A.; BARBI, M.S.; GREMIÃO, M.P.D. Development and in vitro evaluation of surfactant systems for controlled release of zidovudine. J. Pharm. Sci., v.99, p.2367-2374, 2010.
CORRÊA, M.A.; SCARPA, M.V.; FRANZINI, M.C.; OLIVEIRA, A.G. On the incorporation of the non-steroidal anti-inflammatory naproxen into cationic o/w microemulsions. Colloids Surf. B Biointerfaces, v.43, p.198-114, 2005.
DRUMMOND, C.J.; FONG, C. Surfactant self-assembly objects as novel drug delivery vehicles. Curr. Opin. Colloid. Interface Sci., v.4, p.449-456, 2000.
HADIRY, G.N.; IBRAHIM, H.K.; MOHAMED, M.I.; EL-MILLIGI, M.F. Microemulsions as vehicles for topical administration of voriconazole: formulation and in vitro evaluation. Drug Dev. Ind. Pharm., v.38, p.64-72, 2012.
GARTI, N.; ASERIN, A. Pharmaceutical emulsions, double emulsion and microemulsion. In:____ Drug and the pharmaceutical science. New York: Marcel Dekker, 1996. p.412-519.
GARTI, N.; YAGHMUR, A.; ASERIN, A.; SPERNATH, A.; ELFAKESS, R.; EZRAHI, S. Solubilization of active molecules in microemulsions for improved environmental protection. Colloids and Surfaces A: Physicochem. Eng. Aspects, v.230, p.183-190, 2004.
GHOSH, S. Comparative studies on brij reverse micelles prepared in benzene/surfactant/ethylammonium nitrate systems: effect of head group size and polarity of the hydrocarbon chain. J. Colloid Interface Sci., v.360. p.672-680, 2011.
KREILGAARD, M. Inluence of microemulsions on cutaneous drug delivery. Adv. Drug Del. Rev., v.54, n.1, p.77-98, 2002.
MORENO, M.A.; BALLESTEROS, M.P.; FRUTOS, P. Lecithin-based oil-in-water microemulsions for parenteral use: Pseudoternary phase diagrams, characterization and toxicity studies. J. Pharm. Sci., v.92, p.1428-1437, 2003.
NETO, E.T.; MALTA, M.M.; SANTOS, R.G. Surface tension measurement by drop counting method: Method description and experiments with etoxilated non-ionic surfactants. Quím. Nova, v.32, p.223-227, 2009.
OLIVEIRA, A.G. Microemulsões e fases líquidas cristalinas como sistema de liberação de fármacos. Rev. Bras. Ciênc. Farm., v.41, p.301-313, 2005.
PODLOGAR, F.; ROGAC, M.B.; GAGPERLIN, M. The effect of internal structure of selected water-tween 40/ Imwitor308-isopropyl myristate microemulsions as delivery systems for ketoprofen: small-angle X-ray scattering study. Int. J. Pharm., v.302, p.68-77, 2005.
TRI-HUNG, N.; HANLEY T.; PORTER, C.J.H.; BOYD, B.J. Nanostructured liquid crystalline particles provide long duration sustained-release effect for a poorly water soluble drug after oral administration. J. Control. Release, v.153, p.180-196, 2011.
TROTTA, M. Inluence of phase transformation on indomethacin release from microemulsions. J. Control. Release, v.60, p.399-405, 1999.
VALENTA, C.; SCHULTZ, K. Influence of carrageenan on the rheology and skin permeation of microemulsion formulations. J. Control. Release, v.95, p.257-265, 2004.
WANG, Z.N.; LIU, F.; GAO, Y.; ZHUANG, W.C.; XU, L.M.; HAN, B.X.; LI, G.Z.; ZHANG, G.Y. Hexagonal liquid crystalline phases formed in ternary systems of Brij 97-water-lonic liquids. Langmuir, v.21, p.4931-4937, 2005.
WANG, Z.; DIAO, Z.; LIU, F.; LI, G.; ZHANG, G. Microstructure and rheological properties of liquid crystallines formed in brij 97/water/ipm system. J. Colloid Interface Sci., v.297, p.813-818, 2006.
Received for publication on 05th December 2013