As dogs are good models for in vivo studies, it is interesting to evaluate the behavior of canine gingival fibroblasts (CGF) in vitro, so that these cells could be seeded on a matrix and later studied in vivo. The aim of this study was to perform a morphological, functional and biochemical analysis of CGF, comparing it with human gingival fibroblasts (HGF), as well as to evaluate the change of their characteristics over several passages. Using gingival fibroblasts from 3 dogs and 3 humans in the subculture (Sub), first (P1), third (P3), fifth (P5) and seventh (P7) passages, the following parameters were assessed: cell morphology, spreading, adhesion, viability and total protein content. The results showed no major differences between the passages in terms of morphology and spreading, and a tendency of greater adhesion and viability for HGF when compared with CGF. The total protein content was significantly higher for HGF. HGF exhibited greater functional and biochemical activity in vitro compared to CGF. Higher numbers at Sub were observed for both CGF and HGF in all evaluated parameters. The differences do not prevent the use of CGF for tissue engineering, but its use seems to be more appropriate in the subculture or first passage.
Morphological, Functional and
Biochemical Characterization of
C a n i n e G i n g i v a l F i b r o b l a s t s
Camila Bonvicino Pelegrini, Luciana Prado Maia, Sérgio Luís Scombatti de Souza, Mário Taba Jr, Daniela Bazan Palioto
Department of Traumatology and Bucomaxillofacial Surgery and Periodontology, Ribeirão Preto Dental School, USP - University of São Paulo, Ribeirão Preto, SP, Brazil
Correspondence: Profa. Dra. Daniela Bazan Palioto, Avenida do Café S/N, 14040-904 Ribeirão Preto, SP, Brasil. Tel: +55-16-3602-4135. e-mail: [email protected]
Key Words: fibroblasts, cell culture techniques, tissue engineering.
Introduction
Tissue engineering has been widely studied and its main objective is to obtain biological substitutes that improve, maintain or restore the function of damaged tissues and organs. Recent technological advances in tissue engineering suggest its application in several medical fields, including periodontology (1). The cell culture technique allows the study of the biological behavior of cells, considering the kinetics of cell proliferation and the biosynthesis of many components of the extracellular matrix (2).
The culture of fibroblasts is interesting for the development of a material to replace autogenous soft tissue, but it is necessary first a deep understanding of these cells. As part of a heterogeneous population of cells of mesenchymal origin, fibroblasts have a central role in the extracellular matrix remodeling. Under normal conditions, they are responsible for the production and maintenance of the connective tissue matrix (3),and are essential for gingival and periodontal health. When seeded, they can be used in esthetic and reconstructive surgery (4)to improve tissue repair in a variety of conditions.
The use of gingival fibroblast cultures in vitro is feasible due to the fact that these cells exhibit morphology and spatial distribution similar to the in vivo system (5). Moreover, as dogs are good models for in vivo studies, it is important to evaluate the behavior of canine gingival fibroblasts (CGF) in vitro, comparing them with human gingival fibroblasts (HGF), so that CGF could be further
seeded on a matrix and studied in vivo in animal studies. The aims of this study were to perform a morphological, functional and biochemical CGF analysis in vitro, by comparing these cells with HGF, and also to analyze the change of these characteristics over several passages.
Material and Methods
Cell Culture
129
Canine gingival fibroblasts characterization
Cells were cultivated for up to 21 days. The remaining cells were transferred to 75 cm2 flasks for the analysis of the next passages. The experiments were performed until the seventh passage.
Morphological Characterization
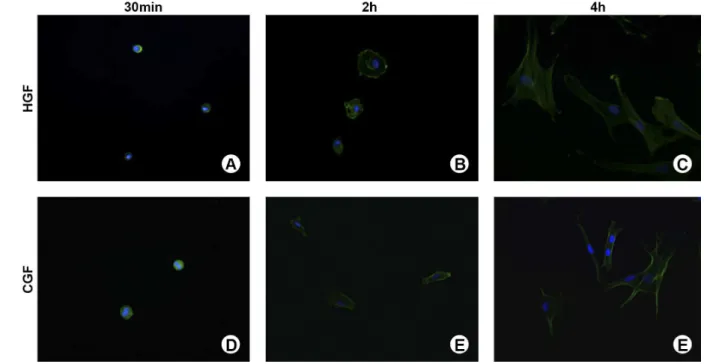
Cell morphology and stages of adhesion and spreading were assayed by direct fluorescence at 30 min, 4 and 24 h, as described by de Oliveira and Nanci (7). Briefly, cells seeded on glass coverslips were fixed using 4% paraformaldehyde in 0.1 M sodium phosphate buffer (PB), pH 7.2, for 10 min. Then, they were permeabilized with 0.5% Triton X-100 in PB for 10 min. Alexa fluor 488 (green fluorescence)-conjugated phalloidin (1:200) (Molecular Probes, Invitrogen, OR, USA), and 300 nM 4’,6-diamidino-2-phenylindole, dihydrochloride (DAPI, Molecular Probes) were used to detect respectively the actin cytoskeleton and cell nucleus. After being mounted with an anti-fade kit (Vectashield; Vector Laboratories, Burlingame, CA, USA), the samples were examined under epifluorescence using a Leica DMLB light microscope (Leica, Bensheim, Germany), with HCX PL Fluotar (x40/0.75) objectives, outfitted with a Leica CD 300F digital camera. The acquired digital images were processed with Adobe Photoshop software version 7.0 (Adobe Systems Inc., San Jose, CA, USA).
According to Rajaraman et al. (8), to assess the stage of adhesion and spreading, the proportion of cells at stage 1 (round cells), 2 (round cells with filopodia), 3 (cells with cytoplasmic webbing), and 4 (well flattened cells) was qualitatively analyzed.
Functional Characterization Cell Adhesion
Quantitative evaluation of cell adhesion was determined by hemocytometer at 30 min, 2 and 4 h. After each period, the culture medium was removed and the samples washed with phosphate buffered saline (PBS, Gibco) at 37° C to remove non-adherent cells. Then, cells were harvested, and the number of attached cells was determined using a hemocytometer (Hausser Scientific, Horsham, PA, USA) in a phase inverted microscope (Zeiss, Jena, Germany). Cell adhesion was expressed as a percentage of the initial cell number.
Total Cell Number
The total cell number was determined by hemocytometer at days 3, 7 and 10. The cells were enzymatically detached from polystyrene using 1 mL of 0.05% trypsin/EDTA (Gibco). The total number of cells/well was determined after Trypan blue (Sigma) staining using a hemocytometer (Hausser Scientific), as described for cell adhesion.
Cell Viability
Cell viability was evaluated by
3-[4,5-dimethylthiazol-2-yl]-2,5-diphenyl tetrazolium bromide (MTT) (Sigma-Aldrich) assay at days 3, 7 and 10. Cells were incubated with 10% MTT (5 mg/mL) in culture medium at 37 ºC for 4 h. The medium was then aspirated from the well, and 1 ml of acid isopropanol (0.04 N HCl in isopropanol) was added to each well. The plates were then stirred on a plate shaker for 5 min, and 200 µL of this solution was transferred to a 96-well plate (Fisher Scientific, Pittsburgh, PA, USA). The optical density was read at 570 nm on the plate reader (µQuant; Bio-Tek Instruments Inc., Winooski, VT, USA) and data were expressed as absorbance.
Biochemical Characterization
The total protein content was determined by a modification of the Lowry method (9) at days 7, 14 and 21. Briefly, proteins were extracted from each well with 0.1% sodium lauryl sulphate (Sigma) for 30 min and mixed 1:1 with Lowry solution (Sigma) for 20 min at room temperature. The extract was diluted in Folin and Ciocalteau’s phenol reagent (Sigma) for 30 min at room temperature. Absorbance was measured at 680 nm using a spectrophotometer (Cecil CE3021, Cambridge, UK). The total protein content was calculated from a standard curve and expressed as micrograms of protein per mililiter (µg/mL).
Statistical Analysis
Data presented in this study are the mean of the results of three sets of cultures for HGF and CGF, established from three different patients and dogs, respectively. All the experiments were carried out in quintuplicate (n=5). Comparisons were performed using the nonparametric Mann-Whitney U test, for independent samples, when comparing two groups, and Kruskal-Wallis, when comparing three or more independent groups, followed by Dunn’s Method for multiple comparisons between two groups (significance level: 5%).
Results
HGF and CGF proliferated in parallel orientation, respecting the space between cell membranes. Under conditions of cell confluence, there was no stacking, disruption or cell death. The cells exhibited a fusiform shape with a central nucleus and typical cytoplasmic processes, which are typical morphological features of this cell type. HGF presented a higher speed to achieve cell confluence in the flasks.
C
.B
. P
elegrini et al.
of spreading (Fig. 1C and 1F). No differences were observed between passages in cell morphology and stages of cell adhesion and spreading. Comparing HGF and CGF, it was noted that HGF were apparently a little more spread and with a higher diameter at 24 h (Fig. 1C and 1F).
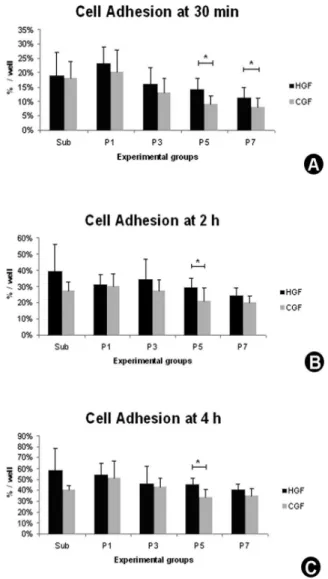
Count with the hemocytometer showed a statistically significant increase in HGF and CGF adhesion over the experimental periods in all the evaluated passages (p>0.001) and a decrease of cell adhesion in advanced passages, when
compared with the subculture and initial passages (HGF - 30 min: p<0.001, 2 and 4 h: p=0.007; CGF – 10 min and 4h: p<0.001, 2 h: p=0.004) (Table 1, Fig. 2). A higher percentage of cell adhesion for HGF, compared to CGF, was observed in advanced passages, with statistically significant difference in P5 (p<0.001) and P7 (p=0.020) at 30 min (Fig. 2A), and in P5 at 2h (p=0.011) (Fig. 2B) and 4h (p<0.001) (Fig. 2C).
For the total cell number, a statistically significant increase was observed for both cell types over the
Table 1. Quantitative analysis (mean ± SD) of cell adhesion (%) of HGF and CGF at 30 min, 2 and 4 h
Passage
HGF CGF
30 min 2 h 4 h Intragroup
Difference 30 min 2 h 4 h
Intragroup Difference
Sub 19 ± 8 abA 39 ± 17 aB 58 ± 21 aB p<0.001 18 ± 6 aA 27 ± 6 abA 40 ± 4 adB p<0.001
P1 23 ± 6 aA 31 ± 6 abA 54 ± 11 aB p<0.001 20 ± 8 aA 30 ± 8 aA 51 ± 16 aB p<0.001
P3 16 ± 6 abcA 34 ± 13 abB 46 ± 16 abB p<0.001 13 ± 5 abA 27 ± 7 abA 43 ± 8 acB p<0.001
P5 14 ± 4 bdA 29 ± 6 abB 45 ± 6 abC p<0.001 9 ± 3 bA 21 ± 8 abB 33 ± 8 bdB p<0.001
P7 11 ± 4 cdA 24 ± 5 bB 40 ± 6 bC p<0.001 8 ± 3 bA 20 ± 4 bB 35 ± 7 cdC p<0.001
Intergroup
difference p<0.001 p=0.007 p=0.007 p<0.001 p=0.004 p<0.001
HGF: Human gingival fibroblasts. CGF: Canine gingival fibroblasts. Kruskal-Wallis one-way analysis of variance on ranks. Dunn’s Method, significance level of 5%. Between-groups (a, b, c, d) and intragroup (A, B, C) comparisons - different letters indicate statistically significant difference.
131
Canine gingival fibroblasts characterization
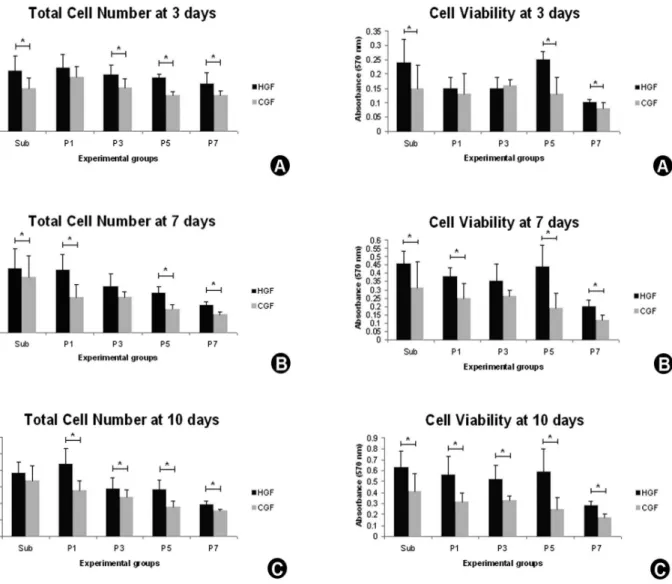
experimental periods (p<0.001), and it was significantly higher in the subculture and initial passages for HGF and CGF (HGF - day 3: p=0.001, days 7 and 10: p<0.001; CGF - days 3, 7 and 10: p<0.001) (Table 2, Fig. 3). A higher total cell number was observed for HGF, when compared with CGF, with statistically significant difference in Sub (p=0.002), P3 (p=0.001), P5 (p<0.001) and P7 (p=0.005) at day 3 (Fig. 3A); Sub (p=0.028), P1 (p<0.001), P5 (p<0.001) and P7 (p<0.001) at day 7 (Fig. 3B); and P1 (p<0.001), P3 (p=0.029), P5 (p<0.001) and P7 (p<0.001) at day 10 (Fig. 3C).
MTT assay also showed a significant increase in cell viability over the experimental periods (p<0.001) for both cell types, CGF and HGF, and a significant decrease in cell viability in advanced passages (HGF - days 3, 7 and 10: p<0.001; CGF - day 3: p=0.004, days 7 and 10: p<0.001) (Table 3, Fig. 4). When comparing HGF and CGF, at day 3 it was observed a higher viability for HGF in Sub (p=0.011), P5 (p<0.001) and P7 (p=0.025) (Fig.4A); at day 7 in the Sub (p=0.021), P1 (p=0.001), P5 (p<0.001) and P7 (p<0.001) (Fig. 4B) and in all passages at day 10 (p<0.001) (Fig. 4C).
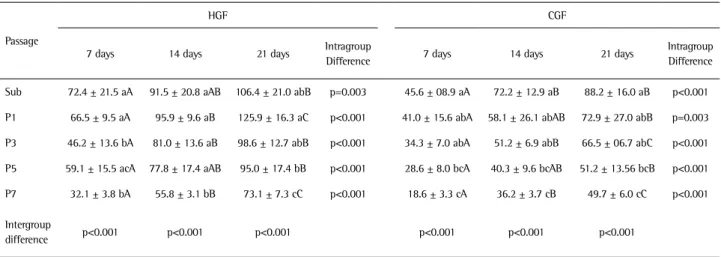
In all the passages and experimental periods evaluated, the total protein content was significantly higher for HGF than for CGF (day 7 - Sub: p=0.013, P1: p<0.001, P3: p=0.010, P5 and P7: p<0.001; day 14 - Sub: p=0.009, P1, P3, P5 and P7: p<0.001; day 21- Sub: p=0.018, P1, P3 P5 and P7: p<0.001) (Table 4, Fig. 5). For both cell types, HGF and CGF, a significant increase in the total protein content over the experimental periods was noted (HGF - Sub: p=0.003, P1, P3, P5 and P5: p<0.001; CGF - P1: p=0.003, Sub, P3, P5 and P7: p<0.001), while a significant decrease was observed along the passages (p<0.001) (Table 4, Figure 5).
Table 2. Quantitative analysis (mean ± SD) of total cell number (x104) of HGF and CGF at days 3, 7 and 10
Passage
HGF CGF
3 days 7 days 10 days Intragroup
Difference 3 days 7 days 10 days
Intragroup Difference Sub 15.1 ± 3.7 aA 61.0 ± 19.1 aB 76.0 ± 13.9 abB p<0.001 10,6 ± 2.7 abA 52.3 ± 21.1 aB 67.3 ± 18.1 aB p<0.001 P1 15.7 ± 3.6 aA 59.2 ± 15.3 aB 87.3 ± 19.4 aC p<0.001 13.5 ± 2.8 aA 33.4 ± 12.6 abB 55.2 ± 12.6 aB p<0.001 P3 14.0 ± 2.5 abA 43.3 ± 12.7 abB 57.1 ± 13.9 bB p<0.001 10.8 ± 2.3 abA 33.4 ± 5.5 aB 47.3 ± 8.9 aB p<0.001 P5 13.3 ± 1.1 abA 37.5 ± 6.3 bcB 56.3 ± 12.1 bC p<0.001 8.9 ± 1.1 bA 21.9 ± 4.9 bB 35.3 ± 8.1 bC p<0.001 P7 11.7 ± 2.9 bA 25.4 ± 3.5 cB 38.1 ± 4.1 cC p<0.001 8.8 ± 1.4 bA 16.7 ± 3.0 cB 30.7 ± 2.5 bC p<0.001 Intergroup
difference p=0.010 p<0.001 p<0.001 p<0.001 p<0.001 p<0.001
HGF: Human gingival fibroblasts. CGF: Canine gingival fibroblasts. Kruskal-Wallis one-way analysis of variance on ranks. Dunn’s Method, significance level of 5%. Intergroup (a, b, c, d) and intragroup (A, B, C) comparisons - different letters indicate statistically significant difference.
C.B
. P
elegrini et al.
Table 3. Quantitative analysis (mean ± SD) of cell viability (absorbance, 570 nm) of HGF and CGF at days 3, 7 and 10
Passage
HGF CGF
3 days 7 days 10 days Intragroup
difference 3days 7 days 10 days
Intragroup Difference
Sub 0.24 ± 0.08 abA 0.47 ± 0.75 aB 0.64 ± 0.15 aB p<0.001 0.15 ± 0.09 abA 0.32 ± 0.17 aB 0.41 ± 0.17 aB p<0.001
P1 0.15 ± 0.05 bcA 0.38 ± 0.06 aB 0.56 ± 0.17 aB p<0.001 0.13 ± 0.08 abA 0.25 ± 0.09 aAB 0.31 ± 0.08 aB p<0.001
P3 0.15 ± 0.05 cA 0.36 ± 0.12 aB 0.52 ± 0.14 aB p<0.001 0.16 ± 0.02 aA 0.26 ± 0.04 aB 0.33 ± 0.04 aB p<0.001
P5 0.25 ± 0.03 aA 0.45 ± 0.13 aB 0.59 ± 0.22 aB p<0.001 0.14 ± 0.06 abA 0.19 ± 0.09 abAB 0.25 ± 0.11 abB p<0.001
P7 0.10 ± 0.01 cA 0.21 ± 0.04 bB 0.29 ± 0.05 bB p<0.001 0.08 ± 0.02 bA 0.13 ± 0.03 bB 0.17 ± 0.04 bB p<0.001
Intergroup
difference p<0.001 p<0.001 p<0.001 p=0.004 p<0.001 p<0.001
HGF: Human gingival fibroblasts. CGF: Canine gingival fibroblasts. Kruskal-Wallis one-way analysis of variance on ranks. Dunn’s Method, significance level of 5%. Intergroup (a, b, c, d) and intragroup (A, B, C) comparisons - different letters indicate statistically significant difference.
Figure 3. Total cell number of human gingival fibroblasts (HGF) and canine gingival fibroblasts (CGF) in the subculture (Sub) and passages 1 (P1), 3(P3), 5 (P5) and 7 (P7) at days 3 (A), 7 (B) and 10 (C). Data are reported as mean ± standard deviation. Asterisks (*) indicate p<0.05.
133
Canine gingival fibroblasts characterization
Discussion
Tissue engineering comes into the research fields as a promising solution to repair and reconstruct lost tissues. In the last decades there have been great advances in this area, which led to its application in different medical fields, including periodontology. Some authors have been evaluating non-enzymatic methods of gingival fibroblasts isolation in vitro for the use in gingival augmentation (6,10-14). Gingival fibroblast culture in different matrices has been studied and has shown promising results in soft tissues regeneration (12-14). Fibroblasts are responsible for the normal growth of the organism and are essential in cases where tissue repairs are necessary, being one of the first cells to appear at injured sites. The current concept that both, gingival fibroblasts (15,16) and periodontal ligament fibroblasts (17-21), have the capacity to regenerate the periodontium has stimulated an interest in the development of clinical methods for the regularization of these cell types (6).
Cell transplantation in matrices has been explored as a way to create new human tissues (22). However, studies in animal models involving cell culture in a three-dimensional scaffold are necessary until this methodology is well established. In Dentistry, dogs have been used as a good model for in vivo studies. A cell-based therapy for oral tissues regeneration should use autogenous cells, because ingrowth of immunocompetent cells of the host organism might destroy allografts or xenografts (23). Therefore, to evaluate in vivo the efficiency of grafts obtained from three-dimensional cell culture techniques in dogs, it is important first to know how their cells behave in vitro, since they must be viable, have good spreading activity and maintain their ability to produce proteins in order to be successfully used in tissue engineering.
Table 4. Quantitative analysis (mean ± SD) of total protein content (µg/mL) of HGF and CGF at days 7, 14 and 21
Passage
HGF CGF
7 days 14 days 21 days Intragroup
Difference 7 days 14 days 21 days
Intragroup Difference
Sub 72.4 ± 21.5 aA 91.5 ± 20.8 aAB 106.4 ± 21.0 abB p=0.003 45.6 ± 08.9 aA 72.2 ± 12.9 aB 88.2 ± 16.0 aB p<0.001
P1 66.5 ± 9.5 aA 95.9 ± 9.6 aB 125.9 ± 16.3 aC p<0.001 41.0 ± 15.6 abA 58.1 ± 26.1 abAB 72.9 ± 27.0 abB p=0.003
P3 46.2 ± 13.6 bA 81.0 ± 13.6 aB 98.6 ± 12.7 abB p<0.001 34.3 ± 7.0 abA 51.2 ± 6.9 abB 66.5 ± 06.7 abC p<0.001
P5 59.1 ± 15.5 acA 77.8 ± 17.4 aAB 95.0 ± 17.4 bB p<0.001 28.6 ± 8.0 bcA 40.3 ± 9.6 bcAB 51.2 ± 13.56 bcB p<0.001
P7 32.1 ± 3.8 bA 55.8 ± 3.1 bB 73.1 ± 7.3 cC p<0.001 18.6 ± 3.3 cA 36.2 ± 3.7 cB 49.7 ± 6.0 cC p<0.001
Intergroup
difference p<0.001 p<0.001 p<0.001 p<0.001 p<0.001 p<0.001
HGF: Human gingival fibroblasts. CGF: Canine gingival fibroblasts. Kruskal-Wallis one-way analysis of variance on ranks. Dunn’s Method, significance level of 5%. Intergroup (a, b, c, d) and intragroup (A, B, C) comparisons - different letters indicate statistically significant difference.
C.B
. P
elegrini et al.
In the present study, CGF were evaluated in culture systems, considering their morphological, functional and biochemical characteristics, in comparison with HGF. Also, the change of these characteristics over several passages was analyzed. This is a relevant study, as it is the first one that evaluates and compares the characteristics of both HGF and CGF. The understanding of dog’s cells permits a safer application of these cells in three-dimensional systems, and their in vivo study. In confluence, CGF showed a tendency of lower cell adhesion, total cell number, viability and protein content when compared to HGF. Moreover, both cell types exhibited a decrease in these characteristics over the passages, without differences in cell morphology.
Both cell types, HGF and CGF, showed a good growth rate and proliferation in parallel orientation, respecting the space that must exist between the cell membranes, as shown by Martelli Jr. et al. (24). It was observed by direct fluorescence that HGF are larger in size and more elongated when compared with CGF, which explains the higher speed of HGF to achieve cell confluence in flasks. A decreased potential of cell growth over several passages was also noted, which is consistent with Palioto et al. (25), who observed a decrease in the growth rate of HGF and human periodontal ligament fibroblasts after successive passages. The authors (25) also observed that near to the fifteenth passage, the cultures do not progress as well as initially.
Although the results showed a tendency of higher cell adhesion for HGF, this difference was statistically significant only in some passages. On the other hand, significantly higher values of total cell number, cell viability and total protein content were noted for HGF. These results corroborate with those of a recent study (13), in which HGF showed higher cell viability than CGF when seeded on a three-dimensional scaffold.
In summary, the findings of the present study demonstrated that although HGF and CGF present similar morphological characteristics, HGF exhibit greater functional and biochemical activity in vitro. The differences between HGF and CGF do not prevent the use of CGF in culture studies; however its use seems to be more appropriate in the subculture or first passage, as there was a reduction in the performance of fibroblasts in both HGF and CGF after several passages.
Resumo
Como os cães são um bom modelo para estudos in vivo, é interessante avaliar o comportamento de fibroblastos gengivais de cão (CGF) in vitro, para que essas células possam ser cultivadas em uma matriz e estudadas
in vivo posteriormente. O objetivo do presente estudo foi realizar uma análise morfológica, funcional e bioquímica de CGF, comparando-os a fibroblastos gengivais humanos (HGF), bem como avaliar as alterações dessas características ao longo de várias passagens. Usando fibroblastos
gengivais de 3 cães e 3 indivíduos na subcultura (Sub), primeira (P1), terceira (P3), quinta (P5) e sétima (P7) passagens, os seguintes parâmetros foram avaliados: morfologia, espraiamento, adesão, viabilidade e conteúdo de proteína total. Os resultados mostraram não haver diferenças significativas quanto à morfologia e espraiamento, e uma tendência a maior adesão e viabilidade para HGF, quando comparados a CGF. O conteúdo de proteína total foi significativamente maior para HGF. HGF exibiram maior atividade funcional e bioquímica in vitro quando comparados a CGF. Maiores valores na Sub foram observados para ambos, CGF e HGF, em todos os parâmetros avaliados. As diferenças não impedem o uso de CGF na engenharia tecidual, contudo, seu uso é mais apropriado na subcultura ou primeira passagem.
Acknowledgements
The authors acknowledge the laboratory assistant Roger Rodrigo Fernandes, Ribeirão Preto Dental School, University of São Paulo, Ribeirão Preto, SP for his assistance with epifluorescence analyses. Dr. Pelegrini was granted with a scholarship from the National Council for Scientific and Technological Development, Brasília, DF, Brazil (CNPq). The authors report no financial relationships related.
References
1. Saczko J, Dominiak M, Kulbacka J, Chwilkowska A, Krawczykowska H. A simple and established method of tissue culture of human gingival fibroblasts for gingival augmentation. Folia Histochem Cytobiol 2008;46:117-119.
2. Keira SM, Ferreira LM, Gragnani A, Duarte IS, Santos IAN. Experimental model for Fibroblast culture. Acta Cir Bras 2004;19:11-16.
3. Biagini G, Checchi L, Pelliccioni GA, Solmi R. In vitro growth of
periodontal fibroblasts on treated cementum. Quintessence Int 1992;23:335-340.
4. Fimiani M, Pianigiani E, Cherubini F, Sbano P, Cuccia A, Pompella G, et al.. Other uses of homologous skin grafts and skin bank bioproducts. Clin Dermatol 2005;23:396-402.
5. Hillmannn G, Gebert A, Geurtsen W. Matrix expression and proliferation of primary gingival fibroblasts in a three-dimensional cell culture model. J Cell Sci 1999;112:2823-2832.
6. Somerman MJ, Archer SY, Imm GR, Foster RA. A comparative study of
human periodontal ligament cells and gingival fibroblasts in vitro. J
Dent Res 1988;67:66-70.
7. De Oliveira PT, Nanci A. Nanotexturing of titanium-based surfaces upregulates expression of bone sialoprotein and osteopontin by cultured osteogenic cells. Biomaterials 2004;25:403-413.
8. Rajaraman R, RoundsDE, Yen SPS, Rembaum A. A scanning electron
microscope study of cell adhesion and spreading in vitro. Exp Cell Res
1974;88:327-339.
9. Lowry OH, Rosebrough NJ, Farr AL, Randall RJ. Protein measurement with the Folin phenol reagent. J Biol Chem 1951;193:265-275. 10. Yamada K, Yamaura J, Katoh M, Hata K, Okuda K, Yoshie H. Fabrication
of cultured oral gingiva by tissue engineering techniques without materials of animal origin. J Periodontol 2006;77:672-677.
11. Novaes AB Jr, Marchesan JT, Macedo GO, Palioto DB. Effect of in vitro
gingival fibroblast seeding on the in vivo incorporation of acellular
dermal matrix allografts in dogs. J Periodontol 2007;78:296-303. 12. Jhaveri HM, Chavan MS, Tomar GB, Deshmukh VL, Wani MR, Miller PD
Jr. Acellular dermal matrix seeded with autologous gingival fibroblasts for the treatment of gingival recession: A proof-of-concept study. J Periodontol 2010;81:616-625.
13. Maia LP, Novaes AB Jr, Souza SLS, Grisi MFM, Taba Jr M, Palioto DB.
In vitro evaluation of acellular dermal matrix as a three-dimensional scaffold for gingival fibroblast seeding. J Periodontol 2011;82:293-301. 14. Rodrigues AZ, Oliveira PT, Novaes AB Jr, Maia LP, Souza SLS, Palioto DB.
Evaluation of in vitro human gingival fibroblast seeding on acellular
dermal matrix. Braz Dent J 2010;21:179-189.
15. Bowers GM, Schallhorn RG, Mellonig JT. Histologic evaluation of new attachment in human intrabony defects. A literature review. J Periodontol 1982;53:509-512.
135
Canine gingival fibroblasts characterization
gingival fibroblasts on demineralized or fibronectin-treated normal and diseased tooth roots. J Periodontol 1983;54:133-140.
17. Melcher AH. Repair of wounds in the periodontium of the rat. Influence of periodontal ligament on osteogenesis. Arch Oral Biol 1970;15:1183-1198.
18. Gould TR, Melcher AH, Brunette DM. Migration and division of progenitor cell populations in periodontal ligament after wounding. J Periodontal Res 1980;15:20-42.
19. Boyko GA, Melcher AH, Brunette DM. Formation of new periodontal
ligament by periodontal ligament cells implanted in vivo after culture
in vitro. A preliminary study of transplanted roots in the dog. J Periodontal Res 1981;16:73-88.
20. Nyman S, Lindhe J, Karring T and Rylander H. New attachment following surgical treatment of human periodontal disease. J Clin Periodontol 1982;9:290-296.
21. Isidor F, Karring T, Nyman S, Lindhe J. The Significance of coronal
growth of periodontal ligament tissue for new attachment formation. J Clin Periodontol 1986;13:145-150.
22. Vacanti JP, Langer R, Upton J, Marler JJ. Transplantation of cells in matrices for tissue regeneration. Adv Drug Deliv Rev 1998;33:165-182. 23. Glowaki J, Trepman E, Folkman J. Cell shape and phenotypic expression
in chondrocytes. Proc Soc Exp Biol Med 1983;172:93-97.
24. Martelli H Jr, Bolzani G, Graner E, Bozzo, Coletta RD. Microscopic and proliferative comparison of gingival fibroblasts from patients with normal gingiva and with hereditary gingival fibromatosis. Braz Dent J 2000;14:123-129.
25. Palioto DB, Coletta RD, Martelli Júnior H, Joly JC, Graner E, Lima AFM. Comparison between gingival and periodontal ligament fibroblasts from the same subject. Braz Dent J 2002;16:319-325.