Extraction of Line Features from Multifidus Muscle
of CT Scanned Images with Morphologic Filter
Together with Wavelet Multi Resolution Analysis
Kohei Arai
Dept.of Information Science, Graduate School of Science and
Engineering Saga University Saga city, Japan
Yuichiro Eguchi
Dept. of Internal Medicine, Medical Faculty
Saga University Saga city, Japan
Yoichiro Kitajima
Eguchi Hospital Ogi city, Japan
Abstract—A method for line feature extraction from multifidus muscle of Computer Tomography (CT) scanned image with morphologic filter together with wavelet based Multi Resolution Analysis (MRA) is proposed. The contour of the multifidus muscle can be extracted from hip CT image. The area of multifidus muscle is then estimated and is used for an index of belly fat because there is a high correlation between belly fat and multifidus muscle. When the area of the multifidus muscle was calculated from the CT image, the MRA with Daubechies base functions and with the parameter of MRA of level is three would appropriate. After the wavelet transformation is applied to the original hip CT image three times and LLL (3D low frequency components) is filled “0” then inverse wavelet transformation is applied for reconstruction. The proposed method is validated with four patients.
Keywords-multifidusmuscle; Computer Tomography; wavele; Multi Resulution Analysis; morphological filter.
I. INTRODUCTION
Nonalcoholic fatty liver diseases (NAFLD) are often associated with obesity, insulin resistance, and excessive visceral fat accumulation. The aims of this study were (1) to evaluate the relationship between the severity of fatty liver and visceral fat accumulation in nonalcoholic fatty liver diseases, and (2) to investigate the relationships of fatty liver with biochemical data and insulin resistance [1],[2].
It is effective to prevent the pain that receives the load and the stress easily by daily life, the movement, and labor, pierces, stimulates the multifidus muscle and the iliopsoas muscle of Toge muscle the peripheral nerve of congestion and a tumor, an inflammation, and a stripe film especially sidewise, and generates the sidewise Tsida muscle, interspinales muscles, and to strengthen the inner muscle such as the Tstoge muscles sidewise the tie of each one of the vertebra. Moreover, it is connected with improving the motor function of the entire spine to strengthen the multifidus muscle. Moreover, capacity and the line prime number of the multifidus muscle can give working hard and the standard when it is possible to use as an index of fat in high this and the correlation and celiac, and it recovers from Metaboriccshindororm based on this index.
Although a volume of the multifidus muscle can be estimated with X rays CT image of hip, methods for extraction of contour of the multifidus muscle from the hip CT images is needed. Although there are the conventional edge detection methods (differentiation methods) which can be used for it, it is not easy to extract the contour because image defects affect to the extractions. For instance, detected edges with differentiation used to be disconnected. There are some isolated pixels due to noise on the CT images. Also it is always true that undesired edges are extracted with differentiations. Therefore sophisticated contour extraction methods are necessary [3]-[9].
Because the high frequency component of the hip CT image shows edge components, wavelet based Multi-Resolution Analysis: MRA is proposed to extract the contour of multifidus muscle [10], [11]. Namely, wavelet transformation based on base function is applied to the hip CT image then the original hip CT image is divided into four frequency components, low frequency component for both horizontal and vertical directions (LL), high frequency in horizontal direction and low frequency in vertical direction of component (HL), low frequency in horizontal direction and high frequency in vertical direction of component (LH), and high frequency component for both horizontal and vertical direction (HH). Because MRA is equivalent to the filter bank, the desired edge with different frequency components can be extracted with the different “level” which corresponds to the center frequency of the band-pass filter which can be realized with MRA. Moreover, not only the contour of the multifidus muscle but also Semmot is extracted from the extracted edge. At this time, it was often divided into parts though Semmot was same originally Semmot, and it tended to overvalue the line prime number. To evade this, this paper proposes the Morphological analysis. That is, this validity has been improved by giving Dilation and Erosion to an appropriate frequency edge image and evaluating the line prime number. Through experiments of which the proposed method is applied to patient's CT image, the proposed method is validated.
images. Then, finally, conclusions and some discussions are also followed.
II. PROPOSED METHOD
A. Multifidus Muscle
The muscle that runs from "Horizontal projection" to one in on between "Thorn projections" of a high-ranking vertebra is called Tstoge muscle sidewise. When the Tstoge muscle is divided further sidewise which is divided into the musculi rotatores, multifidus muscle and half musculus spinalis. Half musculus spinalis extend to the vertebra from 5 to 6. The multifidus muscle extends to the vertebra from 3 to 4, and is located from half musculus spinalis to deep. Moreover, the musculi rotatores extends between one two vertebras, and is located in deep most. The multifidus muscle operates as musculus transversus abdominis shrink, processus spinosus are pulled, and it is rotated to the other side. There is a rotation movement such as turning the waist to turn around back. The former is steady, and the shrinkage of doing of inclination and musculus transversus abdominis is steady the sacrum inclining forward and the latter and increases the tension outside of the chest line of the backbone film, rises pressure in celiac, and after the sacrum, is steady of the lumbar vertebra the multifidus muscle and the iliococcygeus muscle and the coccygeal muscle. That is the position of the sacrum control.
In addition, musculus transversus abdominis increase the tension of-intestines ligament by synchronizing with the outer unit after the film of the chest line of the backbone, and contribute to the close power strengthening of the pelvic band. They are six keep abreast of movements along the rotation movements of six of the circumference of the XYZ axis of coordinate (moment) and the axis of coordinates. It is Tstoge muscle (musculi rotatores, half musculus spinalis, and multifidus muscle) sidewise erector muscle of spine (musculus spinalis, longest muscle, and iliocostal muscle), interspinales muscles, and the Tsida muscles sidewise that are called that being able to move this movement of 12 pieces freely like the mind is a peculiar line of the backbone. It is located in the depths in the muscle with short mileage, and it takes part in thinner movement. Fig. 1 shows the location of multifidus muscle.
Figure 1 Multifidus muscle
B. Hip CT Image and Edge Extractions
Fig. 2 shows the example of original hip CT image and the extracted edges by hip CT image with Laplasian operator. The edge extracted by the conventional differentiator or second order differentiators such as Sobel and Laplasian operators
tends to emphasize not only edges but also noises other than the desired edges as shown in Fig. 2.
(a) Original CT image (Closed area portion with red colored line shows multifidus muscle)
(b) Edge detected image with Laplasian operator
Figure 2 Original image and edge detected image with Laplasian operator.
C. Contour Extraction by WaveletMmulti Resolution Analysis (MRA)
Methods for extraction of contour line of multifidus muscle from the hip CT images by using wavelet based 2D and 3D MRA which are illustrated in Fig. 3 (a) and (b) are proposed. It is essential that the multifidus muscle is three dimensional objects so that the 3D MRA is much appropriate rather than the 2D MRA based method. Using the 2D or the 3D MRA, high frequency components which corresponds to the edges can be extracted. Furthermore, MRA allows reconstruction of original image without any loss.
(b) 3D wavelet transformation
(c) An example of edge detected image based on 2D Multi-Resolution Analysis: MRA
(d) An example of edge detected image based on 3D Multi-Resolution Analysis: MRA
Figure 3 2D and 3D wavelet transformation and an example of edge detected image based on 2D MRA
If the image is reconstructed with LH, HL, and HH components then edges can be extracted from the 2D of hip CT images. That is the same thing for the 3D MRA based edge detection. When the image is reconstructed without LLL components, then edges are extracted from the 3D of hip CT images. Fig. 3 (c) and (d) shows examples of the edges extracted with the 2D and the 3D MRA based edge detection methods. As the results, the 3D MRA based edge detection method allows many clear edges in comparison to that of the 2D MRA based method. In this case, the level (how many
which frequency components of edges is desired to extract), and base function of MRA is in concern.
D. Extraction of clear contour with binarization and morphological filtereing
After the reconstruction based on the 2D MRA based and the 3D MRA based methods, binarization with an appropriate threshold is applied to the reconstructed images. There are so many isolated pixels and disconnected contour lines in the binarized images. In order to remove the isolated pixels and connect the disconnected contour lines, morphological filter is applied to the binalized images. Fig. 4 shows the well-known morphological filter components.
Figure 4 Morphological filter
Fig. 5 also shows typical erosion and dilation of morphological filter. The dilation processing is applied first to the binarized images followed by the erosion processing. Then the disconnected contour lines in the binarized image are connected. Also the erosion processing is applied to the binarized image then isolated pixels are removed.
(a)Dilation
(b) Erosion
䠌
䠓
䠒
䠍
䠑
䠎
䠏
䠐
䠌
䠓
䠒
䠍
䠑
䠎
䠏
䠐
䠍
䠓
䠎
䠌
䠐
䠏
䠒
䠑
䠌
䠓
䠒
䠍
䠑
III. EXPERIEMNTS
A. Experimental conditions
The following four persons are tested,
Age: 72, 63, 59, 41
Height(cm)&Weight(kg): 164&71, 170&75, 160&76, 156&62
BMI: 26.21, 25.95, 29.69, 24.22
B. Cost Functions
The proposed index assumes it is possible to become the index of the function of the multifidus muscle, proposes the size of the multifidus muscle, and has aimed to give the risk such as Metaboriccshindororm and the standard of the recovery degree in the future. Therefore, the correlation with fat in celiac is index necessary and height is necessary.
It is Body Mass Index: BMI, an area of whole fat as a past index, and the area of the hypodermic fat, the area of the waist muscle, the area of the multifid muscle, and the CT worth ratio (ratio of the CT value of the multifidus muscle and the internal
organs fat), etc. are proposed as an index. R square value with fat in celiac is high, and the one that it is possible to extract it from hip CT image comparatively easily is selected from among these indices. BMI is division of the weight of the body in the square of the height, and it is possible to examine it extremely easily. If the ratio can worth identify the pixel, CT is comparatively easily computable it though requests from hip CT image besides. Because the area of the waist muscle and the area of the multifid muscle are only coefficients of the pixel, as long as the contour can be extracted, it is comparatively easily computable. Specific of the adipose cell is attended to paniculus adiposus and whole fat with the difficulty as well as fat in celiac. Therefore, the proposal index was evaluated by comparing the result of guessing these past indices by the specialist's judgment with the calculation result of the area of the multifid muscle based on MRA that was the proposal index as the correct answer in this paper. The relation to the index is shown as the judgment result of specialist who requested it from the CT image to 362 patients from 25 to 81 years old from Fig.6, that is, correct answer fat in celiac and so far.
Figure 6 Relations between belly fat and the other measured factors.
R square value is an area of whole fat, an area of the hypodermic fat, and it is 0.408, 0.045, 0.001, 0.178, 0.111, and the correlation with the area of whole fat understands and the highest thing is understood respectively of the CT worth area of the muscle (the ratio and the irresolute attitude of the area of the multifid muscle). However, it was judged that the area of the multifid muscle from which R square value was requested after this without the processing time comparatively lying high was an index of second best because a lot of time
and time lay to request this area as shown in the above-mentioned.
C. Base Function and the Level of MRA
(j) (k) (l)
(m) (n) (o)
Figure 7 Examples of edge detected images through reconstruction without LL component (2D MRA) and LLL (3D MRA) from 1 to 4 levels of the wavelet transformed images. (a), (b) and (c) are original CT images at the different height (portion). (d), (e) and (f) are edge detected images reconstructed without LL component. (g), (h) and (i) are edge detected images reconstructed without LLL component. Meanwhile, (j), (k), (l) shows the binarized images. On the other hand,
(m), (n), (o) shows the resultant images after the morphological filter.
Fig. 7 (a), (b), (c) shows hip CT original picture image in a different part. (d), (e) and (f) are edge detected images reconstructed without LL component. (g), (h) and (i) are edge detected images reconstructed without LLL component.
D. Effect of the Morphological Filter
Fig. 7 (j), (k), (l) shows the binarized images while Fig. 7 (m), (n), and (o) shows the resultant images after the morphological filtering is applied to the binarized and reconstructed images. It is easily seen that the contour of the multifidus muscle is extracted almost perfectly.
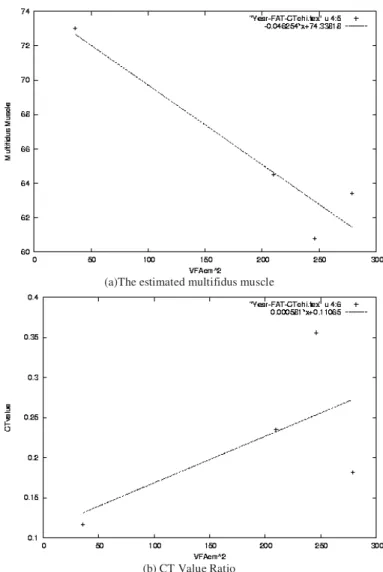
E. Relations Between the Estimated Multifidus Muscle Areas and the Belly Fat as well as CT Value Ratio and the Belly Fat
Multifidus muscle area can be estimated with the resultant images after the morphological filter. Although belly fat is used to be estimated with BMI in the simplest method and with the CT value ratio, it is usually said that estimation accuracy is not good enough. Meanwhile, the relation between multifidus muscle area which can be estimated with the proposed method is relatively high as shown in Fig. 8 (a) in comparison to the relation between visceral fat and CT value ratio as shown in Fig. 8 (b).
R square values for the relation between visceral fat and multifidus muscle as well as CT value ratio are 0.897, and 0.384, respectively. On the other hand, 3D MRA based edge extraction is much effective (R square value is 0.897) than that of 2D MRA based edge extraction (R square value is around 0.7). Due to the fact that isolated pixels are situated with a couple of pixels and the contour lines are disconnected with a couple of pixel distance so that twice erosions followed by twice dilation are the best conditions for morphological filtering. It is quite obvious that visceral fat is absolutely linked to the well known Metaboriccshindororm which is our major concern. The visceral fat, however, is not easy to estimate. Time consumable image processing is required in general. Turns out, the mutifidus muscle is not so difficult to estimate and is closely related to the Metaboriccshindororm so that we focused the multifidus muscles as an index of the Metaboriccshindororm.
IV. CONCLUSIONS
The multifidus muscle area estimation method based on MRA together with morphological filter is proposed. Through the experiments with four patients, it may conclude the followings,
(1) The 3D MRA based edge detection is superior to the 2D MRA based method. Both are superior to the conventional differentiation based edge detection methods.
(2) Daubechies base function is superior to the Haar base function in terms of edge detecting performance. In the case of edge detection from the hip CT image, level 2 of MRA parameter would be the best. This depends on the frequency component of desired edges.
(3) Morphological filter is effective to remove isolated pixels and to connect the detected disconnected contour line of multifidus muscle. In this case twice application of erosion followed by twice application of dilation seems to be the best in terms of connection of disconnected contour line of multifidus muscles.
(4) R square value of the relation between visceral fat and
the multifidus muscles area is over 0.8 (significant) so that the multifidus muscles are used for an index of Metaboriccshindororm.
Thus the patients of Metaboriccshindororm are encouraged using the proposed index of multifidus muscles which are relatively easy to estimate from the hip CT images.
(a)The estimated multifidus muscle
(b) CT Value Ratio
Figure 8 Relation among the belly fat and the estimated multifidus muscle as well as CT value ratio.
ACKNOWLEDGMENT
Authors express our gratitude for conducting the experiments by graduate school student Mr. Mitsuo Mochida that cooperates in the experiment.
REFERENCES
[1] Y. Eguchi, T. Eguchi, T.mizuta, Y.Ide, T. Yasutake, R.Iwakiri, A. Hisatomi, I.Ozaki, K. Yamamoto, Y. Kitajima, Y. Kawaguchi, S. Kuroki, N. Ono, Visceral fat accumulation and insulin resistance are important factorsin nonalcoholic fatty liver disease, J Gastroenterol 2006; 41:462– 469, 2006.
[3] CT performance evaluation committee, Standard concerning performance evaluation of X-ray computer tomography device (the second recommendation) and Japan Association of Medical Practitioners magazine and 88(8)759‐771, 1989.
[4] Technical committee X rays CT device performance evaluation and examination group, Standard concerning X rays CT device performance evaluation, Journal of Japanese Society of Radiological Technology 47(1)56‐63, 1991.
[5] K. Suzuki et al., technical problem and day of helical CT system, Journal of Japanese Society of Radiological Technology 52(3)384‐388, 1996. [6] K. Tsujioka, Technical problem-performance evaluation of helical CT
system, Journal of Japanese Society of Radiological Technology 52(3)389‐396, 1996.
[7] S. Muramatsu et al., basic performance and day of scanning CT of spiral, Journal of Japanese Society of Radiological Technology 52(1)81‐85, 1996.
[8] K. Kubota et al., application and day of helical scanning in brain bottom, Journal of Japanese Society of Radiological Technology 52(9)1066, 1996.
[9] S. Kuwahara, Performance evaluation for Hispeed AdvantageRp, Magazine for Radiological Technology of Hokkaido, 56, 51‐58, 1996. [10] K. Arai, Basic theory of wave let analysis, Morikitashuppan Publishing
Co. Ltd., 2000.
[11] K. Arai, Self-study on wavelet analysis, KindaiKagaku Publishing Co. Ltd., 2006.
AUTHORS PROFILE Kohei ARAI
Saga University Saga, Japan