ISSN 0104-6632 Printed in Brazil
www.abeq.org.br/bjche
Vol. 22, No. 04, pp. 573 - 583, October - December, 2005
Brazilian Journal
of Chemical
Engineering
APPLICATION OF THE WAVELET IMAGE
ANALYSIS TECHNIQUE TO MONITOR CELL
CONCENTRATION IN BIOPROCESSES
G. J. R. Garófano
1, C. G. Venancio
1, C. A. T. Suazo
1and P. I. F. Almeida
1*
1
Federal University of São Carlos, Department of Chemical Engineering, Phone: +(55) (16) 3351-8264, Fax: (55) (16) 3351- 8266, Via Washington Luís , Km 235
CEP: 13565-905, São Carlos - SP, Brazil.
E-mail: [email protected], E-mail: [email protected] E-mail: [email protected]
(Received: October 20, 2005 ; Accepted: July 7, 2005)
Abstract - The growth of cells of great practical interest, such as, the filamentous cells of bacterium
Streptomyces clavuligerus, the yeast Saccharomyces cerevisiae and the insect Spodoptera frugiperda (Sf9)
cell, cultivated in shaking flasks with complex media at appropriate temperatures and pHs, was quantified by the new wavelet transform technique. This image analysis tool was implemented using Matlab 5.2 software to process digital images acquired of samples taken of these three types of cells throughoot their cultivation. The values of the average wavelet coefficients (AWCs) of simplified images were compared with experimental measurements of cell concentration and with computer-based densitometric measurements. AWCs were shown to be directly proportional to measurements of cell concentration and to densitometric measurements, making evident the great potential of the wavelet transform technique to quantitatively estimate the growth of several types of cells.
Keywords: Image analysis; Wavelet transform; Streptomyces clavuligerus; Saccharomyces cerevisiae;
Spodoptera frugiperda;Cell growth.
INTRODUCTION
Even though for several decades efforts by biochemical engineers to monitor and to control bioprocesses by monitoring indirect variables such as pH, temperature and dissolved oxygen, have been successful, the quantitative monitoring of cell growth has still not been fully achieved. Over the past decade, several modern resources for monitoring biomass have been made available, including the outstanding sensor of Bitter et al. (1998), which allows microscopic observation of microorganisms in situ in a fermentor; the biomass estimator based on capacitance measurements that makes monitoring of adhered and suspended cell concentration possible (Coremans et al., 1996), and the several types of
The image analysis technique has been under development since the 90s, and is attracting a lot of attention as a resource for use in monitoring biomass and cell morphology in a fast, robust and economical way (Thomas & Paul, 1996; Pons et al., 1998). According to several researchers' predictions (Konstantinov et al. ,1994; Shioya et al., 1999), it will be a powerful tool for implementing modern strategies of control and bioprocess optimization, such as the ones that are based on so-called expert systems.
The significant recent progress in relation to the cost and performance of new computers make it possible to implement complex numerical procedures in a very short period of time, so the analysis of images is becoming a very useful tool in bioprocess monitoring and control. Densitometric techniques (grey-scale analysis of a given image) were used successfully by Treskatis et al. (1997) for biomass quantification of a submerged culture of the filamentous bacterium Streptomyces tendae, in an attempt to accompany the fermentative process on line. On the other hand, the new mathematical wavelet transform technique in its computer-based version is attracting the attention of specialists in the field of image processing for its capacity to represent attributes of images in a much simpler, efficient and compact way than the traditional Fourier transform (Misiti et al. ,1997), characteristics which have been increasing interest in applications of pattern recognition in a variety areas of human activity (the finance market, identification of human voice and of fingerprints, etc.). However, although it has commercial algorithms such as the MATLAB 5.2 toolbox that facilitate its use, this tool still had not been tested in computer-based image processing to quantify and characterize cell growth. Hence, the objective of the present work is to evaluate the potential of the wavelet transform technique by comparing it with traditional measurements (dried biomass and cell counting) and with densitometry to estimate cell concentration when cultivating cells of great practical interest, such as those of the bacterium Streptomyces clavuligerus, the yeast Saccharomyces cerevisiae and the insect Spodoptera frugiperda (Sf9) cell.
MATERIALS AND METHODS
Signal Analysis Using the Wavelet Transform Technique
Traditionally, Fourier transform has been used to process stationary signals acquired by computers. In
this way, the representative spectrum of frequencies is obtained from the time series produced during acquisition of the signal by the computer.
For nonstationary signals, typical of biological processes, the existing methodologies have not been fully developed. Windowed Fourier transform, also called short-time Fourier transform, was first applied by Gabor (1946), using a Gaussian-type window. For a given signal f(t), a conveniently defined signal g(t-t0) is applied to a window of time that moves along
with the original signal, forming a new family of functions:
( )
g 0 0
f t , t = f (t) g(t−t ) (1)
Functions formed in this way are centered on t0
and have a duration defined by the characteristic time window of the function g(t). Windowed Fourier transform is thus defined as
iwt
g 0 0
F [w,t ] ∞f (t) g(t t ) e− dt
−∞
=
∫
− (2)This transform is calculated for all t0 values and
it gives a representation of the signal f(t) in the time-frequency domain. If a space function f(x) instead of a time signal, is considered, a representation is given in the space-frequency domain. However, as a windowed Fourier transform represents a signal by the sum of its sine and cosine functions, it restricts the flexibility of the function g(t-t0) or g(x-x0),
making a characterization of a signal and simultaneous location of its high-frequency and low-frequency components difficult in the time-frequency domain or the space-time-frequency domain.
Wavelet transform was developed to overcome this deficiency of windowed Fourier transform in representing non-stationary signals. Wavelet transform is obtained from a signal by dilation-contraction and by the translation of a special wavelet within the time or space domain. The expansion of this signal into wavelets thus permits the signal's local transient behavior to be captured, while the sine and cosines can only capture the overall behavior of the signal as they always oscillate indefinitely.
In the Fourier analysis, every periodic function having a period of 2π and an integrable square is generated by an overlay of exponential complexes,
inx n
W (x)=e , n= 0, ± ±1, 2...., obtained by dilations of
the function ix
n
a,b 1 / 2
1 t b
, a,b , a 0
a a
−
ψ = ψ ∈ ℜ ≠
(3)
The function ψ is called a mother wavelet, where a is the scale factor and b is the translation parameter. The family of simpler wavelets, which will be adopted in the present work, is that of the Haar wavelet:
1
(x) 1 if 0 x
2
ψ = ≤ ≤ (4.a)
1
(x) 1 if x 1
2
ψ = − ≤ ≤ (4.b)
(x) 0 if x [0,1]
ψ = ∉ (4.c)
When constructing images on the computer, the discreet image composition points (pixels) and the gray-scale tones of which each pixel is composed, are usually multiples of two. It is thus convenient to redefine the wavelets in an orthogonal binary base. For the unidimensional nonstationary functions f(x) that decrease to zero when x→∞, the following assumption is normally adopted :
j j 2
j,k(x) 2 (2 x k)
−
ψ = ψ − (5)
The scale factor of 2-jk is called the
localization or dyadic translation and k is the translation index associated with the localization, where j and k ∈Ζ.
Meyer (1985) proved that wavelets thus defined are orthogonal, i.e.,
j,k. l,m j,l k,m for j,k,l,m where .
ψ ψ = δ δ ∈ Ζ is
equal to the scalar product and δ refer to the delta function of Dirac.
Thus, the function f(x) can be rewritten as follows:
j,k j,k j
f (x) c . (x)
∞ ∞
=−∞ −∞
=
∑ ∑
ψ (6)The values of the constants cj,k are obtained by
wavelet transform in its discrete form. Then f(x) is expanded into a series of wavelets with their coefficients obtained from
j,k j,k j,k
c f . ∞f (x) (x)dx
−∞
= ψ =
∫
ψ (7)The wavelet transform can also be calculated using special filters called Quadrature Mirror filters, as proposed by Mallat (1989). They are defined as a low-pass filter, associated with the coarser scale, and a high-pass filter to characterize the details of the signal.
The signal f(x) then is described as:
0 0
0
j ,k j ,k j,k j,k
k j j k
f (x) c (x) d (x)
>
=
∑
φ +∑∑
ψ (8.a)where
0 0
j ,k j ,k
c ∞ f (x) (x)dx
−∞
=
∫
φ (8.b)j,k j,k
d ∞ f (x) (x)dx
−∞
=
∫
ψ (8.c)In the expansion of f(x) by equation (8.a), the first term represents the approximation of the signal and the second the signal details, filtered by the approximation. The function φjo,k is denominated a scale function or father wavelet, and it is responsible for obtaining the approximation of the signal, while the mother wavelets, ψj,k, are responsible for the generation of the details filtered by the approximation.
For the family of Haar wavelets, the scale
function is
0
j ,k(x) 1 if x [0,1]
φ = ∈ (9.a)
0
j ,k(x) 0 if x [0,1]
φ = ∉ (9.b)
The mother wavelets, responsible for the details in the Haar family, are expressed as
j / 2 j j
j,k
1
(x) 2 , if 2 k x 2 k
2
− −
ψ = ≤ ≤ +
(10.a)
(
)
j / 2 j j
j,k
1
(x) 2 , if 2 k x 2 k 1
2
− −
ψ = − + ≤ ≤ +
(10.b)
j,k(x)
Image Analysis Utilizing the Wavelet Transform Technique
The “filming” of a process of cell growth can be understood as the generation of a sequence of pictures or images, captured over a period of time. An image of that sequence will then be the space registration in two dimensions of a phase of the process, characterizing a specific instant in cell growth. To represent that image using wavelets, a possibility would be to build a base of orthogonal functions derived from the tensorial product of two unidimensional bases having different scales:
{
0 1 0 2}
1 2
1 1 1 2
1 1 1 1 2
1 1 1 2 1 2
j ,k j ,k k ,k
j ,k j ,k
j j j ,k j ,k
j ,k j ,k k ,k
B (x) (y)
(x) (y) ,
U (x) (y) ,
(x) (x)
≥
= φ φ ∪
φ ψ
ψ φ
ψ ψ
(11)
This base may be represented by
{
}
{
}
0
1
j , 1 2 k
j, 1 2
j j ,
B (x,y) (k , k )
(y) (k , k ), h,v,d
κ κ
µ κ
≥ κ
= φ κ = ∪
ψ κ = µ =
(12)
or, in other words, we have a father wavelet and three distinct mother wavelets which sweep the image in horizontal, vertical and diagonal directions:
0 0 1 0 2
j ,κ(x, y) j ,k (x) j ,k (y)
φ = φ φ (13.a)
1 1 1 2
h
j,κ(x,y) j ,k (x) j ,k (y)
ψ = φ ψ (13.b)
1 1 1 1
v
j,κ(x, y) j ,k (x) j ,k (y)
ψ = ψ φ (13.c)
1 1 1 2
d
j,κ(x, y) j ,k (x) j ,k (y)
ψ = ψ ψ (13.d)
The father wavelet originating in the scale product represents the coarse part of the image and three distinct mother wavelets originating in the crossed products represent the horizontal (h), vertical (v) and diagonal (d) detais.
An integrable square function can then be written in the following form:
0 0
1
j , j ,
j, j,
j j h,v,d
f (x, y) c (x, y)
d (x, y)
κ κ
κ ∞
µ µ
κ κ
= κ µ=
= φ +
+ ψ
∑
∑∑ ∑
(14)
with the wavelet coefficients given by
0
j , j,
x,y
c κ =
∫∫
f (x, y) φ κ(x, y) dx dy (15)j, j,
x,y
dµκ =
∫∫
f (x, y) ψµκ(x,y) dx dy (16)with κ (k1 ,k2) as translation parameters in the
directions of x and y.
The Matlab 5.2 software used adopts a “pyramidal” algorithm (Misiti et al., 1997) to calculate the discreet wavelet transform, as mentioned here. The algorithm uses low-pass [ek]
and high-pass [hk] filters to determine the
coefficients cj0,κ and dµj, κ for each scale desired.
For each value of the ordered pair (k1, k2 )
corresponding to a certain pixel (x,y) of the image, a value of cj0,k and three values of dµ j,κ are found,
representing the approximation coefficient and the detail coefficients, respectively.
From the coarser scale jo, an approximate figure
with half the resolution of the original image is obtained and another three figures with details in the horizontal, vertical and diagonal directions are obtained. These three images have the same resolutions as the approximate figure. The approximate figure will constitute the starting point for calculation of quantity of cells in an image, since when the Haar wavelet, whose values alternate between 0 and 1, is used the image is just represented by the sum of the coefficients, i. e., equation 14 is reduced to f(x,y) =Σ cj0,k. In reality,
Matlab 5.2 provides the average value of the coefficients as the final processing result.
Varying the level j>j0, a reduction in scale is
Cell Species, Culture Media and Cultivation Conditions
Three species of cells were cultivated in a shaker (rotating incubator, New Brunswick Scientific G-25KC), establishing conditions favorable to good cell growth in each case. At predefined time intervals, samples were taken for quantification of cell concentration, either by specific experimental methods for each cell type or by image analysis techniques, as described below.
The bacterium Streptomyces clavuligerus NRRL l3585 was aerobically cultivated in medium distributed betwen several 250 mL Erlenmeyer flasks with cotton plugs. Each flask contained 50mL of medium with 15g/L of glycerol, 0.8 g/L of K2HPO4
and 32 g/L of peptone with the pH adjusted to 6.5± 0.1. The Erlenmeyer flasks with the inoculated medium were incubated in the shaker at 28 oC and 250 rpm for 72 hours.
The baker yeast, Saccharomyces cerevisiae
(Fleischmann), was anaerobically cultivated in a 500 mL Erlenmeyer flask with a rubber stopcock. The flask contained 250mL of culture medium of the following composition: 2g of yeast extract, 1.0g of K2HPO4, 1.3g of NH4Cl, 0.82g of MgSO4.7H2O,
1.1g of sodium citrate, 1.5g of citric acid, 1.0 g of CaCl2H2O and 100g of glucose with the pH of the
medium adjusted to 4.2±0.1. The inoculum in the Erlenmeyer flask was incubated in the shaker at 30o C and 200 rpm for 9 hours.
To cultivate cells of the insect Spodoptera frugiperda, they were first activated after being stored in liquid nitrogen at -196 °C to recover their normal activity. The same cells were then used to inoculate ~5 mL of Sf-900II medium from Gibco in T flasks with a 50mL capacity. Then the contents of the T flasks were used as inoculum for 12 mL of the same medium as that contained in a 100 mL Schott flask. The flask containing the inoculated medium was put in a shaker for incubation at 28 °C and 100 rpm for 11 days. Oxygenation of the medium was achieved by opening the flask daily in a safety cabinet for air renewal.
All the components used in the preparation of media for the cultivation of the three type of cells were of analytical grade.
Quantification of Cell Concentration
Streptomyces clavuligerus: the biomass was quantified using the dry mass method, filtering through a Millipore membrane with a 0.45µm pore diameter and drying at 105±2ºC for 4 hours.
To analyze the images, 1mL of fermentation broth was diluted ten times with 5 mL of methylene-blue solution with the composition used by Tucker et al. (1992) and 4 mL of distilled water and then slides with cover slips having samples of colored cells were prepared for analysis under an optical microscope.
Saccharomyces cerevisiae: the biomass was quantified by the dry mass method, filtering through a Schleicher & Schüll membrane with a 0.45 µm pore diameter and drying at 105±2 ºC for 4 hours.
To analyze the images, 2mL of fermented medium containing Sac. cerevisiae yeast was mixed with 2 mL of methylene blue solution (0.3 g in 130 mL of 22% v/v ethyl alcohol solution). A sample of 5 µL of the yeast suspension was loaded in a Neubauer chamber and covered with a cover slip.
Spodoptera frugiperda: To determine cell concentration, samples of several dilutions were taken, along with another 10 µL of coloring, and the remainder was diluated with SPB (saline phosphate buffer), for a total volume of 100µL, and then cells were counted using an Olympus CK3 inverted-field optical microscope.
To analyze the images, a 5µL sample specimen was put on a microscope slide and covered with a cover slip. At preset times, in conjunction with counting analysis, samples of the Sf9 insect cell were removed from 90µL of suspension with a micropipette and were placed in 10µL of a 0.2% Trypan-blue dye ethyl solution. Then a 10µL specimen of this sample was put in a Neubauer chamber and covered with a cover slip.
Preparation of the Samples for Image Analysis
For all three cases of cells being studied, the samples prepared in the Neubauer chamber and on the slide were examined using an optical microscope (Olympus BX50) setup with a video camera (Sony CCD-Iris DXC-107A) connected to a microcomputer (Pentium 100 MHz, 65Mb RAM) to acquire and process 20 different images chosen randomly by
sample, with a magnification of 200x for Sac.
cerevisiae, 100x for Str. clavuligerus and 200x for Sf9.
Application of Image Analysis Techniques
more complex morphology, which were used in this study. Besides permitting a quite compact image to be captured and using little computer memory, the pretreatment helps to reveal the main attributes of the cells analyzed with good definition to the naked eye.
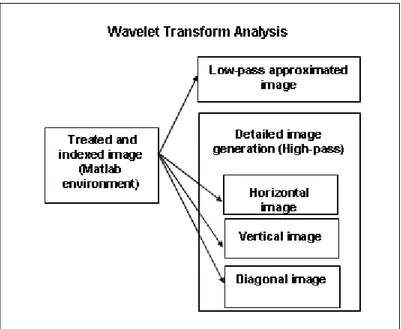
When processing an image using the Haar-1-family MATLAB 5.2 wavelet technique, a wavelet transform is generated in two dimensions composed of four images: an approximate image and three other images called "details". The approximate image is characterized by high-scale and
low-frequency components, while the other three images have small-scale and high-frequency components, resulting from a filtering process with vertical, horizontal and diagonal sweeps (Misiti et al., 1997). The process decomposition diagram of an indexed image using the wavelet transform analysis toolbox can be seen in Figure 2 and the four images generated are shown in Figure 4. In this work, special attention was paid to the average wavelet coefficient (AWC) as a measure of the quantity of cells in accordance with equation 14, as postulated above.
Figure 1: Ilustration of the process of image analysis with pretreatment followed by wavelet transform analysis for the three types of cell cultivated.
Figure 2: Diagram of the process of decomposition of an indexed image
Figure 3: Treatment of the images of the bacterium Str. clavuligerus: a) Grey-scale image; b) Binary image after thresholding; c) Binary image after removing particles; d) Images after the process of superposition, which is used afterward for wavelet and densitometric analysis.
Figure 4: Decomposition of S. clavuligerus cell
image in four other images, utilizing the MATLAB 5.2 wavelet software. The top left image is the approximate image and the rest are corresponding detailed images.
The Matlab 5.2 image processing toolbox and the wavelet software were used to analyze pretreated images served as a tool to calculate the AWCs, a process wich took approximately 20 minutes.
It was necessary to carry out a densitometric analysis of the images obtained for the purpose of comparing the results of the wavelet technique results with another computer-based method. In this work, the densitometric technique used was that proposed by Treskatis et al. (1997), which is based on measurement of the area occupied by the cells and the maximum and average cell grey-scale tones. The gray-scale tone quotient logarithmic values represent a measurement of biomass thickness. By following the principle of Lambert and Beer, the biomass was estimated from Equation 17:
max mean G kAlog
G
∆ =
(17)
where ? is the cell concentration by densitometry, k´is the proportionality factor, A is the projected area of cells, Gmax is the maximum grey-scale tone and
Gmean is the average grey-scale tone.
RESULTS AND DISCUSSION
In the three experiments with different cells, cell growth was analyzed by monitoring from the lag
phase to the decline phase. The objective of these experiments was to verify the validity of the computed measurements in all of the growth phases.
Figures 5a and 5d represent the image acquired and the one obtained after pretreatment, as described in "Materials and Methods" for the cells of Sac. cerevisiae. Figures 5b and 5e are for the Str. clavuligerus cells and figures 5c and 5f are for the Sf9 cells.
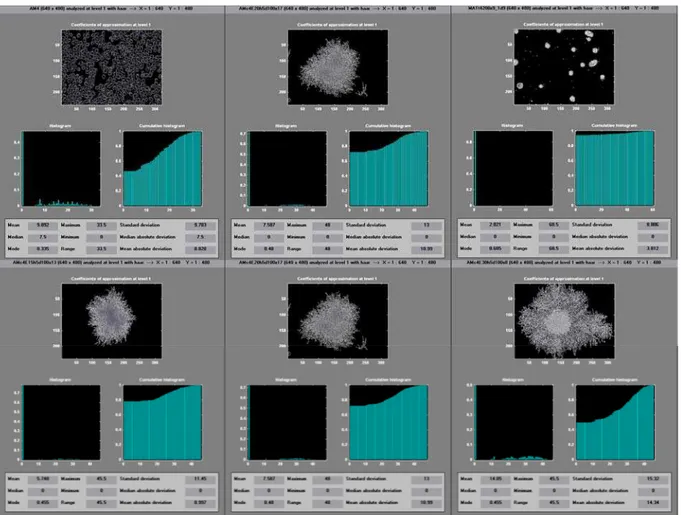
In the three screens at the top of Figure 6, typical results for an intermediate position of the exponential phase of the cell growth obtained by wavelet analysis with the MATLAB 5.2 software for cells of Sac. cerevisiae, Str. clavuligerus and Sf9 are presented. Worthy of notice in the three results is the strong influence of the tone associated with the image background. The most significant case is that of the Sf9 cell, where the frequency of tones associated with the background is predominant (the AWC value is the smallest obtained for the three
cells shown). Although Sac. cerevisiae has a
morphology similar to that of Sf9, it appears in larger numbers in the acquired image and, as predicted by equation 14, the AWC is larger. On the
other hand, the AWC obtained for the Str.
Figure 5: Figures 5a, 5b and 5c: Images in grey-scale tones acquired from the cultivation of the yeast Sac. cerevisiae, of the bacterium Str. clavuligerus and of the insect cell, Sf9, respectively. Figures 5d, 5d and 5f): Treated images in grey-scale tones acquired from the cultivation of the yeast Sac. cerevisiae yeast, of the bacterium Str. clavuligerus and of the insect cell, Sf9, respectively.
Figure 6: Typical results obtained with the MATLAB 5.2 wavelet transform analysis software for
In the three screens at the bottom of Figure 6, a typical result on the growth of the Str. clavuligerus cell is presented in pellet form. An increase in AWC is observed, indicating that it corresponds to the cell growth observed in the image. The result can also be visualized using histograms, which show the predominance of larger wavelet coefficients for the images with a higher content of biomass or number of cells.
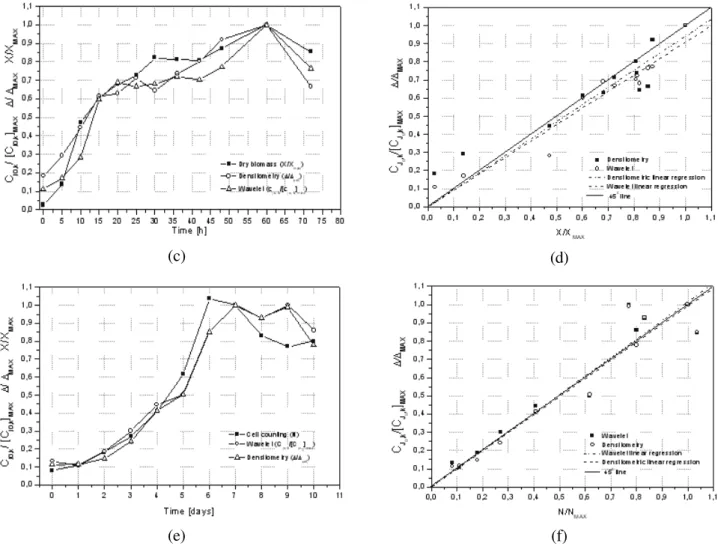
The results from the three cells studied are shown in Figure 7. It can be seen that the behavior of the AWC analysis curve and the densitometric analysis curve are very similar to curves obtained from experimental cell growth. For the bacterium Str. clavuligerus, the curve estimated by the AWC technique also has a maximum biomass growth at around 60 hours of fermentation followed by a decline. In the experiments with the yeast Sac. cerevisiae, the AWC analysis followed the biomass growth well, showing smaller deviations than the one given by densitometric measurement. In the case of the insect S. frugiperda cell, a fall off of cell growth at around the third to fourth day is shown.
The equivalence of computer-based AWC and densitometric measurements and experimental estimates of cell concentration was also analysed by plotting both measurements in an adimensional manner, as shown in Figure 7. A linear relationship between the measurements can be observed in this figure with a very satisfactory correlation coefficient for the three cases of cells analyzed. The results of
the statistical analysis can be seen in Table 1. The larger AWC deviations at the beginning of
the experiment with Str. clavuligerus can be
attributed to the fact that the samples were diluted by a factor of ten. In a way similar to what happens under a microscope with the manual counting method, the small number of cells in the images analyzed generated relatively large errors in the computer-based image processing. This problem was
corrected in the AWC measurements of Sac.
Cerevisiae and Sf9, generating results which were more in line with the respective experimental measurements (see Figures 7e).
Use of software to pretreat the images and the Matlab 5.2 image processing toolbox and the wavelet software to calculate the AWCs took approximately 40 minutes per sample with a 100 MHz personal computer. The speed of the wavelet analysis can be increased by developing a specific program for serial image analysis. Matlab did not allow this flexibility, so the image processing time could not be reduced.
Detailed image analysis was not adressed in this text because it would not greatly benefit the specific objective of the present work. However, it is worth remembering that, when doing wavelet tranform analysis, the detail images can produce useful recognition and quantification results on morphological patterns of different types of cells. This additional use could also be of great value in the area of monitoring and bioprocess control.
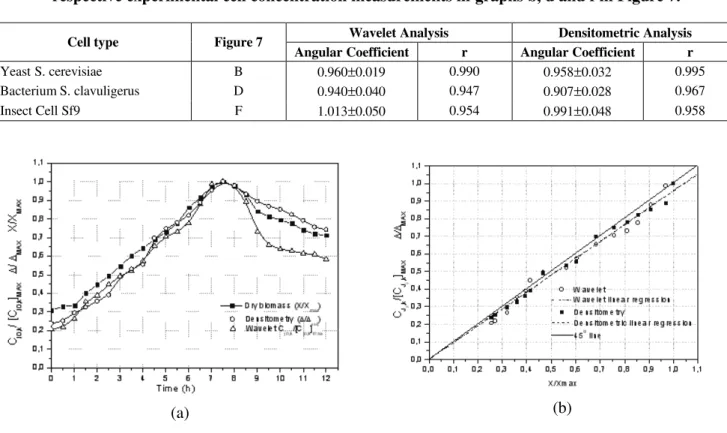
Table 1: Results of the comparation between the AWC and densitometric measurements and the respective experimental cell concentration measurements in graphs b, d and f in Figure 7.
Wavelet Analysis Densitometric Analysis
Cell type Figure 7
Angular Coefficient r Angular Coefficient r
YeastS. cerevisiae B 0.960±0.019 0.990 0.958±0.032 0.995
BacteriumS. clavuligerus D 0.940±0.040 0.947 0.907±0.028 0.967
Insect Cell Sf9 F 1.013±0.050 0.954 0.991±0.048 0.958
(c) (d)
(e) (f)
Figure 7: 7a, 7c and 7e): Results of the wavelet, densitometric and experimental analysis of the cell
cultivation concentration for the yeast Sac. cerevisiae, the bacterium Str. clavuligerus and the insect cell, Sf9, with images at magnifications of 400x, 100x and 200x, respectively. The measurements were normalized dividing by the maximum value of the respective variable (∆MAX, [Cjo,k] MAX and XMAX or
NMAX) obtained for the cultivations of those cells. Figures 7b, 7d and 7f): Relationship between the
AWC and densitometric measurements and the experimental cell concentrations of the yeast Sac. cerevisiae, the bacterium Str. clavuligerus and the insect cell, Sf9, respectively.
CONCLUSIONS
The following conclusions were reached from the results obtained:
1. The average wavelet coefficients (AWCs) obtained from the images of the different types of cells in this study can be used as a quantifying measurement of cell concentrations during their growth.
2. The computer-based measurements obtained from the average wavelet coefficients (AWCs) and from the densitometric measurements showed a good linear correlation with experimental measurements of dry biomass and counting of
cells in a Neubauer chamber.
3. Wavelet transform analysis was shown to be quite promising as a fast, simple and compact tool for measuring cell concentration and, therefore, has great potential for use in modern bioprocess monitoring techniques.
ACKNOWLEGEMENTS
NOMENCLATURE
a scale factor, t
b translation parameter, t
c approximation wavelet coefficient
(-)
d detailed wavelet coefficcient (-)
f mathematical function (-)
g mathematical function k1 translation parameter in x
coordinate
(-)
k2 translation parameter in y
coordinate
(-)
k´ proportionality factor, ML-5
i imaginary number v-1 (-)
t time (-)
x independent variable (-)
y independent variable (-)
A projected area of cells, L2
B base of orthogonal functions (-)
Fg windowed Fourier transform (-)
G grey-scale tone in an image (-)
W mathematical function (-)
Greek Letters
d delta function of Dirac (-)
? translation parameter in wavelet analysis
(-)
µ sweep directions (vertical,
horizontal or diagonal) ? cell concentration by
densitometry,
ML3
φ father wavelet function or scale function
(-)
ψ mother wavelet function (-)
REFERENCES
Bitter, C., Wehnert, G. and Scheper, T. In situ Microscopy for On-line Determination of Biomass, Biotechnology Bioengineering, 60(1), pp. 24-35 (1998).
Coremans, J.M., Joly, V., Dehottay P.H. and Gosselé, F., The Use of Capacitance and Conductance Measurements to Monitor Growth
and Physiological States of Streptomyces
virginiae in Industrial Fermentations, 6th Netherlands Biotechnology Congress, 12 March, Amsterdam (1996).
Gabor, D., Theory of Communications, Jounal of the Institute of Electrical Engineering, London, III, 93, pp. 429-457 (1946).
Konstantinov, K., Chuppa, S., Sajan, E., Tsai, Y., Yoon, S. and Golini, F., Real Time Biomass Concentration Monitoring in Animal Cell Cultures, TIBTECH, 12, pp. 324-333 (1994). Mallat, S., A Theory for Multiresolution Signal
Decomposition: the Wavelet Representation, IEEE Pattern Analysis and Machine Intelligence, 11(7), pp. 674-693 (1989).
Meyer, Y., Principe Díncertitude, Bases Itilbertienna et Algebres D’Operateurs, Seminare Bourbaki, 1985-1986, 662 (1985).
Misiti, M., Misiti Y., Oppenheim G. and Poggi J. M., Wavelet Toolbox User’s Guide, The Mathworks, New York (1997).
Morettin, P.A., Ondas e Ondaletas – Da Análise de Fourier à Análise de Ondaletas, Ed. Edusp, São Paulo, (1999), in Portuguese.
Polikar, P., The Engineer’s Ultimate Guide to Wavelet Analysis – The Wavelet Tutorial, http:/engineering. rowan.edu/~polikar, 1999. Pons, M.N., Drowin J.F., Louvel L., Vanhoutte B.,
Vivier H. and Germain P., Physiological Investigations by Image Analysis, Journal of Biotechnology, 65, pp. 3-14 (1998).
Shioya, S., Shimizu, K. and Yoshida, T., Knowledge-based Design and Operation of Bioprocess Systems, Journal Bioscience Bioengineering, 87(3), pp. 261-266 (1999). Thomas, C.R. and Paul, G.C., Applications of Image
Analysis in Cell Biology, Current Opinion Biotechnology, 7, pp. 35-45 (1996).
Treskatis, S. K., Orgeldinger, V. and Gilles, E. D., Morphological Characterization of Filamentous Microorganisms in Submerged Cultures by On-line Digital Image Analysis and Pattern Recognition, Biotechnology Bioengineering, 53, pp. 191-201 (1997).