JSCS–4854 Original Scientific paper
Application of an R-group search technique in the molecular
design of HIV-1 integrase inhibitors
JIAN-BO TONG∗, MIN BAI and XIANG ZHAO
College of Chemistry and Chemical Engineering, Shaanxi University of Science and Technology, Xi’an 710021, PR China
(Received 26 August, revised 29 November, accepted 30 November 2015)
Abstract: In this paper, a three-dimensional quantitative structure–activity
relationship (3D-QSAR) study for 62 HIV-1 integrase (IN) inhibitors was established using Topomer CoMFA. The multiple correlation coefficient of fit-ting, cross-validation and external validation were 0.942, 0.670 and 0.748, res-pectively. The results indicated that the obtained Topomer CoMFA model had both favorable estimation stability and good prediction capability. Topomer Search was used to search the R group from the ZINC database. As a result, a series of R groups with a relatively high activity contribution was obtained. By filtering with the most potent molecule in the set, 1 Ra group and 21 Rb groups were selected. The 1 Ra groups and 21 Rb groups were employed to substitute alternately the Ra and Rb of sample 42. Finally, 21 new compounds were designed and further their activities were predicted using the Topomer CoMFA model and there were 10 new compounds with higher activity than that of the template molecule. The results suggested the Topomer Search technology could be effectively used to screen and design new HIV-1 IN inhibitors and has good predictive capability to guide the design of new HIV/AIDS drugs.
Keywords:quantitative structure–activity relationship (QSAR); integrase
inhi-bitors; Topomer CoMFA; Topomer Search; design of new inhibitors. INTRODUCTION
Acquired immunodeficiency syndrome (AIDS) caused by the human
immu-nodeficiency virus (HIV) has been a threat to human health since it was first
rep-orted in 1981.
1,2Anti-HIV drug development has been one of the leading tasks in
the drug discovery area with the increase in the number of AIDS sufferers.
3The
inherent proteins involved in the viral replication cycle have been used as drug
targets to design inhibitors to prevent the spread of infection, such as reverse
transcriptase (RT), protease (PR), integrase (IN), glycoprotein (gp41 and gp120),
as well as the host cell receptor (CD4) and co-receptor (CCR5 and CXCR4).
4
Twenty two drugs comprising reverse transcriptase inhibitors (RTI), protease
inhibitors (PI) and entry inhibitors have been approved by the FDA for the
treatment of HIV infection. Unfortunately, most of these drugs have produced
different degrees of resistance. Hence, the research and development of new
drugs has become an urgent priority Human immunodeficiency virus-1 (HIV-1)
is characterized by reverse transcription of the viral RNA genome to cDNA and
its integration into the host cell genome. Then, the integrated proviral DNA with
a long terminal repeat (LTR) at each end is transcribed, leading to the synthesis
of viral proteins and completion of the viral replication cycle. IN plays a pivotal
role in virus replication. Moreover, IN is not present in the host cell but is in the
virus itself and has no mammalian counterpart.
5–7Thus, IN became an attractive
and suitable target for the development of anti-AIDS drugs. HIV-1 IN is a 3′-
pol
-gene-encoded enzyme containing 288 amino acid residues.
8,9HIV-1 IN
com-prises three domains: the
N
-terminal domain, the
C
-terminal domain and the
catalytic domain. The catalytic domain contains a DDE motif (D64, D116 and
E152) that forms metal chelating interactions with one or two divalent metal
ions, such as Mn
2+and Mg
2+.
10The whole process of the integration of HIV-1
cDNA into the chromosomes of the host cell by HIV-1 IN contains two steps:
3-processing and strand transfer.
Raltegravir (RAL) became the first IN strand
transfer inhibitor approved by the FDA in 2007.
11,12The availability of computational techniques on quantitative structure
acti-vity relationships (QSARs) might provide a potential direction for accelerating
the process of drug design. In fact, QSAR could be viewed as a technique
attempting to summarize chemical and biological information in a form that
allows the generation of relationships between chemical structure and biological
activity.
13As is well known, the success of a QSAR study depends also on the
selection of the variables (molecular descriptors) and on the representation of the
information. Variables should give the maximum information in the activity
vari-ations. A 3D-QSAR model would better reflect the interactions between the ligand
and receptor compared to a 2D-QSAR model. Comparative molecular field
anal-ysis (CoMFA)
14is a method used widely in 3D-QSAR. In this paper, Topomer
CoMFA,
15,16the second generation of CoMFA, was employed to construct a
3D-QSAR model for 62 HIV-1 integrase inhibitors to analyze the
chemical–bio-logical interactions governing their activities toward HIV-1 IN. The Topomer
CoMFA model could also be applied to conduct ligand-based virtual screening
combining the Topomer Search
17technology to lay the foundation of new drug
design.
PRINCIPLES AND METHODS
Data set
training set (45 compounds) and a test set (17 compounds).The number of compounds in the test set was approximately 30 % of those in the training set, which was considered as a proper ratio.19 The training set was applied to build the 3D-QSAR model and the test set was used to verify the predictive ability of the model. The bioactivities of inhibitors are presented in pIC50 (–log IC50). The IC50 represents the concentration of an inhibitor that is required for 50 %
intergrase inhibition.
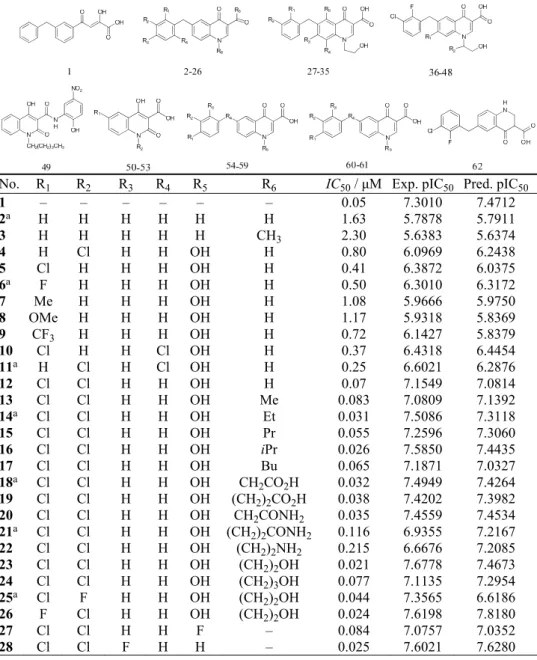
TABLE I. Structures and bioactivities of the 62 integrase inhibitors
No. R1 R2 R3 R4 R5 R6 IC50 / μM Exp. pIC50 Pred. pIC50
1 – – – – – – 0.05 7.3010 7.4712
2a H H H H H H 1.63 5.7878 5.7911
3 H H H H H CH3 2.30 5.6383 5.6374
4 H Cl H H OH H 0.80 6.0969 6.2438
5 Cl H H H OH H 0.41 6.3872 6.0375
6a F H H H OH H 0.50 6.3010 6.3172
7 Me H H H OH H 1.08 5.9666 5.9750
8 OMe H H H OH H 1.17 5.9318 5.8369
9 CF3 H H H OH H 0.72 6.1427 5.8379
10 Cl H H Cl OH H 0.37 6.4318 6.4454
11a H Cl H Cl OH H 0.25 6.6021 6.2876
12 Cl Cl H H OH H 0.07 7.1549 7.0814
13 Cl Cl H H OH Me 0.083 7.0809 7.1392
14a Cl Cl H H OH Et 0.031 7.5086 7.3118
15 Cl Cl H H OH Pr 0.055 7.2596 7.3060
16 Cl Cl H H OH iPr 0.026 7.5850 7.4435
17 Cl Cl H H OH Bu 0.065 7.1871 7.0327
18a Cl Cl H H OH CH
2CO2H 0.032 7.4949 7.4264 19 Cl Cl H H OH (CH2)2CO2H 0.038 7.4202 7.3982 20 Cl Cl H H OH CH2CONH2 0.035 7.4559 7.4534 21a Cl Cl H H OH (CH2)2CONH2 0.116 6.9355 7.2167 22 Cl Cl H H OH (CH2)2NH2 0.215 6.6676 7.2085 23 Cl Cl H H OH (CH2)2OH 0.021 7.6778 7.4673 24 Cl Cl H H OH (CH2)3OH 0.077 7.1135 7.2954 25a Cl F H H OH (CH2)2OH 0.044 7.3565 6.6186 26 F Cl H H OH (CH2)2OH 0.024 7.6198 7.8180
27 Cl Cl H H F – 0.084 7.0757 7.0352
TABLE I. Continued
No. R1 R2 R3 R4 R5 R6 IC50 / μM Exp. pIC50 Pred. pIC50
29 Cl Cl H F H – 0.034 7.4685 7.4825
30 Cl Cl OMe H H – 0.012 7.9208 7.6462
31a Cl Cl Cl H H – 0.043 7.3665 7.4009
32 Cl Cl Me H H – 0.041 7.3872 7.5342
33a Cl Cl CF
3 H H – 0.674 6.1713 6.9872
34 Cl Cl CN H H – 0.050 7.3101 7.4231
35 F Cl OMe H H – 0.009 8.0458 7.9970
36 H (S)-Me – – – – 0.0148 7.8297 7.9084
37 H (R)-Me – – – – 0.0383 7.4168 7.9076
38a H (S)-Et – – – – 0.009 8.0458 7.9384 39 H (S)-Pr – – – – 0.0082 8.0862 7.7193
40a H (S)-iPr – – – – 0.0082 8.0862 7.9061 41 H (S)-tBu – – – – 0.006 8.2218 7.9751
42 H (S)-cyclo-hexyl – – – 0.0056 8.2518 7.9954
43 H (S)-Ph – – – – 0.0098 8.0088 8.0302
44a OMe (S)-Pr – – – – 0.0058 8.2366 7.8725 45 OMe (S)-iPr – – – – 0.0072 8.1427 8.0813
46 OMe (R)-iPr – – – – 0.0144 7.8416 7.6121
47 OMe (S)-tBu – – – – 0.0058 8.2366 8.1655
48a OMe (S)-cyclohexyl – – – 0.0067 8.1739 8.1191
49 – – – – – – 9 5.0458 5.1364
50 Bn CH3 – – – – 6 5.2218 5.2892
51a 4-F-Bn CH
3 – – – – 0.9 6.0458 5.2451
52 OPh CH3 – – – – 14 4.8539 4.7144
53a 4-F-Bn (CH
2)4CH3 – – – – 5 5.3010 4.8765 54 H H H S (CH2)2OH – 18.5 4.7328 4.7834 55 Cl H Cl CH2 (CH2)2OH – 0.2 6.6990 5.8825 56 Cl H Cl CH2 (CH2)3OH – 1.3 5.8861 5.7093
57a Cl H Cl CH
2 (CH2)4OH – 0.6 6.2218 5.9280 58 Cl H Cl CH2 (CH2)2N–
–(CH3)2
24.1 4.6180 5.1304
59 Cl H Cl CH2 (CH2)2O– –CH3
– 16.5 4.7825 5.4701
60 F Cl NH – – – 2.1 5.6778 5.5582
61a H H S – – – 1.6 5.7959 6.7275
62 – – – – – – 0.0435 7.3615 7.4321
aChosen as the test set
Molecular structure construction
The 3D structures of 62 HIV-1 IN inhibitors were constructed using the sketch module of the Sybyl 2.0-X package. All molecules were optimized using the tripos force field and the gradient descent method with an energy change of 0.005 kcal* mol-1. Partial charges for all the molecules were added using the Gasteiger–Hückel method. The maximum iteration number was 1000. The other parameters were defaulted by Sybyl 2.0-X.
Topomer CoMFA modeling
Topomer CoMFA is a rapid fragment-based 3D-QSAR method to predict significant R-groups of molecules. The Topomer CoMFA method identifies bioactivity values with the help of a compound library as a source with automated rules.14 The process of standard Topomer CoMFA is completed by the following two steps: the first step is the generation of the Topomer 3D models for each fragment of the molecule. Topomer CoMFA divides one compound into two or more fragments. By confirming how to break down the structure of compounds, the Topomer CoMFA can automatically identify the features and charges of the fragments.20 The second step consists of performing CoMFA with partial least squares (PLS) using leave-one-out (LOO) cross-validation in order to form a predictive model.21 During the process of building the model, the CoMFA method is used to deal with the large amounts of data. By objective measures and automatic matching to analyze the characters of compounds, Topomer CoMFA is more efficient in forming predictive models compared with CoMFA.
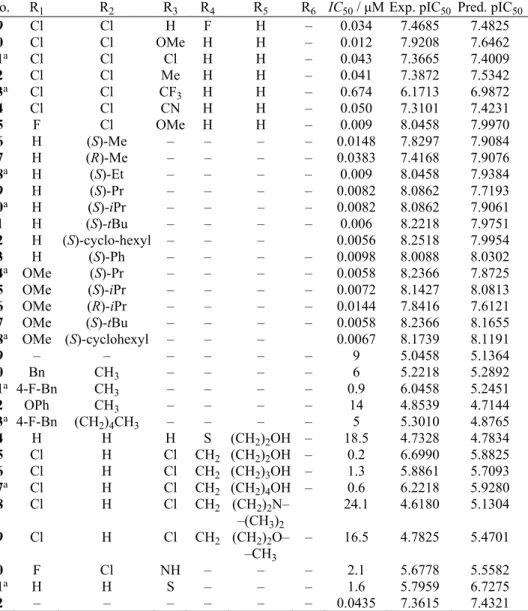
In the process of Topomer CoMFA, the measure of fracture could affect the quality of the model. In this study, the structure of each of the training set was broken into two sets of fragments, shown as Ra (blue) and Rb (red) groups as presented in Fig. 1. Initially, as it had the highest activity, molecule 42 was selected as the template molecule. Based on compound 42, the cutting style was confirmed. The molecule was cut to obtain the Ra group and the Rb group. Other training molecules were identified automatically and cut in this style. The mole-cules not identified required manual cutting. Then the steric and electrostatic field energy between the molecules was calculated. The descriptors obtained were considered as the inde-pendent variables and the pIC50 values were regarded as the dependent variables in partial least square (PLS)22 to build the Topomer CoMFA model. The model was evaluated by the leave-one-out cross-validation (LOO–CV) approach. The test molecules were predicted by the Topomer CoMFA model to verify the predictive ability of the obtained model.
Fig. 1. Cutting style of molecule 42.
Molecular screening
drug-like in the ZINC (2012) database (130,000 compounds). The Topomer distance was set as 185 to evaluate the binding degree, and other parameters were defaulted by Sybyl 2.0-X.
RESULTS AND DISCUSSION
Topomer CoMFA modeling results and evaluation
To generate statistically significant 3D-QSAR models, the ligand-based
alignment rule was used. In this study, regression analysis was performed using
the partial least squares (PLS) method.
23Some statistical parameters were used
to analyze the stand or fall of these models, including the cross-validated
coeffi-cient (
q
2), the standard deviation of error prediction (
r
2), standard error of
esti-mate (
SEE
) and
F
-statistic values. A high
q
2and
r
2value (
q
2> 0.5,
r
2> 0.6) is
considered as a proof of a high predictive ability of a model.
24The statistical
results of the model in this study are displayed in Table II, from which it could be
seen that the
q
2value was 0.670, an optimized component of 6 and the
r
2value
was 0.942, which suggested that the model also has predictive ability (
q
2> 0.5).
The pIC
50value of the test set was predicted with a
q
pred2value of 0.748. The
linear regression between the experimental pIC
50and the predicted pIC
50for the
training set and test set are shown in Fig. 2. The predicted bioactivities (pIC
50)
for the training set and test set are given in Table I. The results indicate that the
model has both favorable estimation stability and good prediction capabilities.
TABLE II. The statistical results of Topomer CoMFA; N – optimal components, r2 – themultiple correlation coefficient of fitting, q2 – the multiple correlation coefficient of cross
validation, 2 pred
q – the multiple correlation coefficient of external validation, SEE – standard
estimated error, SD – fitting standard deviation, SDCV – cross-validation standard deviation, F – Fisher value
Statistical parameter N r2 q2 qpred2 SEE SD SDCV F
Topomer CoMFA 6 0.942 0.670 0.748 0.277 0.28 0.67 103.344
Lu, Wei and Zhang performed a 3D-QSAR analysis on a series of quinoline
carboxylic derivatives of HIV-1 intergrase inhibitors using the CoMFA and
CoMSIA method.
25Compared with the present study, they entered more
mole-cular structures into the analysis. In the present study, a fair result (
q
2= 0.670,
r
2= 0.942,
SEE
= 0.277,
F
= 103.344) was achieved with Topomer CoMFA
Fig. 2. Linear regression between experimental and predicted pIC50 values of 62 inhibitors.
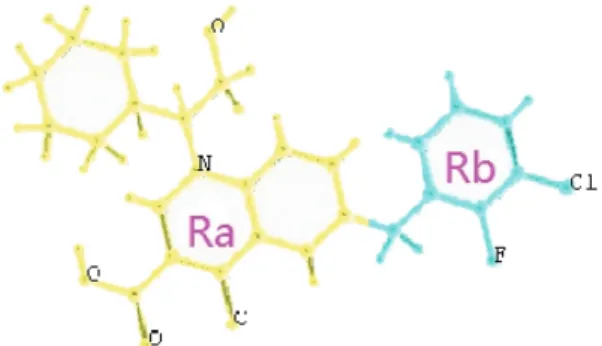
3D contour plots of the Topomer CoMFA model
The three-dimensional contour plots of the Topomer CoMFA model are
shown in Fig. 3a–d with the sample
42
as the reference structure. The contour
Fig. 3. 3D contour of Topomer CoMFA model: a) steric field map of Ra; b) electrostatic field map of Ra; c) steric field map of Rb; d) electrostatic field map of Rb (green and yellow
maps provide information on factors affecting the activities of the molecules.
This is particularly important when increasing or reducing the activity of a
com-pound by changing its molecular structure. The steric interaction of the Ra and
Rb groups is represented by green and yellow contours in Fig. 3a and c,
respect-ively, while the electrostatic interaction of the Ra and Rb groups is denoted by
red and blue contours in Fig. 3b and d, respectively. The green contours represent
regions where a large or bulky substituent is favorable for the activity. The
oppo-site is true for the yellow contours. The red isopleths indicate regions where a
negatively charged substituent is favorable for the activity and the blue isopleths
indicate regions where an increase of a positive charge of substituent enhances
the activity.
As shown in Fig. 3a, a green contour covering the cyclohexyl group linked
to R
2indicates the presence of a bulky group is good for the biological activity.
This is in agreement with the experimental data:
38
(–Et) >
37
(–Me),
41
(–
t
Bu)
>
40
(–
i
Pr). Molecule
42
has the highest activity because of the bulky substituent
(–cyclohexyl) at the R
2-position. Moreover, the green contour near the R
2-posi-tion of the molecule
42
indicates the bulky substituent in this position may be
favorable for the activity. For example, molecule
45
(–OMe) has a higher activity
than molecule
40
(–H). According to Fig. 3b, there is a large blue contour around
cyclohexyl (R
2), which suggests that a positively charged substituent at R
2-posi-tion may favor the activity. This is in agreement with the experimental data:
39
(–Pr),
40
(–
i
Pr),
41
(–
t
Bu) and
42
(–cyclohexyl). In Fig. 3c and d, a yellow and a
large blue contour at the 4-position of the phenyl ring indicate that a small and
positively charged substituent is preferred in this region. A red contour at the 2-
and 3-position of the phenyl ring in Fig. 3d, suggests the introduction of an
electronegative substituent at this position would be of benefit for inhibitory
acti-vity. It can show the fact that the –Cl and –F have been introduced in this position.
Molecular screening and molecular design
The results of the molecular screening using the Topomer search technology
were evaluated by the Topomer distance (TOPDIST) and the contribution values
of R-groups (TOPCOMFA_R). Under normal circumstances, priority was given
to TOPCOMFA_R in the same limit of the TOPDIST. In this study, 5000 Ra
groups and 1000 Rb groups were screened from drug-like in the ZINC (2012)
database. 1 Ra group and 21 Rb groups with higher TOPCOMFA_R than that of
template molecule were selected from 5000 Ra groups and 1000 Rb groups.
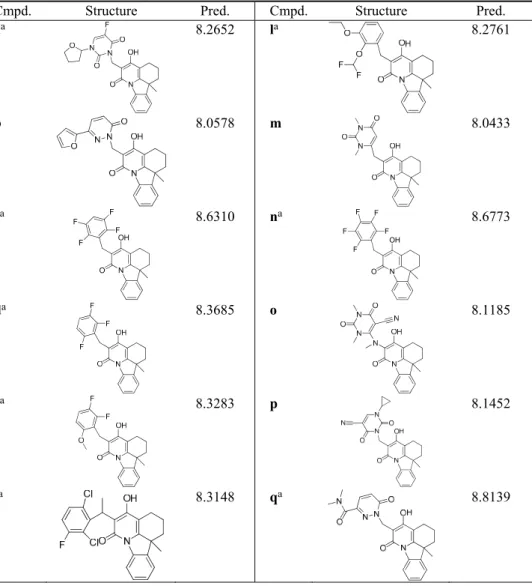
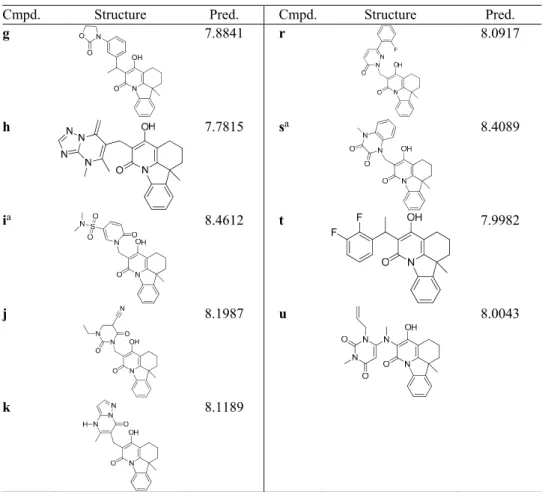
Table III, from which could be seen that there are 10 new compounds with higher
activity than that of the template molecule. Furthermore, as revealed in Table III,
10 new compounds had higher activities because of the introduction of an
elec-tronegative substituent into 2- and 3-position of the phenyl ring of Rb. Moreover,
bulky substituents in Ra contribute to the activity of 10 new compounds. This is
consistent with the analysis of the 3D contour of the Topomer CoMFA model.
TABLE III. Structures and predicted pIC50 values of new designed moleculesCmpd. Structure Pred. Cmpd. Structure Pred.
aa 8.2652 la 8.2761
b 8.0578 m 8.0433
ca
N O
OH F
F F
F 8.6310 n
a
N O
OH F
F F F
F 8.6773
da 8.3685 o 8.1185
ea 8.3283 p 8.1452
TABLE III. Continued
Cmpd. Structure Pred. Cmpd. Structure Pred.
g
N O
OH N O
O
7.8841 r 8.0917
h 7.7815 sa 8.4089
ia 8.4612 t 7.9982
j
N O
OH N
N O
O
N 8.1987 u 8.0043
k 8.1189
aCompounds with higher activity than that of the template molecule
CONCLUSIONS
In the present work, 62 HIV-1 IN inhibitors were studied by computer-aided
drug design processes,
i.e
., 3D-QSAR/Topomer CoMFA studies. The model was
favored by internal and external predictions and the statistics were convincing
and comparable. The model could not only be extrapolated to predict novel and
more potent inhibitors, but also the contour maps obtained from Topomer CoMFA
analyses provide a useful insight for structure-based design of new chemical
entities with high HIV-1 inhibitory activity. This study could serve as a basis for
the development of HIV-1 IN inhibitors.
Acknowledgments. We gratefully acknowledge support of this research by the basic
И З В О Д
ПРИМЕНАТЕХНИКЕПРЕТРАГЕ R-ГРУПЕНАМОЛЕКУЛСКИДИЗАЈНИНХИБИТОРА
HIV-1 ИНТЕГРАЗЕ
JIAN-BO TONG, MIN BAI и XIANG ZHAO
College of Chemistry and Chemical Engineering, Shaanxi University of Science & Technology, Xi’an 710021, China
Уовомрадујеустановљенаквантитативнарелацијатродимензионалнеструктуреи
активности (3D-QSAR) проучавањем 62 инхибитора HIV-1 интегразе (IN),коришћењем
методе Topomer CoMFA. Коефицијенти вишеструке корелације фитовања, унакрсне
валидације иекстерне валидације били су 0,942, 0,670, односно 0,748. Овирезултати
указујудадобијени Topomer CoMFA моделимаиповољнустабилностзапроцењивањеи
добруспособностпредвиђања. Topomer Search биојекоришћензапретрагу ZINC базе
податакана R групу. Каорезултат, добијенјениз R групасавеликимдоприносомактив
-ности. Филтрирањемпреконајпотентнијегмолекулаускупу, изабранесу 1 Ra групаи
21 Rb група. Употребилисмо 1 Ra групуи 21 Rb групудазамене Ra и Rb уузорку42.
Коначно, дизајнирали смо 21 ново једињењеи затим предсказали њихове активности
користећи Topomer CoMFA модел и нашли 10 новихједињења са активношћувећом
негопрототипнимолекул. Резултатисугеришудасетехника Topomer Search можеефи
-каснокориститизаскринингидизајнновихинхибитора HIV-1 IN, идаимадобруспо
-собностпредвиђањазадизајннових HIV/AIDS лекова.
(Примљено 26. августа, ревидирано 29. новембра, прихваћено 30. новембра 2015)
REFERENCES 1. A. S. Fauci, Science239 (1998) 617
2. F. J. Palella Jr., K. M. Delaney, A. C. Moorman, M. O. Loveless, J. Fuhrer, G. A. Satten, D. J. Aschman, S. D. Holmberg, N. Engl. J. Med. 338 (1998) 853
3. R. V. Patel, Y. S. Keum, S. W. Park, Eur. J. Med. Chem. 97 (2015) 649
4. J. P. Moore, S. G. Kitchen, P. Pugach, J. A. Zack, AIDS Res. Hum. Retroviruses 20
(2004) 111
5. J. L. Blanco, G. Whitlock, A. Milinkovic, G. Moyle, Expert Opin. Pharmacother. 16
(2015) 1313
6. R. Craigie, J. Biol. Chem. 276 (2001) 23213
7. W. G. Powderly, J. Antimicrob. Chemother.65 (2010) 2485
8. D. Esposito, R, Craigie, Adv. Virus Res. 52 (1999) 319
9. D. J. Hazuda, Braz. J. Infect. Dis. 14 (2010) 513
10. Y. Goldgur, F. Dyda, A. B. Hickman, T. M. Jenkins, R. Craigie, R. D. Davies, Proc. Natl. Acad. Sci. USA 95 (1998) 9150
11. S. Ray, Z. Fatima, A. Saxena, Mini-Rev. Med. Chem. 10 (2010) 147
12. V. Summa, A. Petrocchi, F. Bonelli, B. Crescenzi, M. Donghi, M. Ferrara, F. Fiore, C. Gardelli, O. G. Paz, D. J. Hazuda, P. Jones, O. Kinzel, R. Laufer, E. Monteagudo, E. Muraglia, E. Nizi, F. Orvieto, P. Pace, G. Pescatore, R. Scarpelli, K. Stillmock, M. V. Witmer, M. Rowley, J. Med. Chem.51 (2008) 5843
13. J. B. Tong, PhD Thesis, Shanxi University, Taiyuan, 2007
14. R. D. Cramer, J. Med. Chem. 46 (2003) 374
15. R. D. Cramer, D. E. Patterson, J. D. Bunce, J. Am. Chem. Soc.110 (1988) 5959
17. R. D. Cramer, F. Soltanshahi, R. Jilek, B. Campbell, J. Comput.-Aided Mol. Des. 21 (2007)
341
18. Z. J. Cheng, Y. Zhang, W. Z. Fu, Eur. J. Med. Chem. 45 (2010) 3970
19. E. Cichero, S. Cesarini, L. Mosti, P. Fossa, J. Mol. Model. 16 (2010) 1481
20. A. Golbraikh, A. Tropsha, J. Mol. Graphics Modell. 20 (2002) 269
21. M. Le Bret, J. Polanski, F. Zouhiri, L. Jeanson, D. Desmaele, J. d’Angelo, J. F. Mouscadet, R. Gieleciak, J. Gasteiger, J. Med. Chem. 45 (2002) 4647
22. L. Xu, X. G. Shao, Methods of Chemometrics. Science Press, Beijing, 2004, p. 166
23. L. Ståhle. S. Wold, J. Chemom. 1 (1987) 185
24. P. P. Roy, J. T. Leonard, K. Roy, Chemom. Intell. Lab. Syst. 90 (2008) 31