Enzymatic Oxidation of Cholesterol: Properties and
Functional Effects of Cholestenone in Cell Membranes
Maarit Neuvonen1, Moutusi Manna2, Sini Mokkila2, Matti Javanainen2, Tomasz Rog2, Zheng Liu3, Robert Bittman3, Ilpo Vattulainen2,4, Elina Ikonen1,5*
1Institute of Biomedicine, Anatomy, University of Helsinki, Helsinki, Finland,2Department of Physics, Tampere University of Technology, Tampere, Finland,3Department of Chemistry and Biochemistry, Queens College, The City University of New York, Flushing, NY, United States of America,4MEMPHYS – Center of Biomembrane Physics, University of Southern Denmark, Odense, Denmark,5Minerva Foundation Institute for Medical Research, Helsinki, Finland
Abstract
Bacterial cholesterol oxidase is commonly used as an experimental tool to reduce cellular cholesterol content. That the treatment also generates the poorly degradable metabolite 4-cholesten-3-one (cholestenone) has received less attention. Here, we investigated the membrane partitioning of cholestenone using simulations and cell biological experiments and assessed the functional effects of cholestenone in human cells. Atomistic simulations predicted that cholestenone reduces membrane order, undergoes faster flip-flop and desorbs more readily from membranes than cholesterol. In primary human fibroblasts, cholestenone was released from membranes to physiological extracellular acceptors more avidly than cholesterol, but without acceptors it remained in cells over a day. To address the functional effects of cholestenone, we studied fibroblast migration during wound healing. When cells were either cholesterol oxidase treated or part of cellular cholesterol was exchanged for cholestenone with cyclodextrin, cell migration during 22 h was markedly inhibited. Instead, when a similar fraction of cholesterol was removed using cyclodextrin, cells replenished their cholesterol content in 3 h and migrated similarly to control cells. Thus, cholesterol oxidation produces long-term functional effects in cells and these are in part due to the generated membrane active cholestenone.
Citation:Neuvonen M, Manna M, Mokkila S, Javanainen M, Rog T, et al. (2014) Enzymatic Oxidation of Cholesterol: Properties and Functional Effects of Cholestenone in Cell Membranes. PLoS ONE 9(8): e103743. doi:10.1371/journal.pone.0103743
Editor:Elena Papaleo, University of Copenhagen, Denmark
ReceivedApril 22, 2014;AcceptedJuly 1, 2014;PublishedAugust 26, 2014
Copyright:ß2014 Neuvonen et al. This is an open-access article distributed under the terms of the Creative Commons Attribution License, which permits unrestricted use, distribution, and reproduction in any medium, provided the original author and source are credited.
Data Availability:The authors confirm that all data underlying the findings are fully available without restriction. All relevant data are within the paper and its Supporting Information files.
Funding:This work was financially supported by the Academy of Finland project funds (257136 to M.N., 218066, 131489, 135050 to E.I.) and Academy of Finland Center of Excellence program (272130 to E.I. and I.V.), The European Research Council (Advanced Grant CROWDED-PRO-LIPIDS to I.V.), National Institutes of Health grant (HL083187 to R.B.), Sigrid Juselius Foundation grant (to E.I.), Finnish Medical Foundation grant (to E.I.), and Emil Aaltonen Foundation grant (to M.N.). The funders had no role in study design, data collection and analysis, decision to publish, or preparation of the manuscript.
Competing Interests:The authors have declared that no competing interests exist.
* Email: [email protected]
Introduction
Cholesterol is a vital constituent in the plasma membrane of higher eukaryotes, where it typically represents 25–40% of total lipids [1,2]. Cholesterol regulates biophysical membrane proper-ties such as fluidity, permeability, and rigidity. It interacts with neighbouring lipids and proteins via steric interactions and via hydrogen bonding through its 3b-hydroxyl group. The interac-tions between cholesterol and polar phospholipids can locally increase lipid order. This leads to the formation of dynamic membrane domains that contribute to the regulation of key cellular processes, such as receptor signaling, endocytosis and cell polarity [3,4].
To assess the functional importance of cholesterol, membrane cholesterol content is often reduced experimentally. Typically, cholesterol is extracted using methyl-b-cyclodextrin (MBCD), which can deplete up to 80–90% of plasma membrane cholesterol [5]. Another commonly used method is to expose the membrane to purified bacterial cholesterol oxidase (coase) [4,6–10]. Enzy-matic cholesterol oxidation and cholesterol removal by MBCD are often used interchangeably for cholesterol reduction but they act via different mechanisms; MBCD extrudes cholesterol from the
membrane, whereas coase catalyzes the conversion of up to,20% of cellular cholesterol to 4-cholesten-3-one (cholestenone) [7,11,12]. Cholesterol oxidizing bacteria can further catabolize cholestenone to use it as their nutritional hydrocarbon source. However, in mammals, cholestenone is metabolized primarily in the liver [13,14]. Therefore, once generated, cholestenone is likely to persist in extrahepatic mammalian cells.
In cholestenone, the steroid 3-hydroxyl group is replaced by a keto group, with a more limited capacity for hydrogen bonding than a hydroxyl group. Consequently, cholestenone preferentially localizes to liquid-disordered (Ld) domains in model membranes and causes lipid monolayer expansion [12,15,16]. While coase treatment is widely used to disturb cholesterol domains in cell membranes [4,7,10,17,18], the membrane partitioning and effects of choleste-none in the cellular context have so far received little attention.
In this study, we characterized the effects of coase treatment on membrane order and steroid mobility in primary human dermal fibroblasts (HDFs). The molecular interactions involved in cholestenone membrane partitioning and desorption from the membrane were addressed using atomistic simulations. Our data suggest that cholestenone is highly mobile in membranes and influences cholesterol flip-flop and efflux. Moreover, we provide
evidence that in contrast to MBCD induced cholesterol depletion cholesterol oxidation causes long-term functional defects in cells due to the persistence of cholestenone.
Results and Discussion
Cholesterol oxidation reduces membrane order and increases steroid flip-flop
To assess if coase treatment (Figure 1A) affects membrane fluidity in HDFs, we analysed the generalized polarization (GP) of the fluorescent probe Laurdan. Coase treatment at 37uC for 1 h converted approximately 20% of cellular cholesterol into choles-tenone. This treatment was compared to moderate or severe cholesterol depletion by MBCD, extracting ,25% or ,50% of
cellular cholesterol, respectively. We found that cholesterol oxidation and moderate MBCD-mediated cholesterol depletion resulted in a similar degree of GP reduction, while severe cholesterol depletion caused a larger decrease in GP (Figure 1B, C). Thus, the range of increase in membrane fluidity was roughly proportional to the level of cholesterol depletion (R2= 0.95). However, it is worth noting that MBCD treatment may also result in the extraction of other membrane lipids [5].
In line with GP measurements, atomistic molecular dynamics (MD) simulations in a raft-like bilayer (palmitoyl-oleyl phospha-tidylcholine (POPC): N-palmitoyl-sphingomyelin (PSM): choles-terol, molar ratio 2:1:1) predicted a substantial decrease in the ordering of the palmitoyl chain of POPC when 25% of cholesterol was replaced by cholestenone (Figure 1D). Interestingly, 25% replacement of cholesterol by cholestenone decreased palmitoyl chain ordering almost as much as complete replacement of cholesterol by cholestenone, indicating that cholestenone affects the ordering capability of the remaining cholesterol. However, all of the simulated raft-like membranes with a total of 25 mol% steroid were more ordered than a liquid-disordered bilayer (Figure 1D). In addition, the replacement of cholesterol by cholestenone had a minor effect on the lateral diffusion of PSM, increasing it at short times (Figure S1).
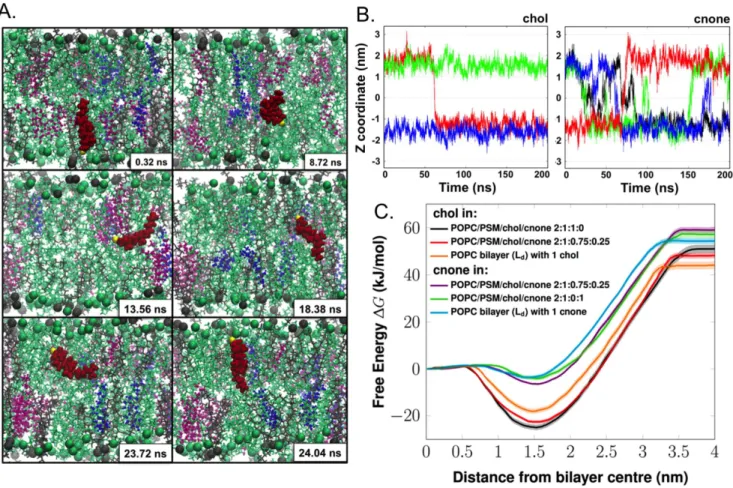
Atomistic MD simulations were also used to analyse how cholestenone affects the movement of the steroid molecules between membrane leaflets. One of the most striking observations was the frequent occurrence of inter-leaflet movements or flip-flop motions of cholestenone molecules (Figure 2A, B). In contrast to cholestenone, cholesterol exhibited a very stable vertical position along the bilayer normal, with rare flip-flops (Figure 2B). The increased flip-flop rate of cholestenone is in accordance with its decreased hydrogen-bonding capacity compared with that of cholesterol (Table 1).
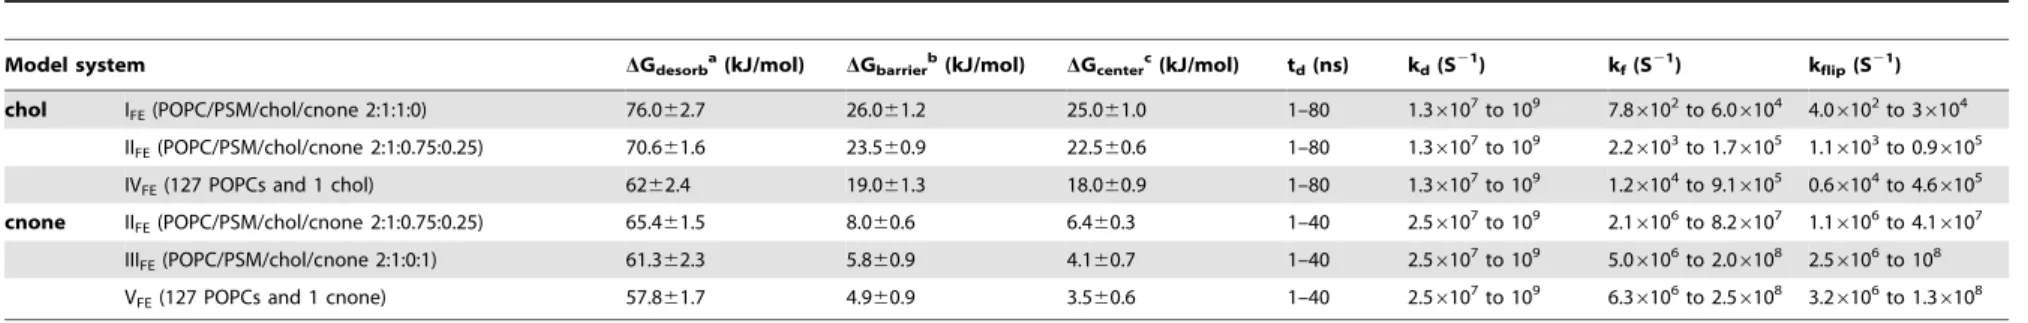
To gain a more quantitative view of the steroid inter-leaflet movements, we performed free energy calculations using umbrella sampling [19]. The free energy profiles are shown inFigure 2C, and the free energy values associated with these processes in
Table 2. The results obtained for cholesterol are in agreement with previous studies [20–22]. The free energy of both steroids had a minimum at the equilibrium position (with oxygen located at the bilayer interface) and increased toward the bilayer center as well as toward bulk water (Figure 2C).
The difference in the flip-flop movements of cholesterol and cholestenone was reflected in their free-energy values. We found that the free energy barrier for cholestenone flip-flop was about four times lower than that of cholesterol (Figure 2C, Table 2). Consequently, cholestenone flip-flop took place on a nanosecond timescale, whereas cholesterol flip-flop occurred on a timescale of microseconds to milliseconds (Table 2). Also, the flip-flop rate of cholesterol was increased 3-fold in the presence of cholestenone,
whereas cholestenone flip-flop was consistently fast and less dependent on other membrane lipids (Table 2). Increased flip-flop is likely to decrease the lateral pressure and increase elasticity of the membrane [23,24]. No pore formation was observed, unlike in flip-flops of phospholipids [25,26].
Atomistic simulations predicted that cholestenone desorbs from the membrane to the water phase more readily than cholesterol. In a raft-like membrane containing a mixture of cholesterol and cholestenone, the free energy barriers for desorption were 70.6 and 65.4 kJ/mol for cholesterol and cholestenone, respectively. In a Ldmembrane, the corresponding values were 62 and 57.8 kJ/ mol. The simulations thereby showed a consistent 7.3% reduction in the free energy barrier for cholestenone compared with cholesterol, suggesting that cholestenone fluxes from the mem-brane more easily than cholesterol.
Cholestenone is transferred from HDFs to extracellular acceptors more readily than cholesterol
To study if cholestenone is released more avidly than cholesterol from biological membranes, we analysed the efflux of radiolabeled cholesterol and cholestenone from HDFs. For this purpose, HDFs were labeled with [14C]cholesterol for 42 h, and then oxidized with coase (10 U/ml) for 1 h to produce [14C]cholestenone. This resulted in the oxidation of 17.462.7% of [14C]cholesterol. In control experiments, cells were either mock treated or treated with 0.5 mM MBCD to deplete,25% of [14C]cholesterol. The efflux of radiolabeled cholesterol and cholestenone from HDFs was analysed after 4 h of chase in a buffer containing either Apolipoprotein A-I (ApoA-I) or bovine serum albumin (BSA) as lipid acceptors (Figure 3A).
We observed that [14C]cholestenone underwent efflux from HDFs much more efficiently than [14C]cholesterol: the efflux of [14C]cholestenone to ApoA-I was,2.5 times higher than that of
[14C]cholesterol from control cells (Figure 3B). The difference was even more pronounced when BSA was used as the acceptor, with the proportion of [14C]cholestenone delivered to BSA being roughly 5 times higher than that of [14C]cholesterol in control cells (Figure 3C). Interestingly, the efflux of [14C]cholesterol to ApoA-I or BSA was markedly reduced in coase-treated cells, while MBCD pretreatment did not affect this: Approximately 5% of [14C]cholesterol was released to ApoA-I and ,2% to BSA in
control and MBCD-treated cells; instead, when cells were pretreated with coase, only 1% of [14C]cholesterol was transferred to ApoA-I or BSA (Figure 3B, C).
Thus, cholestenone was more readily transferred from HDF membranes to extracellular acceptors than cholesterol. Moreover, introduction of cholestenone into the membrane inhibited the release of cholesterol to extracellular acceptors. This is in apparent contradiction to our simulation results where the presence of cholestenone rather facilitated cholesterol desorption (Table 2). The reason for this difference is not clear, but one possibility is that the reduced cholesterol efflux in coase treated cells results from oxidation of cholesterol in domains that are only slowly replenished via protein dependent pathway(s). For instance, the key cholesterol efflux protein ABCA1 may play a role in transferring cholesterol to less packed domains susceptible to oxidation. This would be in line with the finding that ABCA1 activity increases cholestenone production by coase [27,28].
Partitioning of cholestenone and BODIPY-cholestenone in cellular membranes
fractions using sucrose gradient centrifugation. This showed that the distributions of [14C]cholesterol and [14C]cholestenone were similar apart from the slight preference of [14C]cholestenone for lower density fractions, as evidenced by its relative enrichment in the top fraction containing lipid droplets (LDs, enriched in
[14C]cholesteryl esters) and depletion in the bottom fraction, as compared to [14C]cholesterol (Figure 4A).
To visualize how the removal of cholesterol’s 3b-hydroxyl group affects lipid mobility in cell membranes, we synthesized a fluorescently labeled analogue, BODIPY-cholestenone (Bpy-cho-Figure 1. Cholesterol oxidation decreases membrane order.A) Structures of cholesterol and cholestenone. B) HDFs were treated at 37uC with coase (10 U/ml; 1 h), MBCD (0.5 mM; 5 min or 5 mM; 1 h) or buffer only (ctrl). Cells were labeled with Laurdan, fixed, imaged with a 2-photon microscope and GP images were generated. C) Average GP values calculated from the Laurdan GP data represent three independent experiments; n = 59 fields,.300 cells per condition; ***P,0.0005. The fraction of cholesterol remaining in cells after the treatments is indicated. D) The order parameters |SCD|, from MD simulations of the palmitoyl tail of POPC molecules in various lipid bilayers. The liquid-ordered (Lo) systems were POPC/
PSM/cholesterol/cholestenone 2:1:1:0, POPC/PSM/cholesterol/cholestenone 2:1:0.75:0.25, POPC/PSM/cholesterol/cholestenone 2:1:0:1, and the liquid-disordered (Ld) systems were with 1 chol in a POPC bilayer and 1 cholestenone in a POPC bilayer. Carbon numbering starts from carbons close to the
glycerol group.
doi:10.1371/journal.pone.0103743.g001
Cholestenone Induced Membrane Alterations
lestenone) (Figure 4B). In this lipid, the hydroxyl group of the earlier characterized sterol analogue BODIPY-cholesterol (Bpy-cholesterol; [29]) is replaced by a keto group, and the position of the 5,6-double bond is changed to a 4,5-double bond, as in native
cholestenone. The trafficking of Bpy-cholesterol and Bpy-choles-tenone was compared in living HDFs upon labeling from MBCD-Bpy-lipid complexes. Bpy-cholesterol was localized mainly in the plasma membrane directly after labeling (Figure 4C) and from Figure 2. Transbilayer mobility of cholestenone and cholesterol.A) Snapshots showing the spontaneous flip-flop motion of a cholestenone molecule during MD simulation in the raft-like system POPC/PSM/cholesterol/cholestenone 2:1:0.75:0.25. POPC and PSM are shown as green and grey lines, respectively, with head-group phosphorus atoms as spheres. Cholesterol (chol) and cholestenone (cnone) are shown as magenta and blue ball-and-stick representation, respectively. The particular cholestenone undergoing flip-flop is highlighted as red van der Waals spheres and its 3-keto oxygen atom is shown in yellow. B) Time scale and frequency of flip-flops by cholesterol and cholestenone. Time evolution of the Z-coordinate of the head group oxygen atom of cholesterol (i) and cholestenone (ii) along the bilayer normal in the system POPC/PSM/chol/cholestenone 2:1:0.8:0.2. The Y-axis zero indicates the center of the bilayer. Different colors show different cholesterol or cholestenone molecules. The figures highlight how different the flip-flop rates of cholesterol and cholestenone are: while cholesterol undergoes only a single quick flip-flop event, cholestenone undergoes a large number of flip-flops during the same period. Yet the concentration of cholesterol was four times higher than that of cholestenone. C) The potential of mean forces (kJ/mol) of cholesterol and cholestenone in a variety of lipid bilayer models (shown by dark lines), either in the liquid-disordered (Ld) or liquid-ordered (Lo) phase. The transparent area following each PMF curve represents the corresponding statistical errors.
doi:10.1371/journal.pone.0103743.g002
Table 1.Average number of hydrogen bondsa(H-bonds) and charge pairsbformed by steroids with the surrounding lipids and
water.
System H-bonds with lipids H-bonds with water Charge pairs
chol cnone chol cnone chol cnone
IMD(POPC/PSM/chol/cnone 2:1:1:0) 0.37 (0.17/0.20)* - 1.66 - 0.61
-IIMD(POPC/PSM/chol/cnone 2:1:0.8:0.2) 0.35 (0.18/017)* 0.04 1.67 0.53 0.60 0.46
*(per POPC, or per PSM).
aThe presence of H-bonds was evaluated based on distance and angle criteria: the donor- acceptor distance had to be less than or equal to 0.325 nm, and the angle
between the vector linking a donor and an acceptor, and the vector describing the chemical bond between hydrogen and a donor had to be less than or equal to 35u. bThe existence of charge pairs was determined using the distance cut-off of 0.4 nm.
Errors are less than 0.01.
there, transported to intracellular compartments as described [29,30], becoming concentrated in the perinuclear area at 2 h post labeling ( Figure 4C ). In contrast, the vast majority of Bpy-cholestenone was observed in intracellular compartments imme-diately after labeling and remained in these structures ( Fig-ure 4C ). This compartment was identified as LDs by co-labeling with BODIPY558/568-C12 ( Figure 4C ). Bpy-cholesterol also colocalized with LDs to some extent, but less prominently than Bpy-cholestenone. These data indicate that the 3 b -hydroxyl group is critical for the intracellular trafficking of the Bpy-sterol. The prominent LD localization of Bpy-cholestenone compared to the
Table 2.Thermodynamics and kinetics associated with cholesterol/cholestenone flip-flop and desorption.
Model system DGdesorba(kJ/mol) DGbarrierb(kJ/mol) DGcenterc(kJ/mol) td(ns) kd(S21) kf(S21) kflip(S21)
chol IFE(POPC/PSM/chol/cnone 2:1:1:0) 76.062.7 26.061.2 25.061.0 1–80 1.36107to 109 7.86102to 6.06104 4.06102to 36104
IIFE(POPC/PSM/chol/cnone 2:1:0.75:0.25) 70.661.6 23.560.9 22.560.6 1–80 1.36107to 109 2.26103to 1.76105 1.16103to 0.96105
IVFE(127 POPCs and 1 chol) 6262.4 19.061.3 18.060.9 1–80 1.36107to 109 1.26104to 9.16105 0.66104to 4.66105
cnone IIFE(POPC/PSM/chol/cnone 2:1:0.75:0.25) 65.461.5 8.060.6 6.460.3 1–40 2.56107to 109 2.16106to 8.26107 1.16106to 4.16107
IIIFE(POPC/PSM/chol/cnone 2:1:0:1) 61.362.3 5.860.9 4.160.7 1–40 2.56107to 109 5.06106to 2.06108 2.56106to 108
VFE(127 POPCs and 1 cnone) 57.861.7 4.960.9 3.560.6 1–40 2.56107to 109 6.36106to 2.56108 3.26106to 1.36108
a
DGdesorbis the free energy barrier for desorption from membrane to water phase. bDG
barrieris the free energy barrier for flip-flop.
cDGcenteris the difference in free energy between the bilayer center (Zcenter) and the equilibrium position (Zeq). The parameters kd, kf, kflip, and tdare defined and discussed in Materials and Methods.
modest LD affinity of [14C]cholestenone suggests that the hydrophobic Bpy-moiety largely drives the LD localization of the fluorescent derivative lacking the 3b-hydroxyl group.
We also studied the removal of the Bpy-lipids from HDFs to extracellular acceptors. At 4 h of incubation in serum-containing medium, ,50% of Bpy-cholesterol fluorescence was retained in
the cells, whereas only,25% of Bpy-cholestenone was retained (Figure 4D). This shows that Bpy-cholestenone was more efficiently effluxed from cells than Bpy-cholesterol, analogously to the radiolabeled sterols.
Cholestenone generated upon cholesterol oxidation restrains cell migration
To assess how persistent the cholesterol manipulations in coase-vs. MBCD-treated HDFs were, we analysed the cellular
choles-terol and cholestenone content after the treatments. This showed that cells treated with MBCD recovered their cholesterol content within 3 h (Figure 5A). In contrast, in coase treated cells cholestenone and the accompanying cholesterol reduction persist-ed at 3 h as well as at 22 h post oxidation(Figure 5A).
The long-lasting effects of coase treatment make it a potential tool for analysing its functional consequences in the time scale of hours to days. We have recently reported that cholesterol is transported to the plasma membrane to support cell migration [31]. We therefore compared how coase and mild MBCD treatment causing ,25% cholesterol depletion affected HDF
migration in a wound-healing assay. We found that the migration of coase treated cells was reduced by ,65% in comparison to
MBCD or mock treated cells (Figure 5B, C). To rule out the possibility that residual cell associated cholesterol oxidase or Figure 4. Intracellular trafficking of cholesterol and cholestenone.A) RAW 264.7 macrophages prelabeled with [14C]cholesterol for 18 h were
treated with 10 U/ml coase for 2 h. The post-nuclear supernatant was subjected to sucrose gradient fractionation. A total of 7 fractions was collected and analysed for radiolabeled [14C]cholesterol, -cholestenone, and -cholesteryl ester content. Inset: Percentage of [14C]cholesterol and -cholestenone in the lowest density fraction 1; n = 4. *P,0.05. B) Structures of Bpy-cholesterol (Bpy-chol) and Bpy-cholestenone (Bpy-cnone). C) HDFs were pulse labeled with the indicated Bpy-lipids for 8 min, and the cells were imaged by confocal microscopy during 2 h of chase. To visualize LDs, cells were pulse labeled for 1 h with Bpy568-C12 (5mM) and Bpy-lipid (1mM), and imaged after a 1 h chase. Scale bars 10mm. D) HDFs were pulse labeled with
Figure 5. Coase treatment or cholestenone impairs fibroblast migration in a wound-healing assay.A) Confluent HDFs were treated with coase (10 U/ml; 1 h), MBCD (0.5 mM; 5 min), or mock treated (ctrl) and collected for lipid extraction at the indicated time points. Cholesterol and cholestenone amounts were determined; n = 8–16. B) HDFs were treated as in A, and wounded with a pipette tip. Cells were fixed at the indicated time points, stained with Alexa568-phalloidin and imaged. Scale bars 20mm. C) Cell migration area was quantified at 22 h post treatments; n = 11–15
fields. D) HDFs were incubated with MBCD-cholestenone (MB-CN) complex, collected for lipid analysis and cholesterol and cholestenone amounts Cholestenone Induced Membrane Alterations
putative unspecific oxidation products cause the defective cell migration we exchanged ,20–30% of cellular cholesterol to
cholestenone from MBCD-cholestenone complex (Figure 5D). The cholesterol/cholestenone content and migration of cells were then assessed at 22 h. This showed that cholestenone remained in cells (Figure 5D) and that cell migration was reduced by up to 90% (Figure 5E). This strengthens the argument that cell migration is inhibited by cholestenone rather than by some other coase effect.
Defective lamellipodial formation in cholestenone containing cells
We noted that the coase-treated cells extended long filopodia-like protrusions toward the wounded area (Figure 6A). To elucidate some of the early changes accompanying the non-migratory phenotype of coase-treated cells, we analysed actin in HDFs at 3 h post wounding. Phalloidin staining revealed that in coase treated cells the actin rich protrusions at the leading edge were very narrow and spindle shaped, whereas control and MBCD-treated cells exhibited prominent well spread lamellae (Figure 6C). At this time point, the average width of the lamellipodium in coase-treated cells was reduced by over 50% (Figure 6B). Lamellipodium spreading depends on the actin branch point complex Arp2/3 [32]. We found that the Arp2/3 complex component ARPC2 was efficiently recruited to the lamellipodia of control and MBCD-treated cells at 3 h post treatment (Figure 6C). In contrast, the coase-treated cells displayed a prominent cytosolic ARPC2 staining, and reduced immunostaining at the leading edge (Figure 6C). These results suggest that actin dynamics is aberrantly regulated in the presence of cholestenone. This agrees with earlier reports showing that coase treatment affects the diffusion of membrane lipids and proteins in an actin dependent manner [4,7].
An interesting question is how precisely cholestenone perturbs actin dynamics. As there is no evidence of direct steroid-actin interaction, it seems likely that cholestenone acts via other membrane lipids, such as phosphoinositides (PIPs). PI(4,5)P2and PI(3,4,5)P3 regulate lamellipodia formation through binding to actin interactors, such as WAVE/WASP complex proteins that also regulate the activity of the Arp2/3 complex [33]. Interest-ingly, PI(3,4,5)P3 production is specifically needed for lamellipo-dial spreading during fibroblast migration [34], suggesting that coase treatment might interfere with PI(3,4,5)P3generation. In the future it will be interesting to address the effects of cholestenone on PIPs and their modifying enzymes, to further elucidate how cholestenone perturbs membrane lipids and proteins.
In summary, this study shows that bacterial cholesterol oxidase treatment results in pronounced changes in cell membrane organization. Cholestenone decreases membrane order, undergoes rapid transbilayer movements, desorbs from the membrane more readily than cholesterol and influences cholesterol flip-flop and efflux. In addition, we demonstrate that cholesterol oxidase treatment results in long-term perturbation in cell motility, a process that is highly dependent on membrane lipid composition. This defect appears to be due to the generated cholestenone that persists in cell membranes, affecting e.g. actin regulatory proteins involved in the formation of cell protrusions. Considering that the effect of cyclodextrin mediated cholesterol reduction is reversed within a few hours, the longer-term effects of cholestenone may be
useful in instances where an acute cholesterol manipulation is desired to produce prolonged cellular effects.
Materials and Methods
Cells and media
Primary HDFs (AG08498 from Coriell Cell Repositories) were grown in DMEM (Lonza) supplemented with 10% non-heat inactivated fetal bovine serum (FBS) (Gibco), 100 U/ml penicillin and streptomycin, and 2 mM L-glutamine.
Coase and MBCD treatments
For cholesterol oxidation, cells were incubated in Dulbecco’s phosphate buffered saline, calcium, magnesium (Gibco), 10 mM Hepes (pH 7.3), glucose (1 g/l) (DPBS+) containing 10 U/ml coase (Streptomyces sp., Calbiochem) for 1 h at 37uC. For moderate cholesterol depletion, cells were subjected to 0.5 mM MBCD (Sigma) for 5 min at 37uC, and for more extensive cholesterol extraction, to 5 mM MBCD for 1 h at 37uC. For cholesterol/cholestenone exchange, cells were treated with 0.5 mM MBCD-cholestenone complex (MBCD/cholestenone 6:1) for 15 min at 37uC.
Biochemical lipid analysis
Lipids were extracted according to Bligh and Dyer [35] and separated on HP-TLC by using hexane/diethyl ether/acetic acid (80:20:1) as the running solvent. Lipids were visualised by dipping the TLC plate in 3% CuSO4, 8% H2PO4and charring. Lipids were identified based on standards, and the signal intensity was quantified using ImageJ software. Cholestenone was the only product detected in cells treated by coase (Figure S2A). Radiolabeled lipids were scraped from the TLC plate according to lipid standards directly into Optiphase ‘Hisafe’ 3 scintillation cocktail (Perkin Elmer) and quantified by scintillation counting. No radioactivity above background was detected outside the choles-terol and cholestenone regions, except for a low signal corre-sponding to cholesteryl esters, suggesting that [14C]cholesterol and [14C]cholestenone are not catabolized in fibroblasts.
LD isolation
RAW 264.7 macrophages were grown in DMEM, 10% FBS, 10 mM Hepes (pH 7.3). Two 75 cm2 flasks of RAW 264.7 macrophages were loaded with 400mM oleic acid –BSA complex and labeled with 0.1mM 4-[14C]cholesterol (specific activity, 53.0 mCi/mmol, Perkin Elmer) for 18 h in DMEM, 10% FBS, 10 mM Hepes (pH 7.3). Cells were washed twice with PBS and treated with 10 U/ml coase for 2 h 37uC in DPBS+ or mock treated in buffer only. Cells were collected in PBS, and lysed in 1.7 ml of hypotonic lysis buffer (HLB) [20 mM Tris–HCl, pH 7.4; 1 mM EDTA] including a protease inhibitor mixture (chymosta-tin, leupep(chymosta-tin, antipain, and pepstatin A; 20mg/ml each) on ice. The lysate was centrifuged at 4uC, 10006g for 10 min to remove the nuclei. Then, 1.3 ml of the supernatant was mixed with 0.65 ml of 60% sucrose solution to reach a final concentration of 20% sucrose. The samples were transferred to SW50 tubes, and overlaid with 1.7 ml 5% sucrose in HLB and 1.3 ml HLB. The samples were centrifuged for 2 h at 28 0006g, and the LD fraction was recovered from the top of the gradient by using a tube slicer; six additional fractions were collected and the fractions were immediately used for lipid extraction.
were determined; n = 6–12. E) HDFs were treated with MB-CN complex as in D, wounded with a pipette tip and incubated in serum-free buffer for 22 h. Cells were stained with Alexa568-phalloidin and the wound area was imaged.
Preparation of BODIPY-lipid/MBCD complex
Bpy-cholestenone was prepared via a ruthenium-catalyzed Oppenauer-type oxidation [36] of Bpy-cholesterol by the following procedure. A solution of Bpy-cholesterol (3.3 mg, 5.7mmol) in
2 ml of acetone was purged with nitrogen for 10 min. The commercially available Shvo catalyst (2.0 mg, 1.8mmol) was
quickly added, and the resulting solution was heated at reflux
(56uC) with stirring under nitrogen for 4 h. After the reaction mixture was cooled to room temperature, the solvent was removed under reduced pressure. The residue was purified by flash chromatography (hexane/EtOAc 5:1 to 4:1) on silica gel to afford 1.3 mg (40% yield) of Bpy-cholestenone and 0.8 mg (24% yield) of BODIPY-cholest-4-en-3,6-di-one, which were eluted in separate fractions. Data for Bpy-cholestenone: 1H NMR (500 MHz, Figure 6. Defective lamellipodial spreading of migrating coase treated cells.A) HDFs were treated, wounded and stained with phalloidin as in Figure 5. B) The width of the lamellipodium was measured from control, MBCD and coase treated cells. Data represent 4 biological replicates per condition; n = 172–228 cells. C) Cells were fixed at 3 h post wounding and stained with fluorescent phalloidin, and anti-Arp2/3 complex component ARPC2 antibody, followed by secondary fluorescent antibody and imaging by confocal microscopy. Please note comparable image acquisition and display in Arp2/3 panels; inset with increased brightness demonstrates the largely cytoplasmic staining pattern of Arp2/3 in coase treated cells. Scale bars, 10mm.
doi:10.1371/journal.pone.0103743.g006
Cholestenone Induced Membrane Alterations
CDCl3) d0.75 (s, 3H), 0.80–1.88 (m, 25H), 1.99–2.09 (m, 2H), 2.24–2.42 (m, 2H), 2.43 (s, 6H), 2.52 (s, 6H), 2.72 (dt, J= 2.7, 12.8 Hz, 1H), 3.15 (dt,J= 5.7, 12.8 Hz, 1H), 5.73 (s, 1H), 6.05 (s, 2H); ESI-HRMS (M+H2HF)+
calcd for C36H49BFN2O+ 555.3923, found 555.3925. Data for BODIPY-cholest-4-en-3,6-di-one:1H NMR (500 MHz, CDCl3)d0.75 (s, 3H), 0.80–1.80 (m, 19H), 1.84–1.95 (m, 3H), 1.99–2.07 (m, 1H), 2.11–2.18 (m, 2H), 2.43 (s, 6H), 2.47–2.49 (m, 1H), 2.52 (s, 6H), 2.67 (dd, J= 4.0, 16.0 Hz, 1H), 2.73 (dt, J= 3.1, 12.8 Hz, 1H), 3.16 (dt, J= 5.6, 12.8 Hz, 1H), 6.05 (s, 2H), 6.17 (s, 1H); ESI-HRMS (M+H)+
calcd for C36H48BF2N2O2+589.3778, found 589.3774.
Bpy-cholesterol was synthesized as described [37]. 370 mM MBCD solution was added to Bpy-cholesterol and Bpy-choleste-none in a 100:1 molar ratio. The Bpy-lipids were solubilized by bath sonication for 665 min at 37uC, and undissolved Bpy-lipids were removed by centrifugation (15 min, 16 0006g). The complexes were stored at 4uC and used within 2 weeks of preparation.
Fluorescence imaging
Bpy-cholesterol and Bpy-cholestenone were incorporated into HDFs by incubating the cells for 8 min with 0.18 mM MBCD complexed with the lipid. Cells were washed twice with PBS and immediately imaged with a Leica SP2 confocal microscope (Leica Microsystems) with 636(NA = 0.90) water dipping objective, in CO2 independent medium (Gibco) containing 10% FBS. Fluo-rescent lipids were extracted and separated by HP-TLC using hexane/ethyl acetate 4:1 running buffer and visualised by a FLA-900 imager (GE Healthcare) with 488 nm wavelength. Based on HP-TLC, no major catabolic products were generated from either Bpy-cholesterol or Bpy-cholestenone (Figure S2B). For LD detection, cells were co-labeled with 5mM BODIPY558/568-C12 (Life Technologies) and 1mM Bpy-cholesterol or 1mM Bpy-cholestenone in DMEM containing 0.2% DMSO for 1 h. Cells were imaged live after a 1 h chase. For immunofluorescence microscopy, cells were fixed at room temperature with 4% paraformaldehyde (PFA), and permeabilized with 0.1% Triton X-100 for 5 min. Cells were stained in 10% FBS in PBS by incubating with primary antibodies at 4uC overnight, then with secondary antibodies for 45 min at 37uC, and finally mounted in Mowiol containing 2.5% 1,4-diazabicyclo[2.2.2]octane. Confocal images were acquired with a Leica TCS SP8 confocal microscope (Leica Microsystems), with 406 (NA = 1.1) water or 606 (NA = 1.3) glycerol objectives. Anti-ARPC2 was purchased from Upstate (p34Arc) (07-277).
Efflux assays
Bpy-lipids were incorporated into HDFs from a MBCD complex as above. To analyse the efflux of Bpy-lipids, cells were washed twice with PBS and immediately lysed in 1% NP-40, or incubated for 4 h in DMEM, 10% FBS, washed twice, and lysed. Bpy-fluorescence was measured using a Victor microplate reader (Perkin Elmer). To analyse the efflux of radiolabeled lipids, HDFs were labeled with 0.2mCi/ml 4-[14C]cholesterol for 42 h in DMEM, 10% FBS. Cells were washed with PBS to remove excess label, and treated with coase and MBCD as described above. Cells were then washed and incubated in DPBS+containing 10mg/ml ApoA-I or 0.2% BSA for 4 h. Cells and media were collected and lipids were extracted and analysed by HP-TLC.
Wound-healing assay
Confluent HDF monolayers were scratched with a pipette tip. Cells were incubated in DPBS+, fixed at the indicated time points, stained with Alexa568-phalloidin (Molecular probes) and imaged
with an AX70 epifluorescence microscope (Olympus) equipped with an Olympus DP71 CCD camera using a 46 objective. Images were analysed with ImageJ software by thresholding and automatically measuring the wound area. The migration area was calculated as the difference between the wound area at 0 h and 22 h post wounding.
Generalized polarization analysis
GP is described as: (I400–4602I470–530)/(I400–460+I470–530). Cells were labeled with 5mM Laurdan in serum-free DMEM
for 45 min at 37uC, washed, and fixed in 4% PFA. Mounted coverslips were imaged with a Leica TCS SP8 confocal microscope, with 636 (NA = 1.3) glycerol objective, by two-photon imaging. Laurdan was excited at 800 nm and emission was recorded at 400–460 and 470–530 nm. The images were analysed with ImageJ software by using a GP analysis macro provided in [38] and corrected for G factor obtained from measuring Laurdan emission in pure DMSO [38]. The resulting images were generated as a merge of Laurdan fluorescence intensity in ordered channel and GP value in the corresponding pixel. Data were normalized to an average GP value of control samples from different experiments.
Statistical analysis
Student’s t-test was used for statistical analysis. Data are reported as mean+/2standard error of mean (SEM).
Atomistic simulations and analysis of simulation data We studied two raft-like lipid bilayers through unbiased MD simulations (Table 3). One of them was composed of 256 POPC, 128 PSM, and 128 cholesterol (chol) molecules (POPC/PSM/ cholesterol/cholestenone; molar ratio of 2:1:1:0) (system IMD). In the other, part of cholesterol molecules were replaced with cholestenone, and this system contained 256 POPC, 128 PSM, 102 cholesterol, and 26 cholestenone (cnone) molecules (POPC/ PSM/cholesterol/cholestenone; molar ratio of 2:1:0.8:0.2) (system IIMD). Both bilayers were hydrated with approximately 30000 water molecules. The initial membrane structures were obtained from our previous study [39]. To parameterize the interactions in the systems, for lipid molecules we used the all-atom optimized potentials for liquid simulation (OPLS) force field [40], following our previous works [41,42]. This set of charges was derived in compliance with the OPLS methodology. For water, we employed the TIP3P model, which is compatible with the OPLS parame-terization [43].
In free energy (FE) calculations with the umbrella sampling technique [19] we used the same protocol as in unbiased MD simulations. However, because of a large computational cost of FE calculations, the system size was reduced to one-fourth of that used inTable 3. The bilayers studied for FE computations were: (i) system IFE– composed of 64 POPC, 32 PSM, and 32 cholesterol molecules (POPC:PSM:cholesterol:cholestenone 2:1:1:0), (ii) sys-tem IIFE– composed of 64 POPC, 32 PSM, 24 cholesterol, and 8 cholestenone lipids (POPC:PSM:cholesterol:cholestenone; molar ratio of 2:1:0.75:0.25), and (iii) system IIIFE – in this bilayer cholesterol was completely replaced by cholestenone and it contained 64 POPC, 32 PSM, and 32 cholestenone molecules (POPC:PSM:cholesterol:cholestenone; molar ratio of 2:1:0:1). In addition to liquid-ordered (Lo) membranes, we also simulated two liquid-disordered (Ld) bilayers containing 127 POPC molecules with either one cholesterol (system IVFE) or one cholestenone (system VFE) present in one of the two leaflets.
Before the FE calculations commenced, all bilayers were simulated for 100 ns, of which the first 20 ns was considered as equilibration and the rest of these data were used for analysis. We then calculated the free energies of translocation (flip-flop) of steroid molecules from their equilibrium position to the bilayer center and further to the other leaflet, as well as the FE of steroid desorption from a bilayer to the water phase. In these calculations, we restrained the hydroxyl group of cholesterol and the ketone oxygen of cholestenone together with three adjacent ring carbon atoms for each steroid with respect to the center of mass of the membrane, applying a harmonic restraint with a force constant of 750 kJ mol21nm22. In each adjacent window, cholesterol/ cholestenone was moved by 0.1 nm in the direction normal to the bilayer, with a total of 41 simulations to sample the entire reaction coordinate. The windows were run for 50–100 ns. The potential of mean force was calculated by the weighted histogram analysis method (WHAM) [48], using the g_wham tool imple-mented in GROMACS. The statistical errors were estimated with bootstrap analysis [48].
The conformational ordering of lipid acyl chains was charac-terized by the order parameter SCD=K,3 cos2h21., wherehis the angle between the C–H bond vector and the membrane normal. The angular brackets indicate averaging over time and lipids. The largest value of 0.5 corresponds to full conformation order (all-trans), while values close to zero describe a situation with no conformational order (disordered acyl chains). The overall shape of our order parameter profile, including the dip at smaller
carbon numbers, is in qualitative agreement with the previous NMR-derived order parameter profile for POPC lipid [49].
The presence of hydrogen bonds was evaluated based on distance and angle criteria: the donor- acceptor distance had to be less than or equal to 0.325 nm, and the angle between the vector linking a donor and an acceptor, and the vector describing the chemical bond between hydrogen and a donor had to be less than or equal to 35u. The existence of charge pairs was determined using the distance cut-off of 0.4 nm. The geometric criterion used in hydrogen bond and charge-pair estimation was derived from our previous work [50].
The rates of cholesterol and cholestenone flip-flop were calculated using the equationkf=kd6exp (2DGcenter/RT), where DGcenteris the difference in free energy between the bilayer center (Zcenter) and the equilibrium position Zeqthat is the position of the free energy minimum. Then kfis the rate constant to move from Zeqto Zcenter, and kdis the rate constant with which a molecule returns from Zcenterto Zeqin terms ofkd= 1/td. Here the time tdis the estimated time-range for steroid molecules to move from Zcenter to Zeq. This can be estimated by releasing the harmonic restraint on a steroid at Zcenter, and then computing the time that it takes to return back to Zeq. Instead of attempting a more rigorous estimation, a time range of 1–80 ns was used for cholesterol (considering the previous report on cholesterol flip-flop in different bilayer membranes, including raft-mimicking environments [20]). The same value was used for cholesterol in all bilayers. For cholestenone, a time range of 1–40 ns was used for all bilayers (the time range was based on present findings and an earlier report by Ro´g et al. [51]). Since a complete flip-flop event involves the rate to move from bilayer equilibrium to the center (kf) and then from the center to the opposite leaflet (kd), the rate constant of flip-flop is expressed askflip=K61/[kf21+kd21]<kf/2.
Supporting Information
Figure S1 The mean-squared displacement (MSD) of
palmitoyl-sphingomyelin (PSM) in the membrane plane.
The lipid compositions of the studied systems differed with respect to cholesterol/cholestenone as indicated. The black line represents the lateral displacement of PSM in the raft-like bilayer containing 25% cholesterol, while the red line represents the corresponding MSD data when all membrane cholesterol was replaced by cholestenone. In the calculation of the MSD, the first 20 ns were removed from the simulation trajectory. Mean-squared displace-ment (MSD) of single-lipid motion for PSM was calculated: Table 3.Lipid compositions for all the bilayersaused in the present work.
System POPC PSM Cholesterol Cholestenone Phase Area per lipidb(A˚2)
IMD 256 128 128 0 Lo 59.3160.57
IIMD 256 128 102 26 Lo 59.2060.53
IFE 64 32 32 0 Lo 59.0160.91
IIFE 64 32 24 8 Lo 58.9661.01
IIIFE 64 32 0 32 Lo 57.9561.37
IVFE 127 0 1 0 Ld 68.7561.23
VFE 127 0 0 1 Ld 68.1161.33
aThe subscripts ‘‘MD’’ refer to the systems studied only by regular (unbiased) molecular dynamics simulations, thus they were not used in free energy calculations. The
subscripts ‘‘FE’’ refer to the systems used for free energy calculations. Loand Ldstand for liquid-ordered and liquid-disordered phases, respectively. bArea per lipid calculated by dividing the time averaged total area of each simulation system by the number of lipids per leaflet.
The numbers of each lipid in a given system, the phase, and the area per lipid are indicated. doi:10.1371/journal.pone.0103743.t003
Cholestenone Induced Membrane Alterations
MSD(t) =,|ri(t+t)2ri(t)|2.i,t], whereri(t) is the position of lipid i at time t, and , .i,t stands for averaging over the lipids
i= 1,2,…,Nand the timest. Then the lateral diffusion coefficient for the given lipid type is DL= limtR‘[1/(4t),|ri (t+t)2ri (t)|2.i,t]. The center of mass motion of individual leaflets was removed before calculation as monolayers can drift during the simulation.
(TIF)
Figure S2 Chromatographic analysis of cholesterol,
cholestenone and their fluorescent analogs extracted from HDFs.A. HDFs were treated with coase (10 U/ml; 1 h at 37uC). Cells were collected after 22 h chase and the lipids were extracted and analysed by HP-TLC. Standards: CHOL = terol, CNONE = cholestenone, TG = triglycerides, CE = choles-teryl esters. B. HDFs were pulse labeled for 30 min with 1mM Bpy-cholesterol (Bpy-chol) or Bpy-cholestenone (Bpy-cnone). Cells
were collected immediately after labeling (0 h) or after 4 h chase, and the lipids were extracted and analysed by HP-TLC. (TIF)
Acknowledgments
We thank Anna Uro and Pipsa Kaipainen for technical assistance. Mikko Liljestro¨m and Biomedicum Imaging Unit are thanked for imaging support. CSC – IT Center for Science (Espoo, Finland) is acknowledged for computational resources.
Author Contributions
Conceived and designed the experiments: MN MM TR IV EI. Performed the experiments: MN MM SM. Analyzed the data: MN MM SM MJ. Contributed reagents/materials/analysis tools: ZL RB. Contributed to the writing of the manuscript: MN MM TR ZL RB IV EI.
References
1. Ikonen E. (2008) Cellular cholesterol trafficking and compartmentalization. Nat Rev Mol Cell Biol 9: 125–138. 10.1038/nrm2336.
2. Simons K, Sampaio JL. (2011) Membrane organization and lipid rafts. Cold Spring Harb Perspect Biol 3: a004697. 10.1101/cshperspect.a004697. 3. Simons K, Ikonen E. (1997) Functional rafts in cell membranes. Nature 387:
569–572. 10.1038/42408.
4. Lasserre R, Guo XJ, Conchonaud F, Hamon Y, Hawchar O, et al. (2008) Raft nanodomains contribute to Akt/PKB plasma membrane recruitment and activation. Nat Chem Biol 4: 538–547. 10.1038/nchembio.103.
5. Zidovetzki R, Levitan I. (2007) Use of cyclodextrins to manipulate plasma membrane cholesterol content: Evidence, misconceptions and control strategies. Biochim Biophys Acta 1768: 1311–1324. 10.1016/j.bbamem.2007.03.026. 6. Eggeling C, Ringemann C, Medda R, Schwarzmann G, Sandhoff K, et al. (2009)
Direct observation of the nanoscale dynamics of membrane lipids in a living cell. Nature 457: 1159–1162. 10.1038/nature07596.
7. Lenne PF, Wawrezinieck L, Conchonaud F, Wurtz O, Boned A, et al. (2006) Dynamic molecular confinement in the plasma membrane by microdomains and the cytoskeleton meshwork. EMBO J 25: 3245–3256. 10.1038/sj.emboj.7601214. 8. Rhainds D, Bourgeois P, Bourret G, Huard K, Falstrault L, et al. (2004) Localization and regulation of SR-BI in membrane rafts of HepG2 cells. J Cell Sci 117: 3095–3105. 10.1242/jcs.01182.
9. Meszaros P, Klappe K, Hummel I, Hoekstra D, Kok JW. (2011) Function of MRP1/ABCC1 is not dependent on cholesterol or cholesterol-stabilized lipid rafts. Biochem J 437: 483–491. 10.1042/BJ20110427.
10. Kwik J, Boyle S, Fooksman D, Margolis L, Sheetz MP, et al. (2003) Membrane cholesterol, lateral mobility, and the phosphatidylinositol 4,5-bisphosphate-dependent organization of cell actin. Proc Natl Acad Sci U S A 100: 13964– 13969. 10.1073/pnas.2336102100.
11. Le Lay S, Li Q, Proschogo N, Rodriguez M, Gunaratnam K, et al. (2009) Caveolin-1-dependent and -independent membrane domains. J Lipid Res 50: 1609–1620. 10.1194/jlr.M800601-JLR200.
12. Gronberg L, Slotte JP. (1990) Cholesterol oxidase catalyzed oxidation of cholesterol in mixed lipid monolayers: Effects of surface pressure and phospholipid composition on catalytic activity. Biochemistry 29: 3173–3178. 13. Salen G, Batta AK, Tint GS, Shefer S, Ness GC. (1994) Inverse relationship
between plasma cholestanol concentrations and bile acid synthesis in sitosterolemia. J Lipid Res 35: 1878–1887.
14. Bjorkhem I, Karlmar KE. (1974) Biosynthesis of cholestanol: Conversion of cholesterol into 4-cholesten-3-one by rat liver microsomes. Biochim Biophys Acta 337: 129–131.
15. Xu X, London E. (2000) The effect of sterol structure on membrane lipid domains reveals how cholesterol can induce lipid domain formation. Biochemistry 39: 843–849.
16. Samsonov AV, Mihalyov I, Cohen FS. (2001) Characterization of cholesterol-sphingomyelin domains and their dynamics in bilayer membranes. Biophys J 81: 1486–1500. 10.1016/S0006-3495(01)75803-1.
17. Cahuzac N, Baum W, Kirkin V, Conchonaud F, Wawrezinieck L, et al. (2006) Fas ligand is localized to membrane rafts, where it displays increased cell death-inducing activity. Blood 107: 2384–2391. 10.1182/blood-2005-07-2883. 18. Sahl SJ, Leutenegger M, Hilbert M, Hell SW, Eggeling C. (2010) Fast molecular
tracking maps nanoscale dynamics of plasma membrane lipids. Proc Natl Acad Sci U S A 107: 6829–6834. 10.1073/pnas.0912894107.
19. Torrie GM, Valleau JP. (1977) Nonphysical sampling distributions in monte carlo free-energy estimation: Umbrella sampling. Journal of Computational Physics 23: 187–199. http://dx.doi.org/10.1016/0021-9991(77)90121-8. 20. Bennett WF, MacCallum JL, Hinner MJ, Marrink SJ, Tieleman DP. (2009)
Molecular view of cholesterol flip-flop and chemical potential in different membrane environments. J Am Chem Soc 131: 12714–12720. 10.1021/ ja903529f; 10.1021/ja903529f.
21. Parisio G, Sperotto MM, Ferrarini A. (2012) Flip-flop of steroids in phospholipid bilayers: Effects of the chemical structure on transbilayer diffusion. J Am Chem Soc 134: 12198–12208. 10.1021/ja304007t.
22. Jo S, Rui H, Lim JB, Klauda JB, Im W. (2010) Cholesterol flip-flop: Insights from free energy simulation studies. J Phys Chem B 114: 13342–13348. 10.1021/jp108166k.
23. Anglin TC, Conboy JC. (2009) Kinetics and thermodynamics of flip-flop in binary phospholipid membranes measured by sum-frequency vibrational spectroscopy. Biochemistry 48: 10220–10234. 10.1021/bi901096j.
24. Bruckner RJ, Mansy SS, Ricardo A, Mahadevan L, Szostak JW. (2009) Flip-flop-induced relaxation of bending energy: Implications for membrane remodeling. Biophys J 97: 3113–3122. 10.1016/j.bpj.2009.09.025.
25. Sapay N, Bennett WFD, Tieleman DP. (2009) Thermodynamics of flip-flop and desorption for a systematic series of phosphatidylcholine lipids. Soft Matter : 3295. - 10.1039/B902376C.
26. Bennett WF, MacCallum JL, Tieleman DP. (2009) Thermodynamic analysis of the effect of cholesterol on dipalmitoylphosphatidylcholine lipid membranes. J Am Chem Soc 131: 1972–1978. 10.1021/ja808541r.
27. Mendez AJ, Lin G, Wade DP, Lawn RM, Oram JF. (2001) Membrane lipid domains distinct from cholesterol/sphingomyelin-rich rafts are involved in the ABCA1-mediated lipid secretory pathway. J Biol Chem 276: 3158–3166. 10.1074/jbc.M007717200.
28. Vaughan AM, Oram JF. (2003) ABCA1 redistributes membrane cholesterol independent of apolipoprotein interactions. J Lipid Res 44: 1373–1380. 10.1194/jlr.M300078-JLR200.
29. Ho¨ltta¨-Vuori M, Uronen RL, Repakova J, Salonen E, Vattulainen I, et al. (2008) BODIPY-cholesterol: A new tool to visualize sterol trafficking in living cells and organisms. Traffic 9: 1839–1849.
30. Jansen M, Ohsaki Y, Rita Rega L, Bittman R, Olkkonen VM, et al. (2011) Role of ORPs in sterol transport from plasma membrane to ER and lipid droplets in mammalian cells. Traffic 12: 218–231.
31. Kanerva K, Uronen RL, Blom T, Li S, Bittman R, et al. (2013) LDL cholesterol recycles to the plasma membrane via a Rab8a-Myosin5b-actin-dependent membrane transport route. Dev Cell. 10.1016/j.devcel.2013.09.016. 32. Le Clainche C, Carlier MF. (2008) Regulation of actin assembly associated with
protrusion and adhesion in cell migration. Physiol Rev 88: 489–513. 10.1152/ physrev.00021.2007.
33. Saarikangas J, Zhao H, Lappalainen P. (2010) Regulation of the actin cytoskeleton-plasma membrane interplay by phosphoinositides. Physiol Rev 90: 259–289. 10.1152/physrev.00036.2009.
34. Welf ES, Ahmed S, Johnson HE, Melvin AT, Haugh JM. (2012) Migrating fibroblasts reorient directionality by a metastable, PI3K-dependent mechanism. J Cell Biol 197: 105–114. 10.1083/jcb.201108152.
35. Bligh EG, Dyer WJ. (1959) A rapid method of total lipid extraction and purification. Can J Biochem Physiol 37: 911–917.
36. Almeida ML, Kocovsky P, Backvall JE. (1996) Ruthenium-catalyzed oppenauer-type oxidation of 3beta-hydroxy steroids. A highly efficient entry into the steroidal hormones with 4-en-3-one functionality. J Org Chem 61: 6587–6590. 37. Li Z, Bittman R. (2007) Synthesis and spectral properties of cholesterol- and FTY720-containing boron dipyrromethene dyes. J Org Chem 72: 8376–8382. 10.1021/jo701475q.
38. Owen DM, Rentero C, Magenau A, Abu-Siniyeh A, Gaus K. (2011) Quantitative imaging of membrane lipid order in cells and organisms. Nat Protoc 7: 24–35. 10.1038/nprot.2011.419.
40. Jorgensen W, Maxwell D, Tirado-Rives J. (1996) Development and testing of the OPLS all-atom force field on conformational energetics and properties of organic liquids. J Am Chem Soc : 11225. - 10.1021/ja9621760.
41. Orlowski A, St-Pierre JF, Magarkar A, Bunker A, Pasenkiewicz-Gierula M, et al. (2011) Properties of the membrane binding component of catechol-O-methyltransferase revealed by atomistic molecular dynamics simulations. J Phys Chem B 115: 13541–13550. 10.1021/jp207177p.
42. Stepniewski M, Kepczynski M, Jamroz D, Nowakowska M, Rissanen S, et al. (2012) Interaction of hematoporphyrin with lipid membranes. J Phys Chem B. 10.1021/jp300899b.
43. Jorgensen WL, Chandrasekhar J, Madura JD, Impey RW, Klein ML. (1983) Comparison of simple potential functions for simulating liquid water. J Chem Phys 79: 926–935. 10.1063/1.445869. Available: http://dx.doi.org/10.1063/1. 445869 via the Internet.
44. Essmann U, Perera L, Berkowitz ML, Darden T, Lee H, et al. (1995) A smooth particle mesh ewald method. J Chem Phys 103: 8577–8593. 10.1063/1.470117. Available: http://dx.doi.org/10.1063/1.470117 via the Internet.
45. Hess B, Bekker H, Berendsen HJC, Fraaije JGEM. (1997) LINCS: A linear constraint solver for molecular simulations. Journal of Computational Chemistry
18: 1463–1472. 10.1002/(SICI)1096-987X(199709)18:12,1463::AID-JCC4. 3.0.CO;2-H.
46. Parrinello M, Rahman A. (1981) Polymorphic transitions in single crystals: A new molecular dynamics method. J Appl Phys 52: 7182–7190. 10.1063/ 1.328693. Available: http://dx.doi.org/10.1063/1.328693 via the Internet. 47. Bussi G, Donadio D, Parrinello M. (2007) Canonical sampling through velocity
rescaling. J Chem Phys 126: 014101. 10.1063/1.2408420.
48. Hub J, de Groot B, van der Spoel D. (2010) g_wham—A free weighted histogram analysis implementation including robust error and autocorrelation estimates. J Chem Theory Comput : 3713. - 10.1021/ct100494z.
49. Seelig A, Seelig J. (1977) Effect of a single cis double bond on the structures of a phospholipid bilayer. Biochemistry 16: 45–50.
50. Murzyn K, Rog T, Jezierski G, Takaoka Y, Pasenkiewicz-Gierula M. (2001) Effects of phospholipid unsaturation on the membrane/water interface: A molecular simulation study. Biophys J 81: 170–183. 10.1016/S0006-3495(01)75689-5.
51. Rog T, Stimson LM, Pasenkiewicz-Gierula M, Vattulainen I, Karttunen M. (2008) Replacing the cholesterol hydroxyl group with the ketone group facilitates sterol flip-flop and promotes membrane fluidity. J Phys Chem B 112: 1946– 1952. 10.1021/jp075078h.
Cholestenone Induced Membrane Alterations