FAST-TO-FED SHIFT IN GLUCOSE
HOMEOSTASIS: CLUES TO AN
EARLIER DETECTION OF HUMAN
PREDIABETIC STATES
Faculdade de Ciências Médicas
Universidade Nova de Lisboa
Dissertation presented to obtain the PhD degree in “Ciências da Vida, especialidade de Fisiologia” at the Faculdade de Ciências Médicas da Universidade Nova de Lisboa
Realizado com o apoio da Fundação para a Ciência e Tecnologia (SFRH/BD/5806/2001) e co-financiado pelo Programa Operacional Ciência e Inovação 2010 (POCI 2010), no âmbito da formação avançada para a Ciência – Medida IV.3 (III Quadro Comunitário de Apoio).
“Research is what I‟m doing when I don‟t know what I‟m doing.”
The original results and conclusions presented in this thesis have been partially published in the following peer-reviewed papers.
- Rita S. Patarrão, W. Wayne Lautt, J. Schafer and M. Paula Macedo, Glucagon causes HISS-dependent insulin resistance (in preparation).
- Rita S. Patarrão, W. Wayne Lautt, Ricardo A. Afonso, Rogério T. Ribeiro, Ana B. Fernandes, José M. Boavida and M. Paula Macedo, Overweight subjects have impaired postprandial but not fasting insulin sensitivity due to a compromise of the HISS-dependent component (in preparation).
- Rita S. Patarrão, W. Wayne Lautt, Maria P. Guarino, Ricardo A. Afonso, Rogério T. Ribeiro, Ana B. Fernandes, José M. Boavida and M. Paula Macedo, Meal-induced insulin sensitisation and its parasympathetic regulation in humans. Can J Physiol Pharmacol, 86: 880-888 (2008).
- Rita S. Patarrão, W. Wayne Lautt, Maria P. Guarino, Ricardo A. Afonso, Rogério T. Ribeiro, Ana B. Fernandes, José M. Boavida and M. Paula Macedo, A new technique to assess insulin sensitivity in humans: the rapid insulin sensitivity test (RIST). Proc West Pharmacol Soc, 50: 105-109 (2007).
Neste momento tão importante da minha vida científica gostaria de salientar que a realização e concretização desta tese de doutoramento, só foi possível graças à presença e envolvimento de várias pessoas e instituições.
À Fundação para a Ciência e Tecnologia, pelo seu suporte financeiro.
À Faculdade de Ciências Médicas e à Faculdade de Medicina de Manitoba, Winnipeg, Canadá, mais especificamente, ao Departamento de Farmacologia e Terapêutica, por todas as facilidades concedidas para a realização do trabalho experimental em animais de laboratório.
Ao Instituto Português de Oncologia de Lisboa e à Associação Protectora dos Diabéticos de Portugal pela cedência das instalações e por todas as facilidades concedidas para a realização do trabalho experimental em humanos.
À Professora Doutora Maria Paula Macedo, minha orientadora e, acima de tudo amiga. Estou certa de não dispor de palavras suficientes para exprimir toda a minha gratidão, pela orientação de todo o meu trabalho científico. Foi com ela que dei os meus primeiros passos na ciência, e sem ela a realização desta dissertação jamais seria possível. A sua forma de estar perante a Ciência é única, e contagia qualquer um, mesmo nos momentos mais difíceis. Um muito obrigada, Profezinha!
To Wayne, I would like to express my heartfelt thanks for all the knowledge, the scientific discussions, and for giving me the opportunity to learn and share so much science in his lab, across the ocean. His enthusiasm in research as a co-supervisor is “healthy”. My personal and scientific life without him would not be the same. He is simply the best co-supervisor in the world that someone may have!
Ao Professor Doutor Pedro Costa, por me ter recebido e acolhido no Departamento de Fisiologia e por ter sido um interlocutor disponível e arguto.
Ao Professor Doutor Miguel Mota Carmo, para além da grande amizade criada, pelo seu contributo na minha vida pessoal, académica e científica, e pela sua preocupação constante que manifestou desde sempre.
Aos membros dos Departamentos de Fisiologia, Fisiopatologia e Bioquímica da Faculdade de Ciência Médicas, nomeadamente, Professora Doutora Ana Isabel Santos, Professora Doutora Alexandra Ribeiro, Professor Doutor Carlos Filipe, Dra. Mafalda Nascimento, Sofia Ramos, Dra. Iolanda Caires, Isabel Ribeiro da Silva, Dra. Ana Sofia Tavares, Helena Almeida, Teresa Fortunato, Firmina Lebre e Augusta Marques pelo acolhimento e pela cooperação.
Aos membros do Biotério da Faculdade de Ciência Médicas e da Faculdade de Medicina de Manitoba, nomeadamente à Gracinda Menezes, Mariana Lavajo, Ludmila, e Gery Nolette, por todo o apoio prestado na manutenção e manipulação de todos os animais de laboratório utilizados nas muitas experiências realizadas.
Ainda na Faculdade de Ciências Médicas um obrigado muito especial à Professora Doutora Paula Videira, Dra. Luísa Barata e Dra. Mafalda Rodrigues.
Aos Professores Doutores Jorge Caldeira e Celina Santos, do Departamento de Química da Faculdade de Ciências e Tecnologia da Universidade Nova de Lisboa, a quem agradeço terem tornado o “mundo da Química” um pouco mais cor-de-rosa.
A todos os membros do Laboratório da Associação Protectora dos Diabéticos de Portugal por todo o apoio prestado. Uma palavra muito especial para a Dra. Zulmira Peerally que, para além da grande amizade criada, esteve sempre a meu lado com uma constante precisão e rigor, aquando da realização das inúmeras quantificações bioquímicas e, na posterior interpretação dos resultados obtidos.
Aos Doutores José Manuel Boavida, Rui Duarte, Luís Gardete Correia e ao Professor Doutor João Raposo, da Associação Protectora dos Diabéticos de Portugal, por todas as reuniões científicas que tivemos em conjunto e pelo grandioso apoio na área clínica da Diabetes.
Gostaria de prestar um especial agradecimento a todos os colegas de trabalho, de Winnipeg e de Lisboa, que comigo partilham ou partilharam toda a minha vivência no laboratório.
À Maria Guarino, um obrigado muito especial. Jamais esquecerei a nossa amizade e todos os nossos momentos partilhados. As nossas discussões científicas serão sempre recordadas com um carinho muito especial.
Ao Ricardo Afonso, apesar de inúmeras vezes as nossas ideias e pontos de vista serem distintos, nunca deixámos de os discutir e disfrutar das suas consequências. A nossa colaboração e entreajuda mútua tem sido muito construtiva e saudável!
Ao Rogério Ribeiro, pela partilha científica e por todo o apoio informático ao longo destes anos.
À Inês Lima, Fátima Martins e Iva Lamarão, pela enorme “lufada” de ar fresco e “energia renovável” que souberam trazer ao laboratório.
I thank Josh Schafer, my “Canadian brother”, for all of his time dedicated to me, towards science. It was good working with a person like Josh, especially in a lab far away from home. “Rita, do you have your timer?”
I am grateful to Dallas Legare for his attention and fantastic technical training.
To Zhi Ming and David Sontag for their friendship and camaraderie.
Karen Sanders, I have no words to described her superb efficiency, competence and capacity to organize such sort of things.
To all my Canadian friends, especially, Samantha, Christy, Kristin, Carmen, Clatus, Marc and “Bosco”, a supreme acknowledgment. Thank you all for being there, and for all special support that you gave me!!
À Nina Correia, Filipa Duarte-Ramos, e Nair Bonito, amigas e ex-colegas de laboratório, por todos os bons e menos bons momentos passados juntas.
À Gisa e à Milu, pela enorme amizade.
Para além da minha vida científica, existem pessoas sem as quais a minha vida não faria sentido.
compreensível. Soube sempre estar ao meu lado, mesmo aquando dos meus longos períodos de ausência, com um positivismo inigualável. Por todo o apoio e compreensão incondicional que me tem oferecido ao longo destes anos. No entanto, o “Galo” já canta!! Atingimos mais um grande objectivo das nossas vidas, mas ainda faltam muitos outros...
À minha restante família, nomedamente aos meus sobrinhos, Diogo e Frederico. Vocês foram muitas vezes, e sem se aperceberem, a maior fonte de energia interior para eu conseguir rumar a bom porto esta dissertação. Vocês são únicos!
A todos os meus amigos. Um agradecimento especial à Ditinha, ao Adolfo e à Margarida pela sólida amizade que nos une e que tanto me faz sentir segura. Vocês mereciam mais do meu tempo, mas souberam sempre desculpar e compreender os períodos da minha ausência.
TABLE OF CONTENTS
LIST OF FIGURES AND TABLES ... vii
LIST OF FIGURES ... vii
LIST OF TABLES ...xiii
LIST OF ABBREVIATIONS ... xv
ABSTRACT ... xix
RESUMO ... xxi
PREFACE ... xxiii
1. GENERAL INTRODUCTION ... 3
1.1.GLUCOSEHOMEOSTASIS ... 3
1.1.1. Physiological glucose metabolism ... 3
1.1.2. Hormonal regulation of glucose metabolism ... 5
1.1.2.1. Pancreatic hormones ... 5
1.1.2.2. Gastrointestinal hormones ... 8
1.1.2.3. Adipocyte-derived hormones ... 10
1.1.2.4. Counterregulatory hormones ... 14
1.2. INSULIN AND GLUCOSE METABOLISM ... 15
1.2.1. The insulin molecule ... 15
1.2.2. Insulin biosynthesis ... 15
1.2.3. Insulin secretion ... 16
1.2.4. Insulin signaling and regulation of glucose transport ... 18
1.2.4.1. Glucose transporters ... 18
1.2.4.1.1. Sodium-dependent glucose transporters (STGL) ... 19
1.2.4.1.2. Facilitative glucose transporters (GLUT) ... 19
1.2.4.2. The insulin receptor: structure and function ... 22
1.2.4.3. Insulin signaling pathway and glucose uptake ... 23
1.3. GLUCAGON AND GLUCOSE HOMEOSTASIS ... 25
1.3.1. The glucagon molecule: structure and synthesis ... 25
1.3.2. Glucagon secretion ... 25
1.3.3. Molecular mechanism for glucagon-mediated glucose regulation ... 28
1.3.4. Role of glucagon in glucose homeostasis ... 29
1.3.5. Glucagon and hepatic GSH content ... 30
1.3.6. Role of glucagon and insulin in deregulation of glucose homeostasis ... 31
1.5. THE HEPATIC INSULIN SENSITIZING SUBSTANCE (HISS) HYPOTHESIS ... 34
1.5.1. The role of nitric oxide and glutathione on HISS release ... 35
1.5.2. HISS action and the target organ of insulin resistance ... 39
1.5.3. Prandial control of HISS release ... 39
1.5.4. Role of HISS-dependent insulin resistance (HDIR) in pathology ... 41
1.6. PATHOLOGIES ASSOCIATED WITH INSULIN RESISTANCE ... 43
1.6.1. Insulin resistance and Obesity ... 43
1.6.2. Insulin resistance and Type 2 diabetes ... 46
1.7. METHODS AND INDEXES OF INSULIN SENSITIVITY ASSESSMENT ... 52
1.7.1. Methods of insulin sensitivity/resistance assessment ... 52
1.7.1.1. Hyperinsulinemic Euglycemic Glucose Clamp (HIEC) ... 52
1.7.1.2. Insulin Tolerance Test (ITT) ... 54
1.7.1.3. Insulin Suppression Test (IST) ... 55
1.7.1.4. Continuous Infusion of Glucose with Model Assessment (CIGMA) ... 56
1.7.1.5. Oral Glucose Tolerance Test (OGTT) ... 57
1.7.1.6. Minimal model analysis of Frequently Sampled Intravenous Glucose Tolerance Test (FSIVGTT) ... 58
1.7.1.7. Meal Tolerance Test (MTT) ... 60
1.7.1.8. Rapid Insulin Sensitivity Test (RIST) ... 62
1.7.2. Simple surrogate indexes for insulin sensitivity/resistance ... 65
1.7.2.1. Homeostasis Model Assessment (HOMA) ... 65
1.7.2.2. Quantitative Insulin Sensitivity Check Index (QUICKI)... 66
1.7.2.3. Insulin sensitivity indexes based on OGTT ... 68
Cederholm and Wibell Index ... 68
Gutt et al. Index ... 68
Avignon et al. Index ... 69
Matsuda et al. Index ... 69
Belfiore et al. Index ... 70
Stumvoll et al. Index ... 70
McAuley et al. Index ... 71
1.7.2.4. Oral Glucose Insulin Sensitivity (OGIS) ... 71
1.7.2.5. Rapid Insulin Sensitivity Test (RIST) Index ... 72
2. HYPOTHESES AND OBJECTIVES ... 75
2.1. THE HISS IN HUMANS ... 76
2.2. THE RELEVANCE OF GLUCAGON ON THE HISS PATHWAY ... 77
3. MATERIALS AND METHODS ... 81
3.1. HUMAN STUDIES ... 81
3.1.3. Glycemia quantification ... 83
3.1.4. Rapid Insulin Sensitivity Test (RIST) in humans... 84
3.1.5. Quantification of HISS action ... 85
3.1.6. Blood Samples ... 86
3.1.7. Human biochemical parameters analysis ... 87
3.2. ANIMALS STUDIES ... 91
3.2.1. Sprague-Dawley rats ... 91
3.2.2. Pre-surgical protocol and anesthesia ... 92
3.2.3. Surgical protocol ... 93
3.2.3.1. Arterial-venous loop ... 93
3.2.3.2. Tracheotomy ... 94
3.2.3.3. Femoral artery and femoral vein cannulation ... 95
3.2.3.4. Jugular vein cannulation ... 96
3.2.3.5. Portal vein cannulation ... 96
3.2.4. Post-surgical protocol ... 97
3.2.5. Blood pressure monitorization ... 98
3.2.6. Sampling of arterial blood ... 98
3.2.7. Rapid Insulin Sensitivity Test (RIST) in animals ... 99
3.2.8. Drug administration... 101
3.2.9. Animal biochemical parameters analysis ... 101
3.3. EXPERIMENTAL PROTOCOLS... 102
3.3.1. Human studies ... 102
3.3.1.1. Evaluation of the dynamic response to insulin in the fed state ... 104
3.3.1.2. Evaluation of the dynamic response to insulin in the fasted and fed states ... 105
3.3.1.3. Effect of atropine administration on insulin sensitivity, in lean healthy subjects ... 106
3.3.2. Animal Studies ... 107
3.3.2.1. Hepatic effect of DBcAMP, a cAMP analogue, on insulin sensitivity ... 107
3.3.2.2. Hepatic effect of glucagon, on HISS-dependent insulin sensitivity ... 108
3.4. STATISTICAL ANALYSIS ... 109
3.5.REAGENTS AND SOLUTIONS ... 110
4. THE RAPID INSULIN SENSITIVITY TEST (RIST) IN HUMANS ... 113
4.1. INTRODUCTION AND AIMS ... 113
4.2. PROTOCOLS ... 114
4.2.1. Evaluation of the RIST reproducibility on 2 different days, in lean healthy subjects ... 114
4.2.2. Assessment of the RIST implementation, in lean healthy subjects ... 115
4.3. RESULTS ... 115
4.3.1. Evaluation of the RIST reproducibility on 2 different days, in lean healthy subjects ... 116
4.3.2. Assessment of the RIST implementation, in lean healthy subjects ... 121
5. THE HISS IN LEAN HEALTHY HUMANS ... 131
5.1. INTRODUCTION AND AIMS ... 131
5.2. PROTOCOLS ... 132
5.2.1. Evaluation of the dynamic response to insulin in the fasted and fed states, in lean healthy subjects ... 132
5.2.2. Effect of atropine administration on insulin sensitivity, in lean healthy subjects ... 132
5.3. RESULTS ... 132
5.3.1. Evaluation of the dynamic response to insulin in the fasted and fed states, in lean healthy subjects ... 133
5.3.1.1. Comparison of the fasted and fed RIST dynamic profile, in lean healthy subjects ... 133
5.3.1.2. Effect of fasting and feeding on insulin sensitivity, in lean healthy subjects ... 135
5.3.1.3. Plasma insulin and C-Peptide levels during the fasted and fed RIST, in lean healthy subjects ... 136
5.3.2. Effect of atropine administration on insulin sensitivity, in lean healthy subjects ... 138
5.3.2.1. Biochemical profiles after feeding the standardized test meal, on control fed and atropine 0.5 and 0.75mg fed groups ... 139
5.3.2.2. Comparison of the control fed and atropine 0.5mg fed RIST dynamic profiles, in lean healthy subjects ... 142
5.3.2.3. Effect of atropine 0.5mg infusion on insulin sensitivity, in lean healthy subjects ... 144
5.3.2.4. Comparison of the control fed and atropine 0.75mg fed RIST dynamic profiles, in lean healthy subjects ... 145
5.3.2.5. Effect of atropine 0.75mg infusion, on insulin sensitivity, in lean healthy subjects .... 148
5.3.2.6. Effect of atropine 0.5mg on plasma insulin and C-Peptide levels after feeding the standardized test meal and during the fed RIST, in lean healthy subjects ... 149
5.3.2.7. Effect of atropine 0.75mg on plasma insulin and C-Peptide levels after feeding the standardized test meal and during the fed RIST, in lean healthy subjects ... 153
5.4. DISCUSSION ... 155
6. THE HISS IN OVERWEIGHT HUMANS ... 165
6.1. INTRODUCTION AND AIMS ... 165
6.2. PROTOCOLS ... 166
6.2.1. Evaluation of the dynamic response to insulin in the fasted and fed state, in lean healthy and overweight subjects ... 166
6.3. RESULTS ... 166
6.3.1. Characterization of insulin action, in overweight and lean healthy subjects ... 167
6.3.1.1. Evaluation of glucose, insulin and C-Peptide profiles after feeding the standardized test meal, in overweight and lean subjects ... 167
6.3.1.4. Plasma insulin and C-Peptide levels during the fasted and fed RIST, in lean and
overweight subjects ... 173
6.4. DISCUSSION ... 177
7. THE RELEVANCE OF GLUCAGON ON HISS-DEPENDENT INSULIN SENSITIVITY ... 183
7.1. INTRODUCTION AND AIMS ... 183
7.2. PROTOCOLS ... 184
7.2.1. Hepatic effect of DBcAMP, a cAMP analogue, on insulin sensitivity ... 184
7.2.2. Hepatic effect of glucagon, on HISS-dependent insulin sensitivity ... 184
7.3. RESULTS ... 185
7.3.1. Hepatic effect of DBcAMP, a cAMP analogue, on insulin sensitivity ... 185
7.3.1.1. Effect of DBcAMP on mean arterial pressure and arterial glycemia ... 185
7.3.1.2. Effect of DBcAMP on insulin sensitivity ... 187
7.3.1.3. Effect of DBcAMP on insulin levels ... 189
7.3.2. Hepatic effect of glucagon, on HISS-dependent insulin sensitivity ... 189
7.3.2.1. Effect of glucagon on arterial glycemia ... 189
7.3.2.2. Effect of glucagon on insulin sensitivity ... 192
7.3.2.3. Effect of glucagon on HISS-dependent insulin sensitivity ... 193
7.4. DISCUSSION ... 195
8. GENERAL DISCUSSION ... 201
8.1.METHODOLOGICAL CONSIDERATIONSIN THE ASSESSMENTOF HUMAN WHOLE-BODY INSULINSENSITIVITY ... 201
8.2. MEAL-INDUCED INSULIN SENSITIZATION IN HUMANS AND ITS PARASYMPATHETIC REGULATION ... 204
8.3.THERELEVANCEOFGLUCAGONONHISS-DEPENDENTINSULINSENSITIVITY ... 210
8.4. FUTURE DIRECTIONS ... 214
BIBLIOGRAPHY ... 219
APPENDIX ... 249
Subjects Study Information ... 249
Subject Consent Form ... 251
Folha De Informação Ao Voluntário ... 253
LIST OF FIGURES AND TABLES
LIST OF FIGURES
Figure 1.1 - Overview of glycolysis and gluconeogenesis. ... 4
Figure 1.2 - Structure of human insulin ... 15
Figure 1.3 - Schematic diagram of the insulin receptor tetramer. ... 22
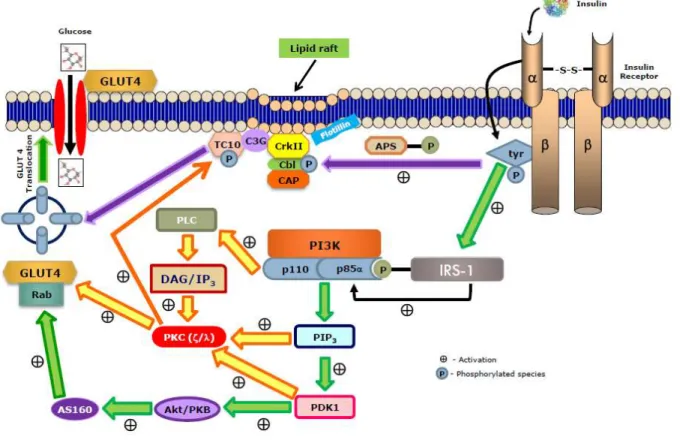
Figure 1.4 –Simplified representation of molecular mechanism involved in insulin signaling pathway that regulates glucose transporter (GLUT4) translocation to cell membrane ... 24
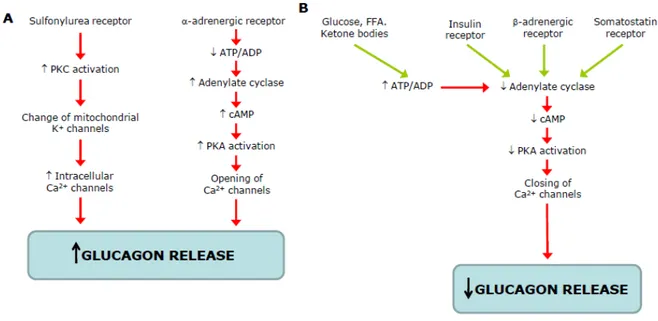
Figure 1.5 - Schematic representation of stimulators (A) and inhibitors (B) of glucagon of glucagon secretion... 26
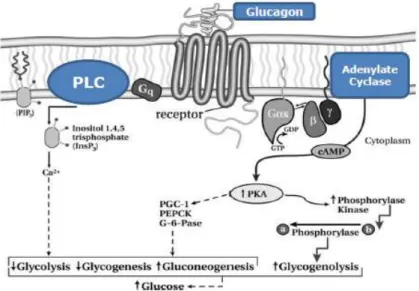
Figure 1.6 –Glucagon signaling pathway ... 28
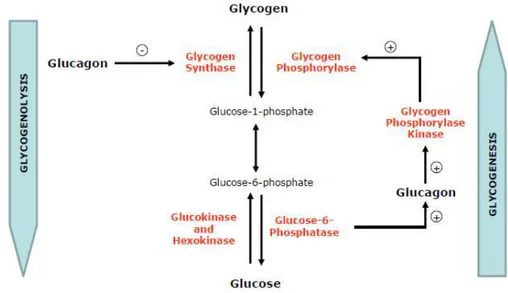
Figure 1.7 –Regulation of glycogen metabolism by glucagon in the liver ... 30
Figure 1.8 –Overview of the hepatic insulin sensitizing substance (HISS) synthesis/secretion pathway ... 36
Figure 1.9 –The Hepatic insulin sensitizing substance (HISS) hypothesis ... 38
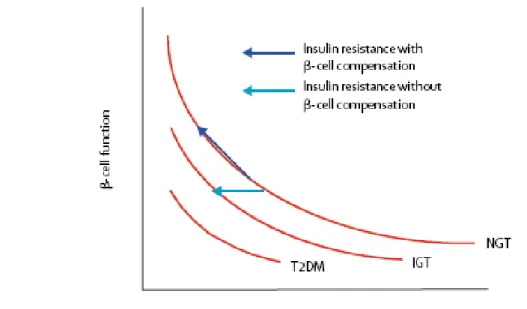
Figure 1.10 - Hyperbolic relation between -cell function and insulin sensitivity. ... 50
Figure 1.11 - Starling‟s curve of the pancreas for insulin secretion. ... 51
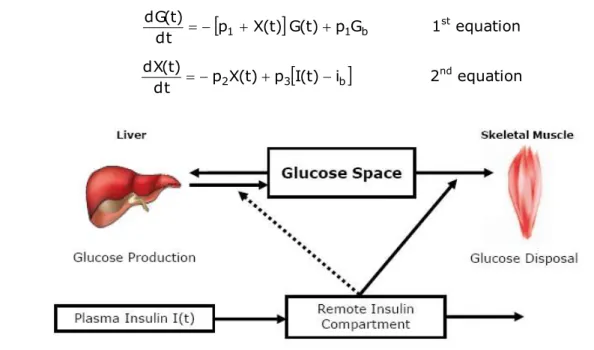
Figure 1.12 - Schematic equations and parameters for the minimal model of glucose metabolism ... 59
Figure 1.13 - Rapid insulin sensitivity test (RIST) time line ... 63
Figure 3.1 - Representation of human veins of the upper limb ... 82
Figure 3.2 - Representation of the glucose analyzer sensor probe and enzyme membrane ... 83
Figure 3.3 –Schematic representation of the typical profile using the dynamic analysis of the pattern of glucose infusion during the Rapid Insulin Sensitivity Test (RIST), in rats.. ... 85
Figure 3.4 - Schematic representation of the typical RIST index obtained in the fed and fasted state, in rats. ... 86
Figure 3.5 - Arterial–venous loop ... 93
Figure 3.6 –Trachea ... 95
Figure 3.7 – Localization of the femoral artery and femoral vein... 95
Figure 3.9 –Schematic representation of the liver and the portal vein.. ... 97
Figure 3.10 –Rat typical profile of the Rapid Insulin Sensitivity Test (RIST) ... 100
Figure 3.11 – Schematic representation of the experimental protocol before starting the 24h fast RIST. ... 103
Figure 3.12 –Schematic representation of the experimental protocol before feeding the standardized test meal. ... 103
Figure 3.13 – Schematic representation of the experimental protocol for the evaluation of the dynamic response to insulin in the fed state, in lean healthy subjects. ... 104
Figure 3.14 – Schematic representation of the experimental protocol for the evaluation of the dynamic response to insulin in the 24h fast and fed state, in lean healthy and overweight subjects. 105
Figure 3.15 – Schematic representation of the experimental protocol for the evaluation of insulin sensitivity after HISS blockade with atropine 0.5 or 0.75mg, or saline, in lean healthy subjects. ... 106
Figure 3.16 –Schematic representation of the experimental protocol for the evaluation of the hepatic effect of different doses of DBcAMP on insulin sensitivity. ... 108
Figure 3.17–Schematic representation of the experimental protocol for the evaluation of the hepatic effect of different doses of glucagon on insulin sensitivity. ... 108
Figure 3.18 –Schematic representation of the experimental protocol for the evaluation of the hepatic effect of glucagon 200ng/kg on HISS-dependent insulin sensitivity ... 109
Figure 4.1 – Biochemical parameters (glycemia, insulin, C-Peptide, lactate, HDL-cholesterol, LDL-cholesterol, total cholesterol and triglycerides) profiles measured at specific time points during 100min after ingestion of the standardized test meal (0min) and before performing the RIST in the fed state (100min), for the evaluation of the RIST reproducibility, in lean healthy subjects ... 117
Figure 4.2 – Biochemical parameters (glycemia, insulin, C-Peptide, lactate, HDL-cholesterol, LDL cholesterol, total cholesterol and triglycerides) profiles measured at specific time points during the RIST in the fed state, on day 1 and day 2, in lean healthy subjects ... 118
Figure 4.3 –Comparison of the RIST profiles on the fed state in day 1 and day 2. Mean profile using the dynamic analysis of the pattern of glucose infusion during the Rapid Insulin Sensitivity Test (RIST) ... 120
Figure 4.4 - Each volunteer was submitted to the RIST, but at 2 different days, in the fed state .... 121
Figure 4.6 –Comparison of the RIST profiles on the 24h-fast (A) and fed state (B). Mean profile using the dynamic analysis of the pattern of glucose infusion during the 24h fast and fed Rapid Insulin Sensitivity Test (RIST) ... 124
Figure 4.7 - Standardized test meal increases insulin sensitivity in healthy volunteers ... 125
Figure 5.1 - Mean dynamic curves for the Rapid Insulin Sensitivity Test (RIST) performed on 24h-fast (simple line) and postprandial (bold line) states, in lean healthy subjects ... 134
Figure 5.2 - Mean dynamic profile curve for the HISS-dependent component of insulin action, calculated from the difference between the curves in figure 5.1, in lean healthy subjects. ... 134
Figure 5.3 - Standardized test meal increases insulin sensitivity in lean healthy volunteers ... 136
Figure 5.4 - Plasma insulin level profiles obtained before (from -100min to 0min) and during the RIST.. ... 137
Figure 5.5 - Plasma C-peptide level profiles obtained before (from -100min to 0min) and during the RIST. ... 138
Figure 5.6 – Biochemical parameters (glycemia, insulin, C-Peptide, lactate, HDL-cholesterol, LDL-cholesterol, total cholesterol and triglycerides) profiles measured at specific time points during 100min after ingestion of the standardized test meal (0min) and before performing the RIST in the fed state (100min), on control fed and atropine 0.5mg and 0.75mg fed groups, in lean healthy subjects ... 141
Figure 5.7 – Effect of saline (control) and atropine 0.5mg on postprandial RIST profiles. Mean dynamic curves for the Rapid Insulin Sensitivity Test (RIST) performed on control fed (bold line) and post-atropine 0.5mg fed (simple line) conditions, in lean healthy subjects ... 142
Figure 5.8 - Mean dynamic profile curve for the HISS-dependent component of insulin action calculated from the difference between the curves in figure 5.7, in lean healthy subjects after atropine 0.5mg administration ... 143
Figure 5.9 - Atropine 0.5mg decreased postprandial insulin sensitivity in lean healthy subjects ... 145
Figure 5.10 – Effect of saline (control) and atropine 0.75mg on postprandial RIST profiles. Mean dynamic curves for the Rapid Insulin Sensitivity Test (RIST) performed on control fed (bold line) and post-atropine 0.75mg fed (simple line) conditions, in lean healthy subjects... 146
Figure 5.11 – Mean dynamic profile curve for the HISS-dependent component of insulin action calculated from the difference between the curves in figure 5.10, in lean healthy subjects after atropine 0.75mg administration... 147
Figure 5.12 - Atropine 0.75mg decreased postprandial insulin sensitivity in lean healthy subjects .. 148
Figure 5.14 - Plasma insulin level profiles obtained after standardized test meal, atropine 0.5mg infusion and during the RIST. Left insert: Insulin area under the curve (AUC) calculated by the trapezoid rule for the 60 to 100min after saline (Control Fed) or atropine 0.5mg (Atropine 0.5mg Fed) infusion and before starting the fed RIST. Intravenous infusions over 10min of either atropine 0.5mg or saline were administrated 50min after feeding the meal and 50min before starting the fed RIST. Right insert: Insulin area under the curve (AUC) calculated by the trapezoid rule for Control Fed and Atropine 0.5mg Fed RIST...151
Figure 5.15 - Plasma C-peptide level profiles obtained after standardized test meal, atropine 0.5mg infusion and during the RIST. Left insert: C-peptide area under the curve (AUC) calculated by the trapezoid rule for the 60 to 100min after saline (Control Fed) or atropine 0.5mg (Atropine 0.5mg Fed) infusion and before starting the fed RIST. Intravenous infusions over 10min of either atropine 0.5mg or saline were administrated 50min after feeding the meal and 50min before starting the fed RIST. Right insert: C-peptide area under the curve (AUC) calculated by the trapezoid rule for Control Fed and Atropine 0.5mg Fed RIST. ... 152
Figure 5.16 - Plasma insulin level profiles obtained after standardized test meal, atropine 0.75mg infusion and during the RIST. Left insert: Insulin area under the curve (AUC) calculated by the trapezoid rule for the 60 to 100min after saline (Control Fed) or atropine 0.75mg (Atropine 0.75mg Fed) infusion and before starting the fed RIST. Intravenous infusions over 10min of either atropine 0.75mg or saline were administrated 50min after feeding the meal and 50min before starting the fed RIST. Right insert: Insulin area under the curve (AUC) calculated by the trapezoid rule for Control Fed and Atropine 0.75mg Fed RIST. ... 154
Figure 5.17 - Plasma C-peptide level profiles obtained after standardized test meal, atropine 0.75mg infusion and during the RIST. Left insert: C-peptide area under the curve (AUC) calculated by the trapezoid rule for the 60 to 100min after saline (Control Fed) or atropine 0.75mg (Atropine 0.75mg Fed) infusion and before starting the fed RIST. Intravenous infusions over 10min of either atropine 0.75mg or saline were administrated 50min after feeding the meal and 50min before starting the fed RIST. Right insert: C-peptide area under the curve (AUC) calculated by the trapezoid rule for Control Fed and Atropine 0.75mg Fed RIST ... 155
Figure 6.1 - Biochemical parameters (glycemia (A), insulin (B) and C-Peptide (C)) profiles measured at specific time points during 100min after ingestion of the standardized test meal (0min) and before performing the RIST in the fed state (100min), in lean and overweight subjects. The right inserts correspond to the area under the curve (AUC) of glucose, insulin and C-peptide, respectively, calculated by the trapezoid rule for the 100min after feeding the meal ... 168
Figure 6.2 –Mean dynamic curves for the Rapid Insulin Sensitivity Test (RIST) performed on 24h-fast (simple line) and postprandial (bold line) states, in overweight subjects ... 170
Figure 6.4 –Standardized test meal increases insulin sensitivity both in lean and overweight subjects ... 172
Figure 6.5 - The contribution of the HISS-dependent component of total insulin action is lower in overweight than in lean subjects ... 173
Figure 6.6 - Plasma insulin profiles obtained during the 24h-fast (A) and fed RIST (B), in both lean and overweight subjects.Left insert: Insulin area under the curve (AUC) calculated by the trapezoid rule for 24h-fast RIST in both lean and overweight subjects. Right insert: Insulin area under the curve (AUC) calculated by the trapezoid rule for fed RIST in both lean and overweight subjects ... 175
Figure 6.7 - Plasma C-peptide profiles obtained during the 24h-fast (A) and fed RIST (B), in both lean and overweight subjects. Left insert: C-peptide area under the curve (AUC) calculated by the trapezoid rule for 24h-fast RIST in both lean and overweight subjects. Right insert: C-peptide area under the curve (AUC) calculated by the trapezoid rule for fed RIST in both lean and overweight subjects ... 176
Figure 7.1 - Glycemic profile at specific time points determined after DBcAMP 0.01, 0.1 and 1mg/kg ipv infusion ... 186
Figure 7.2 - Insulin sensitivity decreases after DBcAMP 0.01, 0.1 and 1mg/kg ipv infusion ... 187
Figure 7.3 - Insulin sensitivity decreases after DBcAMP 0.01mg/kg infusion by 27.22.1%, after DBcAMP 0.1mg/kg infusion by 51.612.2% and after DBcAMP 1mg/kg infusion by 47.214.1% ... 188
Figure 7.4 –Effect of DBcAMP on plasma insulin levels... 189
Figure 7.5 – Glycemic profile at specific time points determined after glucagon 0.5, 1, 2.5, 5, 10, 200ng/kg, 2 and 20g/kg ipv infusion ... 191
Figure 7.6 - Insulin sensitivity decreases after glucagon in a dose-dependent manner, for the ipv glucagon doses tested ... 192
Figure 7.7 - Insulin sensitivity decreases after glucagon 200ng/kg ipv infusion ... 194
Figure 7.8 –Effect of L-NMMA and glucagon on insulin sensitivity. ... 195
Figure 8.1 - Atropine infusion results in a HISS-dependent decreased insulin sensitivity due to blockade of the muscarinic receptors.. ... 207
Figure 8.2 - Overweight subjects have impaired insulin sensitivity due to a compromise of HISS-dependent component ... 209
Figure 8.3 - DBcAMP and glucagon produces a decrease of insulin sensitivity ... 211
LIST OF TABLES
Table I - Summary of the properties of facilitative glucose transporter (GLUT) and Na+/Glucose
co-transporter family members (SGLT) ... 21
Table II - American Diabetes Association (ADA) criteria for the diagnosis of type 2 diabetes mellitus (T2D), impaired fasting glucose (IFG) and impaired glucose tolerance (IGT). ... 47
Table III – Composition of the standardized test meal according to the supplier (Proalimentar,
Portugal) ... 104
Table IV – Fasting and postprandial basal values of glycemia, insulin, C-Peptide, lactate, HDL-cholesterol, LDL-HDL-cholesterol, total cholesterol and triglycerides of the lean healthy subjects, on day 1 and day 2 ... 116
Table V - Comparison of the RIST dynamic curve main properties on the fed state in day 1 and day 2 ... 120
Table VI - Basal values of glycemia, insulin, C-Peptide, lactate, HDL-cholesterol, LDL-cholesterol, total cholesterol and triglycerides of the lean healthy subjects, in the fasted and fed state ... 122
Table VII - Comparison of the RIST dynamic curve main properties on the 24h-fast and fed state . 124
Table VIII – Fasting and postprandial basal values of glycemia, insulin, C-Peptide, lactate, HDL-cholesterol, LDL-HDL-cholesterol, total cholesterol and triglycerides of the lean healthy subjects ... 133
Table IX - Dynamic profile characteristics of the 24h-fast RIST, postprandial RIST and the HISS-dependent component of insulin action ... 135
Table X - Basal values of glycemia, insulin, C-peptide, lactate, HDL-cholesterol, LDL-cholesterol, total cholesterol and triglycerides values of the lean healthy subjects, in the control fed, atropine 0.5 and 0.75mg fed state ... 139
Table XI - Dynamic profile characteristics for the control postprandial RIST, atropine 0.5mg postprandial and the HISS-dependent component of insulin action, in lean healthy subjects ... 144
Table XII - Dynamic profile characteristics for the control postprandial RIST, atropine 0.75mg postprandial and the HISS-dependent component of insulin action, in lean healthy subjects ... 147
Table XIII – Fasting and postprandial basal values of glycemia, insulin, C-Peptide, lactate, HDL-cholesterol, LDL-HDL-cholesterol, total cholesterol and triglycerides of both overweight and lean subjects ... 167
Table XV - Dynamic profile characteristics for the 24h-fast RIST, postprandial RIST and the HISS-dependent component of insulin action, for both lean and overweight subjects ... 171
Table XVI – Effect of ipv glucagon infusion on arterial pressure ... 190
Table XVII - Effect of ipv glucagon infusion on arterial glycemia ... 190
LIST OF ABBREVIATIONS
ACh: Acetylcholine
ADA: American Diabetes Association ADP: Adenosine monophosphate Akt: Protein kinase B (Akt/PKB)
APS: Adaptor protein with PH and SH2 domains AS160: Akt substrate of 160 kDa
ATP: Adenosine triphosphate AUC: Area under the curve BAT: Brown adipose tissue BMI: Body mass index
BSO: L-buthionine-[S,R]-sulfoximine bw: Body weight
cAMP: 3‟,5‟-cyclic adenosine 5‟-monophosphate CAP: Cbl associated protein
Cbl: Casitas b-lineage lymphoma
CCAC: Canadian Council on Animal Care CCK: Cholecystokinin
CHE: Cholesterol esterase CHO: Cholesterol oxidase CoA: Coenzyme A
Da: Dalton
DAG: Diacylglycerol
DBcAMP: N6,2‟-O-dibutyryladenosine 3‟,5‟-cyclic monophosphate
EASD: European Association for the Study of Diabetes ECG: Electrocardiogram
ED50: Concentration of agonist that provokes a response halfway between the baseline and
maximum response
EDTA: Ethylenediaminetetraacetic acid
ELISA: Enzyme-Linked Immuno-Sorbent Assay
F-DAOS: N-ethyl-N-(2-hydroxy-3-sulfopropyl)-3,5-dimethoxy-4-fluoroaniline FFA: Free fatty acids
FSIVGTT: Frequently sample intravenous glucose tolerance test G: Gauge
G-6-Pase: Glucose-6-phosphatase
GIP: Glucose-dependent insulinotropic peptide GIR: Glucose infusion rate
GK: Glycerol kinase
GLP-1: Glucagon-like peptide 1 GLUT: Facilitative glucose transporter GOx: Glucose oxidase
GPO: Glycerol phosphate oxidase GSH: Reduced glutathione
H2O2: Hydrogen peroxide
H2SO4: Sulfuric acid
HbA1c: Glycosylated hemoglobin
HCl: Chloride acid
H-DAOS: N-(2-hydroxy-3-sulfopropyl)-3,5-dimethoxyaniline HDIR: HISS-dependent insulin resistance
HDL: High density lipoprotein HGP: Hepatic glucose production
HIEC: Hyperinsulinemic-Euglycemic Glucose Clamp HISS: Hepatic Insulin Sensitizing Substance
HMIT: H+-coupled myo-inositol transporter IFG: Impaired fasting glucose
IGF: Insulin-like growth factors IGT: Impaired glucose tolerance ip: Intraperitoneal
IP3: Inositol 1,4,5-triphosphate
ipv: Intraportal
IRMA: Radioimmunoradiometric assay IRS: Insulin receptor substrate
ITT: Insulin tolerance test iv: Intravenous
kg: Kilogram kJ: Kilojoule
L-NAME: NG-nitro-L arginine methyl ester L-NMMA: N-monomethyl-L-arginine M: Amount of glucose metabolized Mab: Monoclonal antibody
MAP: Mean arterial pressure
MIS: Meal-induced Insulin Sensitization NaCl: Sodium chloride
n.d.: not determined
NGT: Normal glucose tolerance NO: Nitric oxide
NOS: Nitric oxide synthase
OGTT: Oral Glucose Tolerance Test
PDK1: Phosphoinositide-dependent protein kinase-1 PEPCK: Phosphoenolpyruvate carboxykinase
PGC-1: Peroxisome proliferator-activated receptor- coactivator-1 PH: Pleckstrin homology
PI3K: Phosphoinositide-3 kinase
PIP3: Phosphatidylinositol 3,4,5-trisphosphate
PKA: Protein kinase A
PKB: Protein kinase B (Akt/PKB) PKC: Protein kinase C
PLC: Phospholipase C POD: Peroxidase
PPG: Postprandial plasma glucose RBP-4: Retinol binding protein-4 RIST: Rapid Insulin Sensitivity Test SG: Glucose effectiveness index
SI: Insulin sensitivity index
SD: Sprague-Dawley
SGLT: Sodium glucose co-transporter SH2: Src homology 2
SIClamp: Insulin sensitivity index derived from clamp
SIN-1: 3-morpholinosydnonimine hydrochloride SSPG: Steady-state plasma glucose
T2D: Type 2 diabetes TAG: Triglycerides
TCA: Trichloroacetic acid or tricarboxylic acid TMB: 3,3‟,5,5‟-tetramethylbenzidine
TNF-: Tumornecrosis factor-alpha
TRIS: 2-Amino-2-(hydroxymethyl)-1,3-propanediol VLDL: Very low density lipoprotein
ABSTRACT
Insulin action is associated with the release of the Hepatic Insulin Sensitizing Substance (HISS), which enhances peripheral glucose uptake. In the fed state, HISS release is maximal, decreasing with the duration of fasting. The prandial control of HISS action is mediated through hepatic parasympathetic - derived nitric oxide (NO), and hepatic glutathione (GSH). The current methods used to evaluate insulin sensitivity are only performed in the fasted state. The present thesis focus on the hypothesis that HISS-dependent mechanism exists in humans and can be manipulated.
In humans, a new powerful tool to characterize HISS-dependent insulin action not only in the fasted, but also in the fed state, the Rapid Insulin Sensitivity Test (RIST), was developed. The RIST can be performed with reproducible results, having no intra and inter-variability.
The decreased insulin sensitivity observed in the fasted state is potentiated following a meal, and intravenous atropine administration suppresses this effect. The partial blockade of meal-induced insulin sensitization (MIS), is consistent with the hypothesis that a hepatic parasympathetic “feeding signal” is necessary for hepatic HISS release.
When lean and overweight subjects were submitted to a 24h fasting period, the insulin action per
se, was similar in both groups studied. However, when one performed the insulin sensitivity in the fed
state, the results present within this thesis have shown that, the lower MIS observed in the overweight subjects is associated with an impairment of the HISS-dependent component. These results indicate the importance of postprandial insulin sensitivity evaluation, and also suggested that the prediabetic state can only be detected in the fed state.
RESUMO
A acção da insulina está associada à libertação da substância hepática sensibilizadora da insulina (HISS), que aumenta o aporte de glucose periférico. No estado pós-prandial, a libertação da HISS é máxima, diminuindo com o período de jejum. O controlo prandial da acção da HISS é mediado pelo sistema parassimpático hepático/óxido nítrico (NO) e pelo glutationo (GSH) hepático. Os actuais métodos utilizados para avaliar a sensibilidade à insulina são realizados no estado de jejum. A presente dissertação destaca a hipótese de que o mecanismo dependente da HISS existe em humanos, e pode ser manipulado.
Em humanos, uma robusta ferramenta para caracterizar a acção da insulina dependente da HISS, não só no estado de jejum, mas também após uma refeição, o teste rápido de sensibilidade à insulina (RIST), foi desenvolvido. O RIST pode ser realizado com reproductibilidade, e sem intra e inter-variabilidade.
A diminuição da sensibilidade à insulina observada no jejum é potenciada após uma refeição, e a administração de atropina, suprime este efeito. A inibição parcial da sensibilidade à insulina induzida pela refeição, é consistente com a hipótese de que um “sinal prandial” dependente do sistema parassimpático hepático é necessário para a libertação hepática da HISS.
Quando voluntários magros e com excesso de peso foram submetidos a um período de 24h de jejum, a acção da insulina per se, foi similar em ambos os grupos estudados. Contudo, quando
avaliados no estado pós-prandial, os resultados apresentados nesta dissertação mostraram que, a potenciação induzida pela refeição era inferior nos voluntários com excesso de peso, estando esta associada a uma alteração da componente da acção da insulina dependente da HISS. Estes resultados indicam a importância da avaliação da sensibilidade à insulina no estado pós-prandial, e sugerem também que este estado de pré-diabetes apenas pode ser detectado após a ingestão de uma refeição.
PREFACE
Diabetes is reaching pandemic proportions across the globe. Estimates from 2006 indicate that 5.9% of the world‟s population (246 million) have diabetes, and 7.1% (380 million) will have the condition by 2025, with type 2 diabetes responsible for nine in every 10 diabetes patients (Ceriello et al., 2008a).
The majority of studies and diagnosis of type 2 diabetes depend almost entirely upon determinations of fasting plasma levels of glucose and, less frequently, insulin. This approach also leads to a severe underestimation of the metabolic dysfunction that is typical of the type 2 diabetic.
It is known that well before the deterioration of fasting glucose, as glucose intolerance progresses, also the control of postprandial glucose control is lost.
A distinction has been created, to describe an intermediate stage between completely normal glucose homeostasis and the clinical entity of type 2 diabetes, which has become known as prediabetes. The prediabetic state encompasses both impaired fasting glucose and impaired glucose tolerance. The prediabetic state of insulin resistance can be diagnosed by determining the response to a test meal. Early identification and treatment of subjects with prediabetes has the potential to reduce or delay the progression to the disease, and the related complications (Woerle et al., 2004).
Some studies developed by Lautt and Macedo groups, has shown that postprandial regulation of acute metabolic response to insulin is mediated by the hepatic parasympathetic nerves (Lautt et al., 2001). Activation of this mechanism leads to the release of an hormone from the liver, referred to as hepatic insulin sensitizing substance (HISS), which acts to stimulate glucose uptake in skeletal muscle, heart and kidney (Fernandes et al., 2009; Lautt, 1999).
In the absence of the ability to release HISS in response to a meal, the metabolic effect of insulin is reduced, which leads to an increase of postprandial glucose excursions. Hence, the absence of HISS in the postprandial state might be the first metabolic defect that occurs in the prediabetic state. In this setting HISS dysfunction may contribute decisively to the progression of metabolic defects towards type 2 diabetes.
Unfortunately, the information available about the acute effect of feeding on insulin sensitivity is scarce.
The basis of this PhD thesis is associated to the implementation, in human subjects, of a new insulin sensitivity method, to evaluate insulin sensitivity, in both fasted and fed states, trying to fill the gap over postprandial insulin sensitivity measurements; and with the involvement of HISS pathway in humans on the increased insulin sensitization induced by a meal.
In insulin resistant animal models, the HISS pathway showed a different behavior from the physiological situation. This dissertation also regards studies that will allow us to understand what ensues in the absence of HISS release, in response to a meal, which takes place when the HISS pathway is pharmacologically blocked or in any state of insulin resistance.
The insulin antagonist hormone, glucagon, have been shown to be altered by a dysfunction of the autonomic nervous system. As the HISS pathway can also be influenced by the autonomic nervous system, it will be very interesting to evaluate the role of glucagon in prediabetes, and on the HISS pathway.
Additionally, other studies revealed the increased levels of cAMP (through the activation of adenylate cyclase, by glucagon) are vigorously related to the decreased hepatic GSH content. Since hepatic GSH is fundamental to HISS synthesis/release, it is relevant to approach the relationship between glucagon and HISS pathway.
This dissertation also considers studies related to the axis prediabetes, glucagon, HISS secretion/action and insulin resistance, in healthy animals.
1. GENERAL INTRODUCTION
1.1. GLUCOSE HOMEOSTASIS
Plasma glucose concentration is a function of the rate of glucose entering the circulation (glucose appearance) balanced by the rate of glucose removal from the circulation (glucose disappearance).
1.1.1. Physiological glucose metabolism
Circulating glucose levels are derived from three sources: intestinal absorption during the fed state, glycogenolysis, and gluconeogenesis. The major determinant of how quickly glucose appears in the circulation during the fed state is the rate of gastric emptying. Other sources of circulating glucose are derived chiefly from hepatic processes: glycogenolysis, the breakdown of glycogen, the polymerized storage form of glucose; and gluconeogenesis, the formation of glucose primarily from lactate and amino acids during the fasting state (Gerich, 1993).
The main tissues that regulate blood glucose levels are the liver (by glucose production and uptake) and skeletal muscle (glucose uptake).
As hepatic glycogen decreases, blood glucose levels fall, as does insulin secretion. A decrease in plasma insulin leads to an increase in glucagon secretion, mobilization of gluconeogenic precursors and alternative fuels, such as, free fatty acids (FFA), and an increase in hepatic gluconeogenesis. The first of these reactions includes conversion of pyruvate to oxaloacetate to phosphoenolpyruvate. The second of these reactions, is the conversion of fructose-1,6-bisphosphate to fructose-6-phosphate, which represents the rate-limiting reaction for gluconeogenesis. The final reaction is the conversion of glucose-6-phosphate to free glucose, which is necessary for glucose to enter the plasma, and to the hepatocytes (Figure 1.1).
The rate-limiting step of glycolysis is the conversion of fructose-6-phosphate to fructose-1,6-bisphosphate, requiring an ATP and the enzyme phosphofructokinase-1. This step is considered irreversible. The other two irreversible steps are the conversion of glucose to glucose-6-phosphate by hexokinase/glucokinase and the conversion of phosphoenolpyruvate to pyruvate by pyruvate kinase (Figure 1.1). These three reactions are significant because they are the major obstacles that must be overcome in the formation of glucose during gluconeogenic reactions.
the tricarboxylic acid (TCA) cycle. Under anaerobic conditions the cells rely on glycolysis for ATP, and pyruvate is converted to lactate. Conversion of pyruvate to lactate regenerates cofactors needed for glycolysis (Pickup et al., 2003).
1.1.2. Hormonal regulation of glucose metabolism
The glucoregulatory hormones of the body are designed to maintain circulating glucose concentrations in a relatively narrow range.
In the fasting state, glucose leaves the circulation at a constant rate, which indicates that rates of glucose production and utilization are equal. After a meal, glucose absorption results in rates of exogenous glucose delivery into the circulation that can be more than twice the rate of postabsorptive endogenous glucose production, depending on the carbohydrate content of the meal and the rate and degree of glucose absorption. As glucose is absorbed, endogenous glucose production is suppressed, and glucose utilization by liver, muscle, and fat accelerates (Radziuk et al., 2001). With fasting, as plasma glucose decreases, endogenous glucose production increases. The main source of endogenous glucose production is the liver. Renal gluconeogenesis contributes substantially to the systemic glucose pool, only during periods of extreme starvation. Although most tissues have the ability to hydrolyze glycogen, only the liver and kidneys contain glucose-6-phosphatase, the enzyme necessary for the release of glucose into the circulation.
In the following paragraphs, the main key players in the regulation of glucose homeostasis will be approached. Glucoregulatory hormones include insulin, glucagon, somatostatin, amylin, cholecystokinin (CCK), pancreatic polypeptide, glucagon-like peptide 1 (GLP-1), glucose-dependent insulinotropic peptide (GIP), ghrelin, catecholamines (epinephrine and norepinephrine), cortisol, and growth hormone. Of these, insulin and amylin are derived from the pancreatic -cells, glucagon from the pancreatic -cells, somatostatin from the pancreatic -cells and pancreatic polypeptide from the PP cells of the pancreas; GLP-1 from the L-cells, GIP from the K-cells and CCK from the I-cells of the intestine.
1.1.2.1. Pancreatic hormones
Insulin
Like many hormones, insulin exerts its actions through binding to specific receptors present on many cells of the body, including fat, liver, and muscle cells. The primary action of insulin is to stimulate glucose disappearance. Insulin helps control postprandial glucose in three ways. Initially, insulin signals the cells of insulin-sensitive peripheral tissues, mainly skeletal muscle, to increase plasma glucose uptake (Gerich et al., 1976). Secondly, insulin acts on the liver to promote glycogenesis. Finally, insulin simultaneously inhibits glucagon secretion from pancreatic -cells, thus signalling the liver to stop producing glucose via glycogenolysis and gluconeogenesis (Figure 1.1). All of these actions reduce blood glucose. Other actions of insulin include the stimulation of fat synthesis, promotion of triglyceride storage in fat cells, promotion of protein synthesis in the liver and muscle, and proliferation of cell growth (Pickup et al., 2003).
Insulin action is carefully regulated in response to circulating glucose concentrations. Insulin is not secreted if the blood glucose concentration is ≤60mg/dl, but is secreted in increasing amounts, as glucose concentrations increase beyond this threshold (Gerich, 1993).
Insulin decreases gluconeogenesis by decreasing intracellular 3‟,5‟-cyclic adenosine 5‟ -monophosphate (cAMP) levels, which inhibits phosphorylation of enzymes. Insulin also inhibits hepatic glucose production indirectly by restraining lipolysis and proteolysis systemically, which reduces delivery of glucose precursors to the liver (DeFronzo, 1988; DeFronzo, 2004).
Since the peripheral action of insulin is a central aspect of this thesis, it will be therefore discussed in more detail in the following sections (Section 1.2).
Glucagon
Glucagon has a potent effect on hepatic glucose production by stimulating both glycogenolysis and gluconeogenesis, and it increases glucose output within minutes (Figure 1.1). Glucagon‟s effects on gluconeogenesis are persistent, whereas its effects on glycogenolysis are short-lived (Gerich et al., 1988). Glucagon stimulates gluconeogenesis by increasing intracellular cAMP levels. Increased hepatic glucose production, in turn, results in suppression of glucagon secretion (Gerich et al., 1976).
Since one of the chapters of this thesis is related with the glucagon‟s effect on insulin action, it will be therefore discussed in more detail in the following sections (Section 1.3).
Somatostatin
Somatostatin (somatotropin release-inhibiting factor or SRIF) is expressed by neurons in the hypothalamus and other central nervous system sites, and in numerous other tissues, including the pancreatic -cells and D-cells of the gastrointestinal tract. Somatostatin secretion is regulated by a combination of nutrients (glucose, aminoacids, fatty acids, ketone bodies), endocrine factors (insulin, glucagon, GIP, GLP-1, CCK) and neural factors (ACh, vasoactive intestinal polypeptide, gastrin-releasing polypeptide) (Pickup et al., 2003). Within the pancreatic islets, somatostatin released from -cells is a potencially important paracrine inhibitor of insulin and glucagon secretion from adjacent
- and -cells (Samols et al., 1988).
Amylin
Amylin (islet amyloid polypeptide or IAPP), a 37 aminoacid peptide, is a neuroendocrine hormone co-expressed and co-secreted with insulin by pancreatic -cells in response to nutrient stimuli (Koda et al., 1992). Studies in humans have demonstrated that the secretory and plasma concentration profiles of insulin and amylin are similar with low fasting concentrations and increases in response to nutrient intake (Young, 2005). Preclinical findings indicate that amylin works with insulin to help coordinate the rate of glucose appearance and disappearance in the circulation, thereby preventing an abnormal rise in glucose concentrations.
thus, the rate at which nutrients are delivered from the stomach to the small intestine for absorption (Samsom et al., 2000). In addition to its effects on glucagon secretion and the rate of gastric emptying, amylin dose-dependently reduces food intake and body weight in animal models (Geary, 1999; Rushing et al., 2001).
In summary, amylin works to regulate the rate of glucose appearance from both endogenous (liver-derived) and exogenous (meal-derived) sources, and insulin regulates the rate of glucose disappearance (Buse et al., 2002; Young, 2005).
Pancreatic polypeptide
The pancreatic polypeptide is a 36 aminoacid peptide produced by the PP cells that lie peripherally in islets from the head of the pancreas, and are also sparsely scattered throughout the exocrine parenchyma. Secretion of pancreatic polypeptide is mainly under autonomic control; it is released following feeding or during hypoglycemia, mainly via cholinergic parasympathetic stimulation (Pickup et al., 2003).
The only physiological effects that are recognized in humans are the inhibition of gall bladder contraction, and pancreatic enzyme secretion. Its effect is biphasic in that pancreatic polypeptide initially enhances secretion, and then inhibits secretion. It increases gastric emptying and gut motility, and also relaxes pyloric and ileocecocolic sphincters, colon, and gallbladder. PP levels increase after ingestion of food and remain elevated from 4–8h (Batterham et al., 2003).
1.1.2.2. Gastrointestinal hormones
Cholecystokinin (CCK)
Cholecystokinin (CCK) is a member of the “gut–brain” family of peptide hormones. It is secreted by enteroendocrine cells (I-cells) located in the mucosa of the duodenum, jejunum, and proximal ileum, as well as by specialized neurons in the myenteric plexus and brain. CCK performs numerous regulatory functions in the gut and the brain.
In the gastrointestinal system, CCK inhibits gastric motility and emptying via a capsaicin sensitive vagal pathway. The effects on emptying are via its action on the proximal stomach and pylorus. CCK is also involved in the regulation of food intake. It is released in the gut in response to a meal and acts via vagal afferents to induce satiety. CCK has been implicated in gallbladder contraction, pancreatic secretion, and intestinal motility (Chua et al., 2006).
or hormonal regulator of enteroinsular activity remains uncertain, although high concentrations of the peptide clearly stimulate insulin secretion (Liddle, 1995).
Glucose-dependent insulinotropic peptide (GIP)
The intricacies of glucose homeostasis become clearer when considering the role of gut peptides. By the late 1960s, some authors demonstrated that ingested food caused a more potent release of insulin than glucose infused intravenously (Perley et al., 1967). This effect, termed the “incretin effect,” suggested that signals from the gut are important in the hormonal regulation of glucose disappearance.
Several incretin hormones have been characterized, and the dominant ones for glucose homeostasis are glucose-dependent insulinotropic peptide (GIP) and glucagon-like peptide 1 (GLP-1).
GIP is a 42 aminoacid peptide produced predominantly in duodenal K-cells in the proximal small intestine. GIP has also been localized in the central nervous system, where it may play a role in the control of cell survival. The predominant stimulus for GIP secretion is nutrient intake; circulating levels of GIP are low in the fasted state, and rise within minutes of food ingestion. GIP stimulates insulin secretion and regulates fat metabolism, but does not inhibit glucagon secretion or gastric emptying (Drucker, 2007).
Glucagon-like peptide 1 (GLP-1)
gastric acid secretion, perhaps by signaling GLP-1 receptors in the brain, and thereby stimulating efferent tracts of the vagus nerve (Nauck et al., 2002). As gastric emptying slows, the postprandial glucose excursion is reduced (Nauck et al., 1997).
Ghrelin
Ghrelin is a 28 aminoacid peptide secreted mainly by neuroendocrine cells in the stomach mucosa, and it is a powerful stimulator of growth hormone release (Kojima et al., 2005). The secretion of ghrelin increases under conditions of negative energy balance, such as starvation, whereas its expression decreases under conditions of positive energy balance, such as feeding, hyperglycemia, and obesity (Hosoda et al., 2006). In addition, ghrelin has been reported to affect both insulin and glucagon secretion in vitro and in vivo (Dezaki et al., 2008; Salehi et al., 2004).
1.1.2.3. Adipocyte-derived hormones
Leptin
The ob gene was identified in genetically obese insulin resistant mice (Zhang et al., 1994), with a human homologue gene also being described. ob/ob mice were shown to have a mutation in the ob gene which resulted in absence of a functional protein-leptin. Later db/db mice were described which had the protein, but were resistant to its actions. The protein produced was named leptin. In these genetically obese ob(-/-) mice, mutations in the ob gene results in a total lack of leptin production leading to severe obesity. When leptin is administered to these mice, they decrease their food intake, their metabolic rate increases, and they lose significant amounts of weight suggesting that leptin may facilitate negative energy balance.
Leptin is an hormone predominantly produced, and secreted from the adipose tissue, but it is also expressed in low levels in the gastric epithelium, muscle placenta and CNS (Margetic et al., 2002). 20% of circulating leptin is bound to plasma proteins (Houseknecht et al., 1996), with lean humans having higher levels of the free form (Sinha et al., 1996). Bound leptin does not seem to be bioactive, although immunoassays detect both bound and free forms.
Adiponectin
Adiponectin expression occurs from an intermediate stage of adipogenesis onwards (Hu et al., 1996), and represents the most abundant protein secreted by adipose tissue. Unlike most other adipokines, plasma adiponectin levels were reduced in animal models of obesity and insulin resistance (Hotta et al., 2001; Hu et al., 1996). Administration of recombinant adiponectin to rodents resulted in increased glucose uptake and fat oxidation in muscle, reduced hepatic glucose production, and improved whole-body insulin sensitivity (Yamauchi et al., 2001).
Adiponectin transgenic mice showed partial amelioration of insulin resistance and diabetes and suppression of endogenous glucose production (Combs et al., 2004). In contrast, adiponectin-deficient mice exhibited insulin resistance and glucose intolerance (Maeda et al., 2002; Nawrocki et al., 2006). In addition to its insulin-sensitizing effects, adiponectin may alter glucose metabolism through stimulation of pancreatic insulin secretion in vivo (Okamoto et al., 2008).
Apart from its peripheral actions, adiponectin was shown to modulate food intake and energy expenditure during fasting (increased food intake and reduced energy expenditure) and re-feeding (opposite effects), through its effects in the central nervous system (Kubota et al., 2007). In humans, plasma adiponectin levels were correlated negatively with adiposity (Gavrila et al., 2003), insulin resistance (Abbasi et al., 2004; Yang et al., 2004), type 2 diabetes (Heidemann et al., 2008), and metabolic syndrome (Arner, 2005a; Gavrila et al., 2003).
Resistin
Resistin is an adipocyte hormone expressed in visceral and subcutaneous adipose tissue. Resistin causes insulin resistance and glucose intolerance in mice. Serum resistin levels are elevated in obese rodents (Steppan et al., 2001), although studies have reported variable results (Banerjee et al., 2003).
Resistin is expressed at very low levels in human adipocytes (Arner, 2005b; Banerjee et al., 2003). Insulin and TNF- have been shown to inhibit resistin expression, which might explain the low resistin expression in the obese state (Rabe et al., 2008).
Retinol-binding protein 4 (RBP-4)
Retinol Binding Protein-4 (RBP-4) is elevated in insulin resistant adipose specific GLUT4 knockout mice, and humans with obesity and type 2 diabetes. Transgenic overexpression of human RBP-4 in wildtype mice or administration of recombinant RBP-4 to wildtype mice, was shown to cause insulin resistance through induction of hepatic expression of the gluconeogenic enzyme phosphoenolpyruvate carboxykinase, and impairment of skeletal muscle insulin signaling. In contrast, genetic deletion of RBP4 enhanced insulin sensitivity (Yang et al., 2005).
Serum RBP-4 concentrations were elevated in insulin resistant humans with obesity, impaired glucose tolerance and type 2 diabetes, and even in lean normoglycemic subjects with a strong family history of type 2 diabetes (Graham et al., 2006; Yang et al., 2005). Previous studies shown that serum RBP4 levels are increased in many insulin-resistant states induced by genetic and dietary factors (Graham et al., 2006; Yang et al., 2005).
Visfatin
Visfatin is a newly discovered adipocyte hormone with a direct relationship between plasma visfatin levels and type 2 diabetes mellitus. Visfatin binds to the insulin receptor at a site distinct from that of insulin, and causes hypoglycemia by reducing glucose release from liver cells, and stimulating glucose utilization in adipocytes and myocytes (Beltowski, 2006; Rasouli et al., 2008).
Chemerin
Chemerin is a recently discovered chemokine highly expressed in liver and white adipose tissue (Bozaoglu et al., 2007; Goralski et al., 2007). It exerts potent anti-inflammatory effects on activated macrophages expressing the chemerin receptor CMKLR1 (chemokine-like receptor-1), in a cysteine protease-dependent manner. Furthermore, chemerin is crucial for normal adipocyte differentiation, and modulates the expression of adipocyte genes involved in glucose and lipid homeostasis, such as GLUT4, fatty acid synthase, and adiponectin via its own receptor (Bozaoglu et al., 2007; Goralski et al., 2007; Roh et al., 2007).
In 3T3-L1 adipocytes, chemerin was reported to enhance insulin-stimulated glucose uptake and insulin receptor substrate-1 tyrosine phosphorylation, suggesting that, chemerin may increase insulin sensitivity in adipose tissue (Takahashi et al., 2008). In humans, chemerin levels did not differ significantly between subjects with type 2 diabetes and normal controls. However, in normal glucose tolerant subjects, chemerin levels were associated significantly with BMI, triglycerides, and blood pressure (Bozaoglu et al., 2007).
Vaspin
Vaspin (Visceral Adipose tissue-derived Serine Protease Inhibitor) was identified in visceral adipose tissue of fatty rats, at an age when body weight and hyperinsulinemia peaked (Hida et al., 2005). Vaspin expression was shown to decrease with worsening of diabetes and body weight loss. It was shown to be regulated in a fat-depot specific manner, and to be associated with obesity and parameters of insulin resistance (Kloting et al., 2006). Likewise, elevated vaspin serum concentrations were correlated with obesity and impaired insulin sensitivity, whereas type 2 diabetes seemed to abrogate this correlation (Youn et al., 2008).
Apelin
Apelin is the endogenous ligand for the G-protein-coupled receptor; is expressed in the gastrointestinal tract, predominantly in the stomach with lower levels in the intestine, and none in the pancreas (Higuchi et al., 2007; Tatemoto et al., 1998; Wang et al., 2004).