www.atmos-chem-phys.net/16/8353/2016/ doi:10.5194/acp-16-8353-2016
© Author(s) 2016. CC Attribution 3.0 License.
Implementation of warm-cloud processes in a source-oriented
WRF
/
Chem model to study the effect of aerosol mixing state on fog
formation in the Central Valley of California
Hsiang-He Lee1,a, Shu-Hua Chen1, Michael J. Kleeman2, Hongliang Zhang2, Steven P. DeNero2, and David K. Joe2
1Department of Land, Air, and Water Resources, University of California, Davis, CA, USA 2Department of Civil & Environmental Engineering, University of California, Davis, CA, USA
anow at: Singapore-MIT Alliance for Research and Technology (SMART), Centre for Environmental Sensing and Modeling (CENSAM), Singapore
Correspondence to:Shu-Hua Chen ([email protected])
Received: 19 October 2015 – Published in Atmos. Chem. Phys. Discuss.: 17 November 2015 Revised: 31 May 2016 – Accepted: 20 June 2016 – Published: 12 July 2016
Abstract.The source-oriented Weather Research and
Fore-casting chemistry model (SOWC) was modified to include warm cloud processes and was applied to investigate how aerosol mixing states influence fog formation and optical properties in the atmosphere. SOWC tracks a 6-D chem-ical variable (X, Z, Y, size bins, source types, species) through an explicit simulation of atmospheric chemistry and physics. A source-oriented cloud condensation nuclei mod-ule was implemented into the SOWC model to simulate warm clouds using the modified two-moment Purdue Lin mi-crophysics scheme. The Goddard shortwave and long-wave radiation schemes were modified to interact with source-oriented aerosols and cloud droplets so that aerosol direct and indirect effects could be studied.
The enhanced SOWC model was applied to study a fog event that occurred on 17 January 2011, in the Central Val-ley of California. Tule fog occurred because an atmospheric river effectively advected high moisture into the Central Val-ley and nighttime drainage flow brought cold air from moun-tains into the valley. The SOWC model produced reason-able liquid water path, spatial distribution and duration of fog events. The inclusion of aerosol–radiation interaction only slightly modified simulation results since cloud opti-cal thickness dominated the radiation budget in fog events. The source-oriented mixture representation of particles re-duced cloud droplet number relative to the internal mixture approach that artificially coats hydrophobic particles with hygroscopic components. The fraction of aerosols activating
into cloud condensation nuclei (CCN) at a supersaturation of 0.5 % in the Central Valley decreased from 94 % in the in-ternal mixture model to 80 % in the source-oriented model. This increased surface energy flux by 3–5 W m−2and surface temperature by as much as 0.25 K in the daytime.
1 Introduction
at-8354 H.-H. Lee et al.: Implementation of warm-cloud processes in a source-oriented WRF/Chem model
mosphere but cools the earth’s surface (Yang et al., 2009; Koch and Del Genio, 2010). Particulate black carbon also leads to reduce relative humidity and cloud liquid water con-tent (semi-direct effect) in the mid-level atmosphere (Ack-erman et al., 2000; Koch and Del Genio, 2010). In addi-tion to these direct effects, Twomey (1974) proposed that aerosols indirectly affect the earth’s energy budget due to their ability to serve as cloud condensation nuclei (CCN), which are of great importance in cloud development, espe-cially for warm clouds in the midlatitudes to high latitudes. Large numbers of CCN produce clouds with a greater num-ber of smaller size cloud droplets (Chen et al., 2008). These smaller cloud droplets raise cloud albedo (the first indirect effect) and also suppress the formation of precipitation and prolong cloud lifetime (the second indirect effect) (Albrecht, 1989). The direct, semi-direct and indirect effects of aerosol particles modify the energy budgets in the atmosphere and on the surface, with corresponding changes in atmospheric sta-bility. The 2007 IPCC report (IPCC, 2007) concluded that the net forcing of all aerosols could be either positive or negative in the range from−0.7 to+0.1 W m−2. The majority of this uncertainty is associated with the semi-direct and indirect ef-fects due to the complexity of aerosol–cloud interactions.
The magnitude of the aerosol semi-direct and indirect ef-fects depends on the number concentration, size and compo-sition of the atmospheric aerosol particles that act as CCN or ice nuclei (IN) (Lohmann and Feichter, 2005; Chen et al., 2008). Particles with hygroscopic components such as water-soluble ions (Na+, Cl−, SO24−, NO−3 etc.) readily act as CCN (Chen and Lamb, 1994). Particles that contain hydrophobic components such as freshly emitted organic carbon or ele-mental carbon must become coated with hygroscopic ma-terial before they will easily serve as CCN (Dusek et al., 2006). Some studies showed the importance of the aerosol mixing state on CCN activation using field campaign data and numerical modeling. Cubison et al. (2008) focused on the relationship between the CCN number concentration and the physical and chemical properties of aerosols in the urban area in California. Based on the results from a cloud parcel model and observed CCN number, they found that a realistic treatment of the mixing state of the urban aerosol distribution is critical to the CCN activation prediction. Anttila (2010) also used an adiabatic cloud parcel model to investigate the importance of the particle mixing state and hygroscopicity to CCN activation. They commented that the differences be-tween externally and internally mixed aerosols in urban and rural environments could reach up to 35 %. Both modeling studies investigated the effect of aerosol mixing state on CCN formation based on an ideal cloud parcel model. While obser-vations from Ma et al. (2010) and Lance et al. (2013) showed consistent results with these modeled CCN studies, a more sophisticated 3-D numerical model is needed to further study this issue. Mineral dust particles (Motoi, 1951; Georgii and Kleinjung, 1967) commonly have a favorable arrangement of surface structure that allows them to serve as IN.
Sec-ondary coatings that condense on mineral dust particles may reduce their ability to serve as IN (Sullivan et al., 2010) but increase their ability to serve as CCN (Li and Shao, 2009). From the IPAC-NC (Influence of Pollution on Aerosols and Cloud Microphysics in North China) field campaign data, Ma et al. (2010) showed that dust particles can become the pre-dominant source of CCN in a few hours after being coated by high pollution acids. This aging process has been parame-terized in numerical models (Lesins et al., 2002) but how the aging timescale should respond to changes in temperature, humidity, oxidant concentrations and/or emissions rates is not described in most models. All of these mentioned above point to the importance of the particle mixing state when pre-dicting CCN/IN concentrations.
The standard Weather Research and Forecasting (WRF) model, including the chemistry component (WRF/Chem), permits the simulation of the combined direct, indirect and semi-direct effects of aerosols (Chapman et al., 2009; Fast et al., 2006; Grell et al., 2005). WRF/Chem version 3.1.1 has sophisticated packages to represent chemistry processes (i.e., gas-phase reaction, gas-to-particle conversion, coagu-lation, etc.) and aerosol size and composition (Zaveri et al., 2008; Ackermann et al., 1998; Binkowski and Shankar, 1995; Schell et al., 2001). The Modal Aerosol Dynamics Model for Europe with Secondary Organic Aerosol Model (MADE-SORGAM) and the Model for Simulating Aerosol Interac-tions and Chemistry (MOSAIC) are commonly used aerosol schemes in the WRF/Chem model. Both schemes have in-organic, organic and secondary organic aerosols and contain aerosol formation processes including nucleation, condensa-tion and coagulacondensa-tion. The main difference between MADE-SORGAM and MOSAIC is the representation of aerosol size distributions. MADE-SORGAM uses three log-normal modes (Aitken, accumulation and coarse) while MOSAIC uses four (or eight) aerosol size sections (bins) from 39 nm to 10 µm, respectively. The details of MADE-SORGAM are described in Binkowski and Shankar (1995), Ackermann et al. (1998), Schell et al. (2001) and Grell et al. (2005) and the details of MOSAIC are given in Zaveri et al. (2008).
Table 1.Chemical species that are carried in the AQC/CLDAQC “species” dimension. All species are in concentrations (µg m−3) except for the last two elements (i.e., 39 and 40), which carry the number concentration (# m−3) and radius (m). SOA denotes secondary organic aerosol.
Chemical species Chemical species
1 Elemental carbon 21 SOA from lumped alkane 1 2 Organic carbon 22 SOA from lumped alkane 2 3 Sodium 23 SOA from lumped aromatic 1 4 Chloride 24 SOA from lumped aromatic 2 5 Ammonium 25 SOA from lumped aromatic 1 6 Sodium 26 SOA from lumped aromatic 2 7 Nitrate 27 SOA from lumped aromatic 1 8 Other 28 SOA from lumped aromatic 2 9 Metal 29 SOA from lumped alkene 1 10 Unknown 30 SOA from lumped alkene 2 11 Copper I 31 SOA from lumped alpha-Pinene 1 12 Copper II 32 SOA from lumped alpha-Pinene 2 13 Manganese 2 33 SOA from lumped beta-Pinene 1 14 Manganese 3 34 SOA from lumped beta-Pinene 2 15 FE2 35 SOA from lumped toluene 1 16 FE3 36 SOA from lumped toluene 2 17 S4 37 Hydrogen ion
18 Air (hollow sea salt particles) 38 Water
19 NO3 39 Number concentration 20 Non-explicit SOA 40 Particle mean volume radius
The primary goal of this research is to quantify the effect of assumptions about particle mixing state on predicted cloud droplet formation within the WRF/Chem model. Warm cloud processes in the Purdue Lin scheme (Chen and Sun, 2002) were modified in the source-oriented WRF/Chem (SOWC) model to investigate the impact of aerosol mixing state on the characteristics of a fog event in the Central Valley of California. The SOWC model explicitly predicts particle mixing state in the presence of emissions, transport, coagula-tion, chemical transformation and deposition. The integration of warm-cloud processes with the source-oriented treatment of particles in the current study provides a more realistic ap-proach to understand how mixing state influences direct, in-direct and semi-inin-direct effects of anthropogenic aerosols.
This paper is organized as follows: the model description and development of warm cloud processes are introduced in Sect. 2; observational data and numerical experiment design are presented in Sect. 3; results are discussed in Sect. 4 and the summary and discussion are provided in Sect. 5.
2 Model description and development
2.1 SOWC
WRF is a compressible, non-hydrostatic regional meteorol-ogy model, which uses the Arakawa C grid and terrain-following hydrostatic pressure coordinates. The governing equations of the model are written in flux form and can be
solved using a range of solution schemes. In the present study, the Runge–Kutta third-order time scheme was em-ployed, and fifth- and third-order advection schemes were chosen for the horizontal and vertical directions, respectively (Skamarock et al., 2008). WRF/Chem simulates trace gas and particle chemical concentrations concurrently with the meteorological fields using the same grid structure, the same advection scheme and the same physics schemes for sub-grid scale transport (Grell et al., 2005). The SOWC model was developed based on WRF/Chem V3.1.1 with signif-icant modifications throughout the code to enable the use of 6-D variables. The standard WRF/Chem model tracks 3-D chemistries in a 4-D variable (X,Z, Y, species). The SOWC model tracks a 6-D chemical variable “AQC” (X,Z,
8356 H.-H. Lee et al.: Implementation of warm-cloud processes in a source-oriented WRF/Chem model
are 0.055, 0.1105, 0.221, 0.4415, 0.8835, 1.767, 3.535 and 7.0693 microns. Note that the SOWC model uses moving size bins whose sizes change in response to gas-particle conversion during model simulations. The model conserves aerosol mass concentration throughout the simulation of at-mospheric processes including emissions, transport, depo-sition, coagulation and condensation/evaporation. The gas-phase species emitted from different sources in each grid cell are not tracked separately in the SOWC model at the present time. In the current study, the initial and boundary condi-tions of aerosol particles are based on observacondi-tions from the California Regional Particulate Air Quality Study (CRPAQS) (Ying et al., 2008). The distribution of particle emissions for different bins for every source are calculated using emissions inventories provided by the California Air Resources Board (CARB) along with measured chemical speciation profiles (Ying et al., 2008). Further details of the SOWC model struc-ture and source-oriented chemistry processes are described by Zhang et al. (2014) and Joe et al. (2014).
2.2 Cloud microphysics scheme
The original Purdue Lin microphysics scheme was de-signed as a one-moment water mass conserved microphysics scheme with five hydrometeors: cloud water, rain, cloud ice, snow and graupel (Lin et al., 1983; Chen and Sun, 2002). Chapman et al. (2009) added a prognostic treatment of cloud droplet number (Ghan et al., 1997) to the Purdue Lin scheme to make a two-moment treatment of cloud water within WRF/Chem. In our study, a source-oriented CCN module was added to the SOWC model to track size-resolved infor-mation about activated CCN from various aerosol sources. A new source-oriented 6-D cloud variable, “CLDAQC” (X,Z,
Y, size bins, source types, species) was added to SOWC to describe source-oriented clouds. Droplet radius and number concentration are once again stored as the last two elements in the species dimension of the CLDAQC variable. In the Purdue Lin scheme, all microphysics processes are parame-terized with water mass, except autoconversion. Chapman et al. (2009) added the autoconversion parameterization from Liu et al. (2005) into the Purdue Lin microphysics, which de-pends on cloud droplet number. Chapman et al. (2009) also specified changes to cloud droplet number proportional to the microphysics process rate of cloud water mass. For example, when 10 % cloud water becomes rainwater after autoconver-sion, 10 % cloud droplets will be moved at the same time.
The continuity equation of the mass-coupled mixing ratio of CLDAQC can be written as follows:
∂CLDAQC
∂t = ∇ ·VCLDAQC+ ∇ ·K∇CLDAQC
+PAACT+Smicro, (1)
where V is the 3-D wind vector andK is the eddy diffu-sion coefficient. The first two terms on the right-hand side of Eq. (1) are the flux divergence of CLDAQC (transport)
Cloud water (CLDAQC)
Water vapor
Cloud ice Precipitation
(rain/snow/graupel) PAACT
P
CE
V
P
PIMLT
PIHOM PRAUT
PRACW/PSACW/PGACW AQC AQC
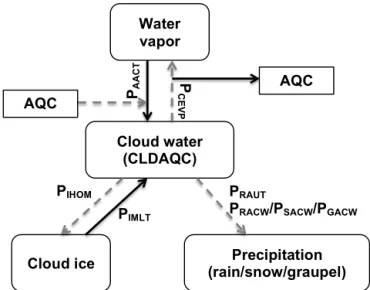
Figure 1.Cloud physics processes that are involved with cloud
par-ticles in the SOWC model with a 6-D aerosol variable (AQC) and a 6-D cloud variable (CLDAQC) included. The black solid arrow and the gray dashed arrow indicate the source and the sink processes of cloud water and 6-D CLDAQC, as well as 6-D AQC, respectively.
and sub-grid eddy mixing, respectively. Figure 1 shows the schematic diagram of the sinks and sources of CLDAQC in the cloud microphysics processes (PAACT and Smicro). Aerosol activation (PAACT) is the main source of CLDAQC. The calculation of aerosol activation is based on a maximum supersaturation determined from a Gaussian spectrum of up-draft velocities and aerosol chemistry composition for each size bin (Abdul-Razzak and Ghan, 2002). This parameteri-zation of aerosol activation was implemented in WRF/Chem model (Chapman et al., 2009) and is used in this study. Aerosol activation was calculated each time step. Once the environment reached the critical supersaturation, AQC acti-vated as CCN. Water vapor condenses at a diffusion-limited rate to cloud droplets (water molecules transferred from va-por to cloud in Purdue Lin scheme) and particle mass/number is transferred from the interstitial aerosol variable (AQC) to the cloud-borne aerosol variable (CLDAQC). The Purdue Lin microphysics scheme uses a saturation adjustment approach (i.e., it adjusts water vapor to the saturation mixing ratio), so CCN activation is calculated before saturation adjustment. After saturation adjustment, the condensation rate due to va-por diffusion is prova-portional to particle size (Rogers and Yau, 1989). Results from CCN activation tests at relevant super-saturation are discussed in Sect. 4.3.
cloud water and cloud ice can also occur through homoge-nous freezing of cloud water to ice (PIHOM) and melting of cloud ice to cloud water (PIMLT). Finally, the condensa-tion (associated with PACCT) and evaporation of cloud wa-ter (PCEVP) are implicitly taken into account in the Purdue Lin microphysics scheme. When cloud droplets fully evapo-rate (sink of CLDAQC), the residual cores are released back into the corresponding source type and size bin of the aerosol (AQC) variable.
2.3 Radiation schemes
The NASA Goddard shortwave and long-wave radiation schemes (Chou and Suarez, 1999b, 2001b) are used in con-junction with the source-oriented cloud droplet algorithms in the enhanced SOWC model. Absorption of radiation by water vapor, ozone, oxygen, carbon dioxide, cloud droplets and aerosol particles is considered. Interactions among the absorption and scattering by clouds and aerosols (Mie scat-tering), molecules (Rayleigh scattering) and the surface are fully accounted for Skamarock et al. (2008). Three main op-tical parameters are calculated for each model layer to de-scribe the influence of aerosols on the radiation: aerosol op-tical thickness (τ), single scattering albedo (ω) and asymme-try factor (g). In the present study, the numerical code de-scribed by Ying and Kleeman (2003) was implemented to calculate the optical properties of source-oriented particles. The original numerical code of Mie scattering developed by Bohren and Huffman (1983) was used to calculate the parti-cle extinction efficiency, scattering efficiency and asymmetry factor. The partial molar refractive index approach described in Stelson (1990) was used to estimate the mean refractive index for multi-component aerosols.
For any wavelength of shortwave or long-wave radia-tion (λ), the aerosol optical thickness (τa) of a model layer with depth h (m) containing a number concentrationna(r) (# m−3µm−1) of droplets with radiusr(µm) is given by
τa(λ)=π h ∞ Z
0
Qe(λ, r)r2na(r)dr, (2)
where Qe is the dimensionless extinction efficiency. The equivalent definition of aerosol optical thickness for discrete size binsj with a mean radiusrj(µm) can be written as
τa(λ)=π h n X
i
Xm
jQei,j(λ, r)r 2
i,jNi,j, (3)
where subscriptirefers to emission source, subscriptjrefers to size,nis the number of particle source types andmis the number of particle sizes. N (# m−3) is the number of par-ticles. The mean asymmetry factor (ga) and single scatter-ing albedo (ωa) are calculated using the method described in
Yang (2000):
ga(λ)=
Pn
i
Pm
jQsi,j(λ, r)gi,j(λ, r)Ni,jπ ri,j2
Pn
i
Pm
jQsi,j(λ, r)Ni,jπ ri,j2
, (4)
ωa(λ)=
Pn i
Pm
jQsi,j(λ, r)Ni,jπ ri,j2
Pn
i
Pm
jQei,j(λ, r)Ni,jπ ri,j2
, (5)
whereQs is the dimensionless scattering efficiency. All of the optical parameters are functions of the wavelength (λ) of incident radiation.
In the original Goddard radiation schemes, cloud droplets are assigned to a monodisperse size distribution (mean ef-fective radius) which depends on the water mass and num-ber concentration. The source-oriented cloud (CLDAQC) contains size distribution and chemistry information which is more realistic than the monodisperse assumption. Equa-tions (3)–(5) are applied to all size bins of not only the AQC but also the CLDAQC variables to calculate optical proper-ties and radiative forcing.
3 Numerical experiment designs
3.1 Fog event
8358 H.-H. Lee et al.: Implementation of warm-cloud processes in a source-oriented WRF/Chem model
with relative humidity below 100 % due to high hydroscopic pollutants (Ma et al., 2010).
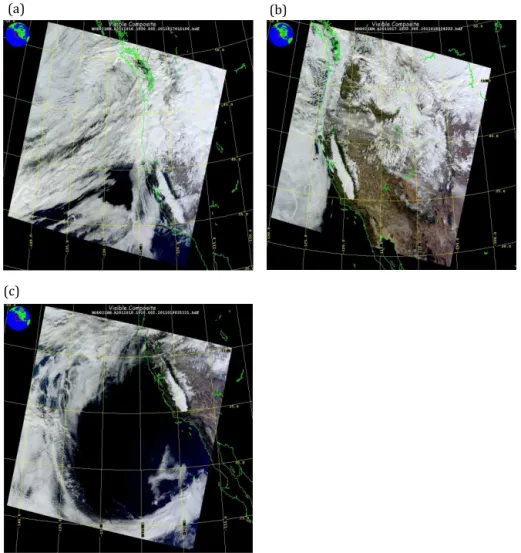
Tule fogs (radiation fog) frequently form in the Central Valley of California during the winter season (Hayes et al., 1984). Winter in the Central Valley is associated with the maximum concentration of airborne particulate matter (PM) (Chow et al., 1993) which is composed of aerosol particles that can act as CCN. We chose Tule fog as our case study since it is important in safety, hydrology and agriculture in California, and aerosols in California have been carefully in-vestigated using the SOWC model (Joe et al., 2014; Zhang et al., 2014). In the present study, a thick fog event that occurred on 16 and 17 January 2011 (Fig. 2) was chosen to inves-tigate the impact of aging-process-included aerosol–cloud– radiation interactions on fog formation. Fog started form-ing over the northern Central Valley on 13 January, with ob-served surface relative humidity reaching 95–100 %, and ex-tended to the southern Central Valley on 14 January. The fog became thicker on 16 January and reached a maximum on 17 January (Fig. 2). This is evident by retrieved cloud opti-cal thickness from Moderate Resolution Imaging Spectrora-diometer (MODIS) (discussed later). The fog started dissi-pating from the northern Central Valley on 18 January and fully dissipated on 19 January (Fig. 2c).
In addition to calm wind and radiative cooling, high mois-ture is an important ingredient to a Tule fog event in the Central Valley, California. Figure 3 shows the time series of column-integrated water vapor, sea level pressure and 850 hPa wind vectors from ECMWF Interim reanalysis data. On 11 January, the column water vapor (CWV) was very low, less than 10 mm, over the Central Valley (Fig. 3a). Moisture was advected into the Central Valley (Fig. 3b) by a winter cy-clone moving close to the northwestern coast of the United States on 12 January. A weak southwest–northeast-oriented atmospheric river with a width of 1000 km and a maxi-mum CWV of ∼26–28 mm approached the western coast and brought moisture into the Central Valley. At 00:00 UTC on 13 January (Fig. 3c), moisture content began increasing in the northern Central Valley. At night, drainage flow from the surrounding mountains brought cold air into the Central Valley, mixed with the low-level moist air, and initiated fog formation over the northern Central Valley. On 14 January (Fig. 3d), the CWV over the southern Central Valley reached 22–24 mm and fog formed over the southern Central Valley.
On 15 and 16 January, a more intense, west–southwest- to east–northeast-oriented atmospheric river advected moisture into northern California (Fig. 3e and f). The moisture in the Central Valley reached a maximum on 17 January (Fig. 3g), at the time when the fog reached its maximum thickness dur-ing the study period (Fig. 2; also see the cloud optical thick-ness discussion later). On 18 January (Fig. 3h), while high moisture and fog were still present over the southern Cen-tral Valley, the moisture decreased and the fog disappeared over the northern Central Valley. Fog fully dissipated in the Central Valley on 19 January.
According to the satellite images and surface temperature variation, the coverage and thickness of fog followed a di-urnal pattern, with thinning in the daytime and thickening at night. As mentioned earlier, the aerosol mixture state can impact fog formation and properties of cloud droplets.
3.2 Observational data
Multiple types of measurement data were used to evaluate the SOWC model performance. Moderate Resolution Imaging Spectroradiometer (MODIS) Level 2 cloud products from the Terra and Aqua satellites provide 5 km resolution cloud opti-cal thickness (COT) and liquid water path (LWP). The LWP retrieval from MODIS has been used to study low cloud and fog (Bendix et al., 2005). High-resolution MODIS data can describe fog spatial distribution and intensity but are only available once every 24 h (daytime only) from each satellite. The SOWC model predictions for temperature and moisture at the surface are also evaluated against in situ time series meteorological data from 24 surface weather stations along with net ground shortwave fluxes at 42 sites from the Cali-fornia Irrigation Management Information System (CIMIS). Measured concentrations of airborne particles were obtained from the California Ambient Air Quality Data (CAAQD) provided by the Planning & Technical Support Division (PTSD) of the California Air Resources Board (CARB). The station details of CAAQD are provided in Table 2. The loca-tions of all measurement sites are provided in Fig. 4.
4 Numerical experiment design
(a) (b)
(c)
Figure 2.MODIS true color images at(a)19:30 UTC on 16 January,(b)18:35 UTC on 17 January and(c)19:20 UTC on 18 January 2011
from the Terra satellite.
Table 2.California Ambient Air Quality Data (CAAQD) station information.
Station ID Station name Longitude (◦) Latitude (◦) 1 San Jose – Jackson Street −121.89 37.35 2 Bakersfield – 5558 Cal. Avenue −119.06 35.36 3 Fresno – 1st Street −119.77 36.78 4 Modesto – 14th Street −120.99 37.64 5 Visalia – N Church Street −119.29 36.33 6 Sacramento – T Street −121.49 38.57
In the modified cloud–radiation scheme (CRmod), the size range of cloud droplets in Eq. (3) can vary between activated CCN to 30 µm. S_ARoff_CRmod has no aerosol direct ef-fect in the radiation schemes (ARoff). The comparison of S_ARoff_CRmod and S_ARon_CRmod is used to estimate the aerosol direct effect in this study.
Each numerical experiment employed two domains with two-way nesting. Domain 1 (86×97 grid cells) had a reso-lution of 12 km, while domain 2 (127×202 grid cells) had a
8360 H.-H. Lee et al.: Implementation of warm-cloud processes in a source-oriented WRF/Chem model
(c)
(d)
(f)
(e)
(g)
(h)
(a)
(b)
Figure 3.The column-integrated water vapor (shaded; mm), 850 hPa wind vector and sea level pressure (contours; hPa) from ECMWF
Interim reanalysis at (a)00:00 UTC (16:00 local time) on 11 January, (b) 00:00 UTC on 12 January, (c) 00:00 UTC on 13 January,
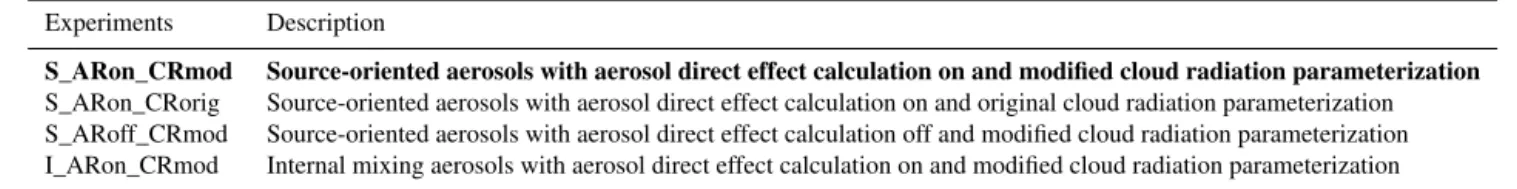
Table 3.Numerical experiment designs for this study. The bold font indicates the base case.
Experiments Description
S_ARon_CRmod Source-oriented aerosols with aerosol direct effect calculation on and modified cloud radiation parameterization
S_ARon_CRorig Source-oriented aerosols with aerosol direct effect calculation on and original cloud radiation parameterization S_ARoff_CRmod Source-oriented aerosols with aerosol direct effect calculation off and modified cloud radiation parameterization I_ARon_CRmod Internal mixing aerosols with aerosol direct effect calculation on and modified cloud radiation parameterization
20 s for the second domain. The physics schemes employed for the simulations included the modified Purdue Lin micro-physics scheme (Chen and Sun, 2002), the NASA Goddard long-wave/shortwave radiation schemes (Chou and Suarez, 1999a, 2001a), the Kain–Fritsch (KF) cumulus scheme (Kain and Fritsch, 1990; Kain, 1993) (domain 1 only), the YSU planetary boundary layer (PBL) scheme (Hong et al., 2006; Hong, 2010) and the Noah land surface model (LSM) surface scheme (Tewari et al., 2007). No cumulus scheme is used in the innermost domain (4 km resolution). The number of cloud droplets was not considered in the convective scheme in the SOWC model. The target episode had calm winds with local fog formation in the Central Valley (not propagating in through lateral boundaries). Moreover, the event occurred in the winter season when the Convective Available Potential Energy (CAPE) was small. Therefore, the KF cumulus con-vective parameterization is inactive for this case study. The meteorological initial and boundary conditions were taken from North American Regional Reanalysis (NARR), which has a spatial resolution of 32 km and a temporal resolution of 3 h.
The SOWC model tracked two 6-D variables for aerosol/cloud properties which introduce considerable com-putational burden for model simulations when compared to standard WRF/Chem model simulation (with prescribed aerosol concentration). The computational cost of the SOWC model, which is proportional to the extra information that is tracked, is approximately 25 times greater than the stan-dard WRF/Chem 3.1.1 simulation with prescribed aerosols (chem_opt=0) or approximately 5 times greater than the standard WRF/Chem 3.1.1 simulation with any chemistry option (/=0) in the current study. SOWC model simula-tions started at 00:00 UTC on 9 January (7 days prior to the start of the thick fog event) with 4-D data assimilation (FDDA), which nudges model fields in domain 1 to analy-sis including the u andv components of horizontal winds, water vapor mixing ratio and temperature above the PBL height in all simulations. This approach provides a realis-tic heterogeneous aerosol distribution and low-level temper-ature and moisture fields at the start of the thick fog simu-lation. Observations from surface stations and NARR data were used for nudging during this aerosol spin-up period. Between 00:00 UTC on 16 January and 00:00 UTC on 19 January, the SOWC model integrated without FDDA (3-day free run) during which time the effects of the different model
Figure 4.NOAA’s National Climatic Data Center (NCDC; 24
sta-tions, red dots), California Irrigation Management Information Sys-tem (CIMIS; 42 stations, black dots) and California Ambient Air Quality Data (six stations, numbers corresponding to Table 2 sta-tion ID) measurement locasta-tions. Terrain height in m is shaded.
configurations were observed and is our major time period of interest.
5 Model results
5.1 Evaluation of base case (S_ARon_CRmod) model
performance
8362 H.-H. Lee et al.: Implementation of warm-cloud processes in a source-oriented WRF
/Chem model
Terrain height contours
Figure 5.The 72 h averaged (16–18 January 2011) AQC number
concentration averaged over the first five model layers from the ex-periment S_ARon_CRmod in units of 108# m−3. Contours are ter-rain heights in m.
Temporally averaged AQC concentrations are approximately 2×10⁹# m−3, with the highest concentrations predicted in the vicinity of polluted cities (e.g., the San Francisco Bay Area, Stockton, Modesto, Sacramento, Fresno and Bakers-field), in the middle of the Central Valley, and at foothills of Sierra Nevada over the east–southeastern Central Valley.
Figure 6 shows the comparison of simulated nitrate (NO−3), sulfate (SO24−), ammonium (NH+4) and soluble sodium (Na+) concentrations to measured values at six mon-itoring stations (see Table 2 and Fig. 4) on 18 January 2011. Simulated sulfate and soluble sodium are in reason-able (> 80 %) agreement with measurements but nitrate and ammonium concentrations were underpredicted by approxi-mately 70 %. The cause for this discrepancy is unknown, but one possibility is that after fog dissipates on 18 January; most ammonium and nitrate are released back to the gas phase. This potentially explains why nitrate and ammonium are sig-nificantly underestimated in the condensed phase (Fig. 6). Unfortunately, we only have observations on the last day of the simulation (18 January) when fog almost dissipated. With these limited observations, it is difficult to effectively evaluate the cause of the underestimation of nitrate and
am- 1.87 5.66 5.64 7.54 6.93 4.51 0.05 2.20
1.06 1.42 1.46 0.19 0.04 2.12 0.81
2.19 1.34 0.11 0 2 4 6 8
Observation Source‐oriented Internally mixed
1.14 1.37
1.82 1.98 1.66
0.56 0.80 2.33 0.66 0.94 0.73 0.76 0.81 2.15 0.76 1.84 0.76 0.60 0 1 1 2 2 3 0.88 2.16 2.82 2.29 2.44 1.38 0.31 1.14 0.49 0.75 0.67 0.26 0.31 1.00 0.46 1.32 0.64 0.18 0.0 0.5 1.0 1.5 2.0 2.5 3.0 0.04 0.10 0.00
0.04 0.04 0.04 0.02
0.05 0.04 0.06
0.04 0.04 0.02 0.04 0.03 0.07 0.04 0.03 0.00 0.02 0.04 0.06 0.08 0.10 0.12 (a) (b) (c) (d)
Figure 6.Comparison of (a)nitrate (NO−3),(b) sulfate (SO24−),
(c)ammonium (NH+4) and(d)soluble sodium (Na+) between sim-ulated source-oriented experiment (S_ARon_CRmod), internally mixed experiment (I_ARon_CRmod) and the observed concentra-tions of airborne particles on 18 January 2011. Units are µg m−3.
monium. Note that both observed and predicted nitrate con-centrations in the current episode are lower than the maxi-mum concentrations observed in historical extreme episodes within the San Joaquin Valley (SJV) because the current stag-nation event only lasted a few days, while extreme events last multiple weeks. If more discussion of aerosol predic-tions from the SOWC model is desired, we refer the reader to Zhang et al. (2014) who present a comparison of pre-dicted aerosol concentrations and measured concentrations using field campaign data measured during the California Regional PM10/PM2.5Air Quality Study (CRPAQS) in De-cember 2000–January 2001.
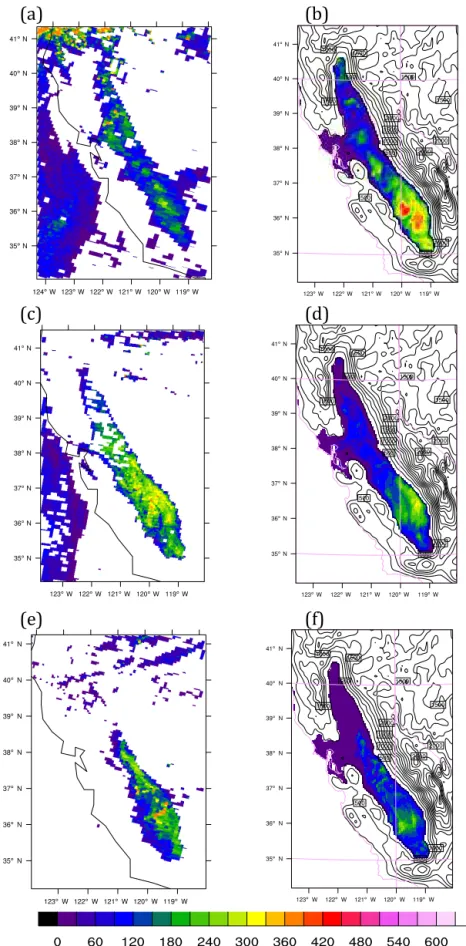
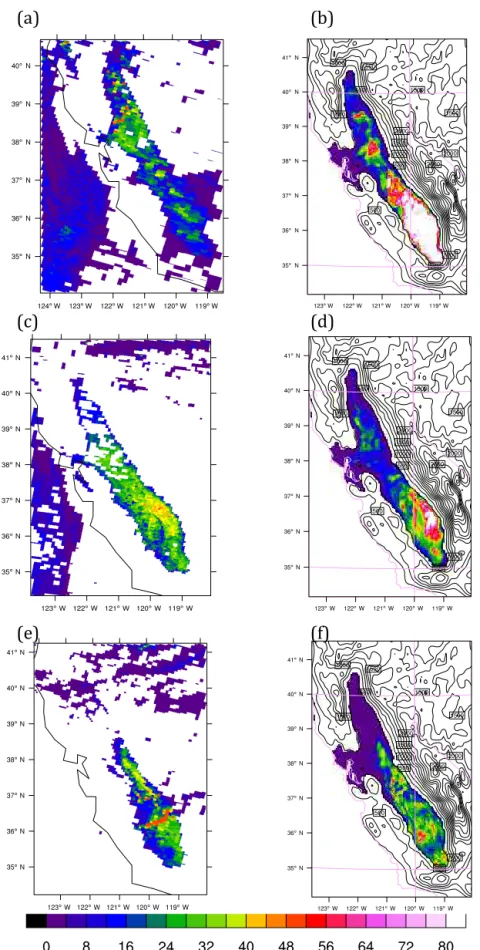
northern portion of the Central Valley during the fog event (16 to 18 January). However, the model underpredicts LWP in the middle portion of the Central Valley, which caused the fog to dissipate earlier (late 17 January). Once the surface temperature increases in one area due to thin fog, the dissipa-tion spreads out quickly until the fog completely evaporates. For the southern portion of the Central Valley, the fog event starts earlier (14 to 15 January) and the model reasonably predicts the onset of the event. However, the simulated fog is too dense (figure not shown). In addition, the peak of the simulated fog occurs 1 day earlier (16 January forecast vs. 17 January observed). This timing difference could be caused by the change in the microphysics processes at 00:00 UTC on 16 January. During the FDDA time period (before 16 January), the one-moment bulk microphysics scheme is used. After the FDDA time period, aerosols start being involved in cloud for-mation. High nitrate concentrates in the SJV and enhances aerosol activation due to its high hygroscopicity. This could partially explain why the peak of the LWP occurs on 16 Jan-uary. The details of aerosol chemical properties are discussed by Zhang et al. (2014).
While simulated LWP is comparable to MODIS retrievals with a 1-day shift (Fig. 7), to obtain a higher COT than ob-served (Fig. 8b vs. c) we expect that the model produces more small cloud droplets with a higher CCN concentration, es-pecially over highly polluted areas. High predicted COT re-sults in cold surface temperature, especially in the southern portion of the Central Valley. Overall, the spatial distribu-tion and magnitude of simulated COT also match the satel-lite data reasonably (Fig. 8), except for the overestimation of COT over the southeastern Central Valley (Fig. 8b and d).
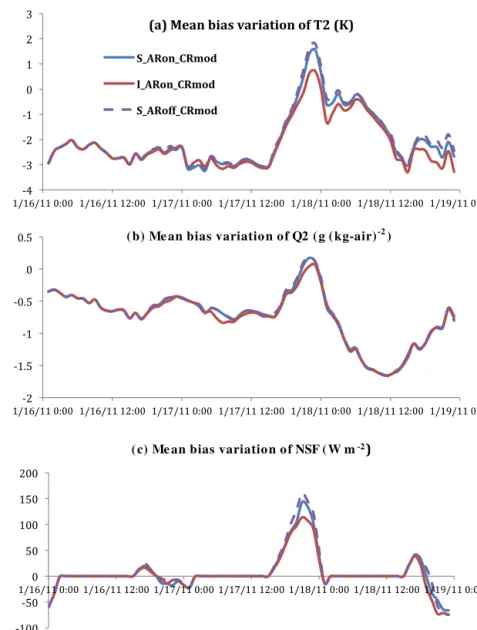
Mean biases of 2 m temperature (T2), 2 m water vapor mixing ratio (Q2) and surface net downward shortwave ra-diative flux (NSF) over the entire Central Valley from 16 to 18 January 2011 for S_ARon_CRmod are calculated (Fig. 9). Generally, T2 and Q2 of S_ARon_CRmod are underpre-dicted by 2◦C and 0.7 g kg−1, respectively. The predicted time variation of T2 and Q2 biases is small in the first one and a half days but increases after 16:00 UTC on 17 January because the predicted fog dissipated in the daytime, different from observations. Since the predicted fog dissipated, simu-lated NSF increased and was overpredicted by 13.9 W m−2. Low simulated T2 and Q2, particularly during the first one and a half days, in S_ARon_CRmod are partially due to over-predictions of the fog formation (i.e., too much condensation leading to depleted water vapor), especially over the south-ern portion of the Central Valley. Overall, S_ARon_CRmod reasonably forecasted LWP and COT spatial pattern and in-tensity. S_ARon_CRmod also captured the diurnal pattern of T2 and Q2 during the fog event, but underpredicted the ab-solute magnitude of T2 and Q2 by 1.76 (2.22)◦C and 0.56 (0.88) g kg−1in the daytime (nighttime), respectively.
5.2 Source-oriented aerosol direct and indirect effects
S_ARoff_CRmod is designed to test aerosol–radiation feed-back and so the comparison between S_ARoff_CRmod and S_ARon_CRmod can help quantify the aerosol direct ef-fect in the current study. Table 4 shows that the hourly bias mean and standard deviation from 24 surface stations in the daytime and nighttime of S_ARoff_CRmod are similar to, but larger than, results from S_ARon_CRmod for T2 and Q2 at the ground. However, compared to S_ARon_CRmod, the smaller cold bias from S_ARoff_CRmod is consistent with its larger net downward shortwave radiative flux (NSF) shown in Tables 4 and 5. Table 5 shows that the average NSF within the entire Central Valley from S_ARoff_CRmod is higher than S_ARon_CRmod by 3.7 W m−2, which means that the shortwave energy flux that reached the ground was reduced by∼3.7 W m−2due to aerosol radiative forcing in this case study. The maximum increases of T2 and NSF by the aerosol direct effect occurred on 17 January 2011 (Fig. 9). Table 5 also shows the mean value of cloud liquid water, cloud droplet number, surface skin temperature, latent heat flux and sensible heat flux over the Central Valley during 16 to 18 January 2011. Cloud liquid water and cloud droplet number were averaged within the first five model layers. The aerosol direct effect leads to increases in the cloud water mass and cloud droplet number by 3.3 and 4.5 %, respec-tively, due to reductions in skin temperature (0.1 K) and net shortwave flux (3.7 W m−2).
The modified radiation schemes for cloud optical proper-ties in the S_ARon_CRmod experiment do not have signif-icant feedback on spatially and temporally averaged cloud water mass (i.e., compared to S_ARon_CRorig) as shown in Table 5. However, the modified cloud–radiation interac-tion (i.e., geometric-optics method) used in the COT cal-culations (S_ARon_CRmod) predicts slightly higher COT, which leads to slightly lower net shortwave flux and surface skin temperature, especially in the polluted area. The higher COT predictions are likely caused by differences in the size range of cloud droplets and refractive indexes of cloud wa-ter with/without chemical composition in the calculation of cloud radiative properties. In the original radiation scheme, the cloud optical thickness (COT) is a function of cloud wa-ter path (CWP) and an effective radius (4 µm≤re ≤ 20 µm), which is derived from the water mass and the total droplet number assuming a uniform size of cloud droplets:
τorig(λ)=CWP×(−6.59×10⁻³+ 1.65
re
). (6)
8364 H.-H. Lee et al.: Implementation of warm-cloud processes in a source-oriented WRF/Chem model
(a)
(b)
(c)
(d)
(e)
(f)
Figure 7.Liquid water path (LWP) (g m−2) from MODIS Level 2 cloud products (a,cande) and from the SOWC model with aerosol
feedback on and modified cloud–radiation scheme (S_ARon_CRmod;b,dandf).(a)and(b)are at 19:00 UTC on 16 January 2011.(c)and
(a)
(b)
(c)
(d)
(e)
(f)
8366 H.-H. Lee et al.: Implementation of warm-cloud processes in a source-oriented WRF/Chem model
Table 4.Hourly bias mean and standard deviation (SD) in daytime and nighttime of 2 m temperature (T2,◦C), water vapor mixing ratio (Q2,
g kg-air−1) and net downward shortwave radiative flux (NSF, W m−2) between all experiments and observation from 16 to 18 January 2011. T2 and Q2 are calculated using 24 surface stations and NSF is calculated using 42 CIMIS stations shown in Fig. 4.
S_ARon_CRmod S_ARon_CRorig S_ARoff_CRmod I_ARon_CRmod Daytime Bias mean SD Bias mean SD Bias mean SD Bias mean SD T2 −1.76 1.27 −1.72 1.32 −1.63 1.33 −2.01 1.09 Q2 −0.56 0.34 −0.56 0.36 −0.54 0.35 −0.57 0.32 NSF 13.91 53.18 14.40 58.00 18.81 58.78 8.68 50.03 Nighttime Bias mean SD Bias mean SD Bias mean SD Bias mean SD T2 −2.22 0.92 −2.21 0.95 −2.19 0.93 −2.30 0.87 Q2 −0.88 0.41 −0.87 0.42 −0.88 0.42 −0.89 0.41
NSF / / / / / / / /
Table 5.Mean values of cloud liquid water (Qc), cloud droplet number (Qn), surface skin temperature (SKT), net shortwave flux (NSF),
latent heat flux (LH) and sensible heat flux (SH) for four experiments over the entire Central Valley during 16 to 18 January 2011. The bold font indicates the base case.
S_ARon_CRmod S_ARon_CRorig S_ARoff_CRmod I_ARon_CRmod
Q∗c(g m−3) 0.220 0.221 0.213 0.231
Q∗n(# m−3) 3.94×10⁸ 4.18×10⁸ 3.77×10⁸ 4.57×10⁸ SKT (K) 281.305 281.30 281.404 281.151
NSF∗∗(W m−2) 130.56 131.02 134.24 124.54
LH (W m−2) 9.01 9.02 9.36 8.40 SH (W m−2) 4.91 4.55 5.27 4.54 COT (unitless) 25.56 25.15 24.49 28.62
∗Averaged within the first five model layers. ∗∗Averaged only in the daytime.
COT is slightly higher in S_ARon_CRmod due to different formulas used in the calculation of cloud–radiation interac-tion. The small difference of COT between these two experi-ments in fact indicates that the parameterization of COT in the original radiation scheme provides a reasonable result compared to the explicit COT calculation.
Because the meteorological conditions of the fog event are calm and stable, the cloud microphysics processes are fairly slow and simple (no rain produced in this case). Although S_ARon_CRorig had slightly higher cloud droplet number concentrations, the modified calculation of the cloud optical properties in S_ARon_CRmod gave a similar cloud amount and net shortwave radiation flux reaching the surface, which produced nearly identical feedbacks to meteorology in both experiments (Table 5).
5.3 Internal mixture vs. source-oriented aerosols
The mixing state of chemical components among the at-mospheric aerosol particles can potentially play an impor-tant role in fog formation. The activation of aerosol particles into cloud droplets depends on the critical supersaturation which in turn depends on particle composition. According to the Köhler equation, increased concentrations of solutes
will decrease the critical supersaturation required to activate a particle into a CCN. As mentioned earlier, hydrophobic particles (i.e., black carbon) will more easily serve as CCN once they are coated with hygroscopic material (i.e., sulfate). Increased concentrations of solutes can potentially modify the frequency and severity of fog events in polluted air. In this section, we compare results from S_ARon_CRmod (source-oriented (i.e., aging-process-included) experiment) and I_ARon_CRmod (internally mixed experiment) to in-vestigate the activation change and further meteorologi-cal responses between internally mixed and source-oriented aerosols. The internally mixed experiment is conducted by lumping all sources together (i.e., AQC source dimension collapsed to one producing a 5-D AQC variable).
‐4 ‐3 ‐2 ‐1 0 1 2 3
1/16/11 0:00 1/16/11 12:00 1/17/11 0:00 1/17/11 12:00 1/18/11 0:00 1/18/11 12:00 1/19/11 0:00 (a) Mean bias variation of T2 (K)
S_ARon_CRmod
I_ARon_CRmod
S_ARoff_CRmod
‐2 ‐1.5 ‐1 ‐0.5 0 0.5
1/16/11 0:00 1/16/11 12:00 1/17/11 0:00 1/17/11 12:00 1/18/11 0:00 1/18/11 12:00 1/19/11 0:00 (b) Me an bias variation of Q2 (g (kg-air) )
‐100 ‐50 0 50 100 150 200
1/16/11 0:00 1/16/11 12:00 1/17/11 0:00 1/17/11 12:00 1/18/11 0:00 1/18/11 12:00 1/19/11 0:00
(c) Me an bias variation of NSF (W m-2)
-2
Figure 9.Mean bias variation of(a)2 m temperature (T2),(b)2 m water vapor mixing ratio (Q2) and(c)surface net downward
short-wave radiative flux (NSF) between observations and model simulation from 16 to 18 January 2011 for S_ ARon_CRmod (blue lines), S_ARoff_CRmod (purple lines) and I_ ARon_CRmod (red lines) experiments.
Table 6.Ratio of AQC number concentration for each bin/source to the total number concentration. The numbers are averaged within the
first five model layers during 16 to 18 January 2011.
Wood smoke Gasoline Diesel Meat cooking Others Source-oriented Internal Bin 1 28.92 % 1.00 % 4.25 % 0.84 % 10.39 % 45.40 % 48.89 % Bin 2 9.12 % 0.38 % 1.48 % 0.60 % 38.64 % 50.22 % 46.74 % Bin 3 0.19 % 0.01 % 0.03 % 0.02 % 3.03 % 3.28 % 3.26 % Bin 4 0.00 % 0.00 % 0.00 % 0.00 % 0.17 % 0.18 % 0.21 % Bin 5 0.00 % 0.00 % 0.00 % 0.00 % 0.02 % 0.02 % 0.02 % Bin 6 0.00 % 0.00 % 0.00 % 0.00 % 0.00 % 0.00 % 0.00 % Bin 7 0.00 % 0.00 % 0.00 % 0.00 % 0.00 % 0.00 % 0.00 % Bin 8 0.00 % 0.00 % 0.00 % 0.00 % 0.91 % 0.91 % 0.88 %
8368 H.-H. Lee et al.: Implementation of warm-cloud processes in a source-oriented WRF/Chem model
Figure 10.NCCN/ NCNratio for (a) S_ ARon_CRmod (source-oriented experiment) and (b) I_ARon_CRmod (internally mixed experiment)
averaged within the first five model layers. The ratio is hourly average during 16 to 18 January 2011. Contours are terrain heights in m.
0 500 1000 1500 2000 2500
S=0 .0 2 % S=0 .0 5 % S=0 .1 % S=0 .2 % S=0 .5 % Total AQC
9 79 261
1131 1626
2036
7 67 241
1028
1849 1958
C
C
N
c
o
n
c
e
n
tr
a
ti
o
n
(#
c
m
-3
)
Source‐oriented Internally mixed
0 % 2 0 % 4 0 % 6 0 % 8 0 % 1 0 0 %
S=0 .0 2 % S=0 .0 5 % S=0 .1 % S=0 .2 % S=0 .5 % 0 .4 3 % 3 .8 8 %
1 2 .8 3 %
5 5 .5 5 %
7 9 .8 6 %
0 .3 7 % 3 .4 2 %
1 2 .2 9 % 5 2 .4 9 %
9 4 .4 1 %
N
c
c
n
/
N
c
n
r
a
ti
o
Source‐oriented Internally mixed (a)
(b)
Figure 11. (a)72 h averaged CCN concentration at supersaturation
of 0.02, 0.05, 0.1, 0.2, 0.5 % and total AQC concentration with units in no. cm−3.(b)NCCN/ NCNratio at five corresponding
supersat-urations. Dark gray is the source-oriented experiment and light gray represents the internally mixed experiment. Results are average val-ues using data within the first five model layers.
is 12.63, 15.60, 14.89, 16.80 and 20.21 % for wood smoke, gasoline, diesel, meat cooking and others, respectively (aver-aged within the first five model layers). Wood smoke is typi-cally a major source of aerosol (∼38 %) in California’s Cen-tral Valley during winter stagnation events (see Table 6) and the organic carbon in wood smoke is water-soluble (Dusek et al., 2011) which allows these particles to activate more easily than insoluble particles. However, the majority of the wood smoke particles are located in the smallest size bin, so the ratio ofNCCN/ NCN for wood smoke is comparable with that of hydrophobic diesel. The source type of “others”, which has the highest ratio ofNCCN/ NCN, is dominated by larger dust particles coated with secondary components such as nitrate and is easier to activate, in contrast to the smaller combustion particles emitted from other tracked sources.
(a)
(b)
(c)
(d)
Terrain height contours Terrain height contours
Terrain height contours Terrain height contours
Figure 12.Relative change ((internally mixed – source-oriented)/source-oriented·100 %) in the daytime averaged predictions during 16 to
8370 H.-H. Lee et al.: Implementation of warm-cloud processes in a source-oriented WRF/Chem model
The ratio of NCCN/ NCN for both experiments can reach > 30 % but the highest NCCN/ NCN ratio occurs in rel-atively less polluted regions. The spatially averaged ra-tio of NCCN/ NCN is 16.65 % for S_ARon_CRmod and 27.49 % for I_ARon_CRmod within the Central Valley over the period of 16 to 18 January. The CCN concen-trations and NCCN/ NCN ratios between internally mixed and source-oriented experiments at different supersatura-tions were calculated to better understand this result. Fig-ure 11a shows the 72 h averaged CCN concentration at su-persaturations of 0.02, 0.05, 0.1, 0.2 and 0.5 % and to-tal AQC concentration averaged within the first five model layers. Figure 11b presents corresponding NCCN/ NCN ra-tios at five different supersaturations. When the supersatu-ration is less than or equal to 0.2 %, the NCCN/ NCN ra-tio predicted from S_ARon_CRmod is comparable or even slightly higher than that predicted from I_ARon_CRmod. In the S_ARon_CRmod tests, 56 % of the particles tracked in the AQC variable (mainly in size bins 2–8) are activated as CCN. When the supersaturation is close to 0.5 %, the
NCCN/ NCNratio from I_ARon_CRmod can be 15 % higher than that of S_ARon_CRmod. Most particles tracked in the AQC size bin 1 can activate in the internally mixed ex-periment; however, in the source-oriented experiment only particles emitted in AQC size bin 1 from wood smoke and other sources are sufficiently hygroscopic to activate. The remaining sources are dominated by hydrophobic com-pounds (such as elemental carbon) that do not activate un-der the study conditions (Table 6). Cubison et al. (2008) analyzed observational CCN and CN data in 2005 from a field campaign in California and found that the average ra-tio of NCCN/ NCN was 18 % for a supersaturation value of 0.5 %, but their predictedNCCN/ NCNratio based on the in-ternal mixture assumptions could reach to more than 50 %. In the source-oriented SOWC model, supersaturation values are typically∼ 0.2–0.3 % with maximum value of 0.5 % in some areas. The estimated ratio ofNCCN/ NCNin the source-oriented model is comparable with observations in Cubison et al. (2008), especially in polluted areas. The temporal vari-ations of mean bias of 2 m temperature (T2), 2 m water va-por mixing ratio (Q2) and surface net downward shortwave radiative flux (NSF) between internal vs. external aerosol mixture states (I_ARon_CRmod vs. S_ARon_CRmod) are similar until 20:00 UTC 17 January. After late 17 January, the bias differences between two experiments are more ap-parent in the daytime than in the nighttime (Fig. 9 and Ta-ble 4). Compared to I_ARon_CRmod, S_ARon_CRmod re-duced bias in T2 by 0.25 K in the daytime but had higher bias in NSF. S_ARon_CRmod did predict improved values of Q2. Based on Fig. 9, we know that the source-oriented and internal aerosol mixing states mainly cause differences in surface temperature in the daytime. Figures 12a and b illustrate the relative change ((internally mixed – source-oriented)/source-oriented ·100 %) of averaged (16–18 Jan-uary 2011) cloud liquid water and cloud droplet number,
Table 7. Hourly bias mean and root-mean-square difference of
cloud liquid water (Qc), cloud droplet number (Qn), surface
skin temperature (SKT), net shortwave flux (NSF), latent heat flux (LH) and sensible heat flux (SH) between internally mixed (I_ARon_CRmod) and source-oriented (S_ARon_CRmod) exper-iments (internally mixed – source-oriented) during 16 to 18 January 2011.
Bias mean Root-mean-square difference
Q∗c(g m−3) 1.19×10⁻² 4.16×10⁻²
Q∗n(# m−3) 6.24×10⁷ 2.64×10⁸ SKT (K) −0.15 0.57 NSF (W m−2) −6.02 13.30 LH (W m−2) −0.61 2.75 SH (W m−2) −0.36 5.24
∗Averaged within the first five model layers.
respectively, during the daytime. I_ARon_CRmod predicts cloud liquid water that is 40 % higher than values pre-dicted by S_ARon_CRmod over the northern Central Val-ley (Fig. 12a). The largest relative change in predicted cloud water concentration also occurs in the northern Central Val-ley near the mountains where fog is initiated by drainage flow. I_ARon_CRmod predicts higher cloud droplet num-ber (Fig. 12b), with the largest relative increases (50∼60 %) once again observed in areas near mountains and highly pol-luted regions, with more modest changes of 20∼30 % over remote regions. Internally mixed aerosols reduce the criti-cal saturation ratio for particles by artificially mixing hygro-scopic and hydrophobic components that in turn allows par-ticles to activate more easily.
The internally mixed experiment (I_ARon_CRmod) pre-dicts lower daytime averaged surface skin temperature and net downward shortwave flux at ground (Fig. 12c and d) cor-responding to the areas with higher cloud liquid water and cloud droplet concentrations (Fig. 12a and b). This result is expected since higher cloud liquid water and cloud droplet concentration will reduce the solar radiation flux on the sur-face. The reduction of surface skin temperature in the inter-nal mixed experiment is proportiointer-nal to the change of the net shortwave radiation. Figure 13 shows that the area av-erage of latent heat flux (LH) and sensible heat flux (SH) over the Central Valley in S_ARon_CRmod and the aver-age difference of internally mixed and source-oriented ex-periments. Higher cloud amount and lower surface tempera-ture are predicted in the internally mixed experiment, lead-ing to reduced LH and SH fluxes at ground level compared to the source-oriented experiment. The difference between internally mixed and source-oriented predictions for LH and SH reached 3 W m−2and 5 W m−2, respectively, at noon lo-cal time (22:00 UTC on 17 January).
‐6 ‐4 ‐2 0 2 4 6 8 10 12 ‐40 ‐20 0 20 40 60 80
1/17/11 6:00 1/17/11 12:00 1/17/11 18:00 1/18/11 0:00
1/18/11 6:00 1/18/11 12:00
Di ff er ence (W m ‐2) LH/ SH (W m ‐2) LH_S_ARon_CRmod SH_S_ARon_CRmod LH_I_S_difference SH_I_S_difference
Figure 13.Area average of latent heat flux (LH) and sensible heat
flux (SH) over the Central Valley in S_ARon_CRmod and the av-erage difference between I_ARon_CRmod and S_ARon_CRmod from 08:00 UTC on 17 January (0 Z local time) to 07:00 UTC on 18 January (23 Z local time).
source-oriented (S_ARon_CRmod) experiments for six vari-ables within the Central Valley during 16 to 18 January 2011. The mean bias between these two experiments is 1.19×10⁻² (g m−3) for cloud liquid water and 6.24×10⁷ (# m−3) for cloud droplet number. The direction of these trends is ex-pected since internally mixed aerosols are easier to acti-vate as CCN. The mean bias between internally mixed and source-oriented experiments is −0.15 (K) for surface skin temperature and−6.02 (W m−2) for net shortwave flux. The mean bias of LH and SH is−0.61 and−0.36 (W m−2), re-spectively. The root-mean-square difference between these two experiments is large for each variable, meaning that the difference varies strongly with location (see Fig. 12).
In summary, compared to S_ARon_CRmod, I_ARon_CRmod has a higher CCN/cloud droplet num-ber concentration because internally mixed aerosols can instantaneously contain hydroscopic material (e.g., sulfate) through artificial mixing, which decreases the critical supersaturation requirement for a particle to activate into a CCN, leading to higher cloud number concentration and optical thickness. Thicker fog in I_ARon_CRmod reduces the amount of shortwave radiation reaching the surface, resulting in a lower surface temperature. A lower surface temperature can have a positive feedback on cloud lifetime (i.e., a longer cloud lifetime), which further reduces shortwave radiation reaching the surface when compared to S_ARon_CRmod. Hence, the aerosols that include aging processes can delay CCN activation and produce fewer cloud droplets and less fog, which in turn will modify the energy budget near the surface.
6 Summary and discussion
A warm cloud–aerosol interaction module was implemented into the source-oriented Weather Research and Forecasting
model with Chemistry (SOWC) to study the aerosol–cloud– radiation interactions during fog simulations. The source-oriented mixture of aerosols is used to explicitly simulate particle aging processes in the atmosphere rather than instan-taneously combining particles into an internal mixture. The SOWC model was used to simulate a fog event in Califor-nia’s Central Valley in January 2011 with 7 days of FDDA nudging and 3 days of free run. Fog formation occurred when high moisture content from an Atmospheric River was ad-vected into the Central Valley and cold drainage flows oc-curred into the valley at night. The initial tests used five emis-sions sources (wood smoke, gasoline, diesel, meat cooking and others), with particles from each source consisting of 38 chemical species and eight size bins, spanning a diame-ter range from 0.01 to 10 microns. The highest model spatial resolution was 4 km.
Four numerical experiments were conducted to test model performance, meteorological feedbacks from internal and source-oriented aerosols and the impact of aerosol–cloud– radiation interaction on fog formation. Compared to obser-vations, the SOWC model reasonably predicted fog spatial distribution and duration and environmental meteorological feedbacks. However, the model overpredicted liquid water path and cloud optical thickness, which resulted in cold sur-face temperature bias. The inclusion of aerosol–radiation in-teraction reduced net downward shortwave radiative flux by an average of 3.7 W m−2and daytime surface temperature by 0.1 K. Results that used different treatments for aerosol mix-ing states were compared, and the important results are as follows. (1) The fraction ofNCCN/ NCNat a supersaturation of 0.5 % in the Central Valley decreased from 94 % in the internal mixture model to 80 % in the source-oriented mix-ture model. (2) Due to a smaller number of the CCN con-centration in the source-oriented mixture model than in the internal mixture model, cloud liquid water and cloud droplet number decreased 5 and 15 %, respectively. (3) Compared to observations, the source-oriented mixture model reduced the cold bias for surface temperature by 0.25 K in the daytime relative to the internal mixture model. The source-oriented mixture representation of particles also provided more rea-sonable predictions for cloud droplet number and cloud wa-ter mass vs. observations due to different activation proper-ties than the internal mixture representation of particles. The internal mixture model predicted greater activation of CCN than the source-oriented model due to artificial coating of hy-drophobic particles with hygroscopic components.
8372 H.-H. Lee et al.: Implementation of warm-cloud processes in a source-oriented WRF/Chem model
regions of the world are required to draw conclusions at those locations.
The Supplement related to this article is available online at doi:10.5194/acp-16-8353-2016-supplement.
Acknowledgements. The authors thank two anonymous reviewers for their insightful comments on the manuscript. The authors would also like to thank the WRF and WRF/Chem teams for their efforts on model development. This study was funded by the United States Environmental Protection Agency under grant no. R833372, NASA grant no. NNX09AC38G and NASA High-End Computing (HEC) Program through the NASA Advanced Supercomputing (NAS) Division at Ames Research Center (SMD-13-3895). Although the research described in the article has been funded by the United States Environmental Protection Agency it has not been subject to the Agency’s required peer and policy review and therefore does not necessarily reflect the reviews of the Agency and no official endorsement should be inferred.
Edited by: J. Ma
Reviewed by: three anonymous referees
References
Abdul-Razzak, H. and Ghan, S. J.: A parameterization of aerosol activation 3. Sectional representation, J. Geophys. Res.-Atmos., 107, AAC 1-1–AAC 1-6, doi:10.1029/2001jd000483, 2002. Ackerman, A. S., Toon, O. B., Stevens, D. E.,
Heyms-field, A. J., Ramanathan, V., and Welton, E. J.: Reduction of Tropical Cloudiness by Soot, Science, 288, 1042–1047, doi:10.1126/science.288.5468.1042, 2000.
Ackermann, I. J., Hass, H., Memmesheimer, M., Ebel, A., Binkowski, F. S., and Shankar, U.: Modal aerosol dynamics model for Europe: development and first applications, Atmos. Environ., 32, 2981–2999, doi:10.1016/S1352-2310(98)00006-5, 1998.
Adams, P. J., Seinfeld, J. H., Koch, D., Mickley, L., and Ja-cob, D.: General circulation model assessment of direct radia-tive forcing by the sulfate-nitrate-ammonium-water inorganic aerosol system, J. Geophys. Res.-Atmos., 106, 1097–1111, doi:10.1029/2000jd900512, 2001.
Albrecht, B. A.: AEROSOLS, CLOUD MICROPHYSICS, AND FRACTIONAL CLOUDINESS, Science, 245, 1227–1230, doi:10.1126/science.245.4923.1227, 1989.
Anttila, T.: Sensitivity of cloud droplet formation to the numerical treatment of the particle mixing state, J. Geophys. Res.-Atmos., 115, D21205, doi:10.1029/2010JD013995, 2010.
Bendix, J., Thies, B., Cermak, J., and Nauß, T.: Ground fog de-tection from space based on MODIS daytime data-a feasibility study, Weather Forecast., 20, 989–1005, 2005.
Binkowski, F. S. and Shankar, U.: The Regional Particulate Matter Model: 1. Model description and preliminary results, J. Geophys. Res.-Atmos., 100, 26191–26209, doi:10.1029/95jd02093, 1995.
Bohren, C. F. and Huffman, D. R.: Absorption and Scattering of Light by Small Particles, Wiley, New York, 57–81, 1983. Bott, A. and Carmichael, G. R.: Multiphase chemistry in a
micro-physical radiation fog model – A numerical study, Atmos. Envi-ron., 27, 503–522, doi:10.1016/0960-1686(93)90208-G, 1993. Chapman, E. G., Gustafson Jr, W. I., Easter, R. C., Barnard, J. C.,
Ghan, S. J., Pekour, M. S., and Fast, J. D.: Coupling aerosol-cloud-radiative processes in the WRF-Chem model: Investigat-ing the radiative impact of elevated point sources, Atmos. Chem. Phys., 9, 945–964, doi:10.5194/acp-9-945-2009, 2009.
Chen, J.-P. and Lamb, D.: Simulation of Cloud Microphysical and Chemical Processes Using a Multicomponent Framework. Part I: Description of the Microphysical Model, J. Atmos. Sci., 51, 2613–2630, 1994.
Chen, J.-P., Hazra, A., Shiu, C.-J., Tsai, I.-C., and Lee, H.-H.: In-teraction between Aerosols and Clouds: Current Understanding, in: Recent Progress in Atmospheric Sciences: Applicatons to the Asia-Pacific Region, edited by: Liou, K. N. and Chou, M.-D., World Scientific Publishing Co. Pte. Ltd., 231–281, 2008. Chen, S.-H. and Sun, W. Y.: A one-dimensional time-dependent
cloud model, J. Meteor. Soc. Jpn., 80, 99–118, 2002.
Chou, M.-D. and Suarez, M. J.: A Solar Radiation Parameterization for Atmospheric Studies NASA Tech. Rep. NASA/TM-1999-10460, 15, 1999a.
Chou, M. D. and Suarez, M. J.: A solar radiation parameterization for atmospheric studies., NASA Tech. Rep., 38, 1999b. Chou, M.-D. and Suarez, M. J.: A Thermal Infrared Radiation
Parameterization for Atmospheric Studies, NASA Tech. Rep. NASA/TM-2001-104606, 19, 2001a.
Chou, M. D. and Suarez, M. J.: A thermal infrared radiation pa-rameterization for atmospheric studies, NASA Tech. Rep., 55, 2001b.
Chow, J. C., Watson, J. G., Lowenthal, D. H., Solomon, P. A., Magliano, K. L., Ziman, S. D., and Richards, L. W.: PM10 and
PM2.5Compositions in California’s San Joaquin Valley, Aerosol Sci. Technol., 18, 105–128, doi:10.1080/02786829308959588, 1993.
Cubison, M. J., Ervens, B., Feingold, G., Docherty, K. S., Ulbrich, I. M., Shields, L., Prather, K., Hering, S., and Jimenez, J. L.: The influence of chemical composition and mixing state of Los Angeles urban aerosol on CCN number and cloud properties, At-mos. Chem. Phys., 8, 5649–5667, doi:10.5194/acp-8-5649-2008, 2008.
Dick, W. D., Saxena, P., and McMurry, P. H.: Estimation of water uptake by organic compounds in submicron aerosols measured during the Southeastern Aerosol and Visibility Study, J. Geo-phys. Res.-Atmos., 105, 1471–1479, 2000.
Dusek, U., Reischl, G. P., and Hitzenberger, R.: CCN Activation of Pure and Coated Carbon Black Particles, Environ. Sci. Technol., 40, 1223–1230, doi:10.1021/es0503478, 2006.
Dusek, U., Frank, G. P., Massling, A., Zeromskiene, K., Iinuma, Y., Schmid, O., Helas, G., Hennig, T., Wiedensohler, A., and An-dreae, M. O.: Water uptake by biomass burning aerosol at sub-and supersaturated conditions: closure studies sub-and implications for the role of organics, Atmos. Chem. Phys., 11, 9519–9532, doi:10.5194/acp-11-9519-2011, 2011.
ra-diative forcing in the vicinity of Houston using a fully coupled meteorology-chemistry-aerosol model, J. Geophys. Res.-Atmos., 111, D21305, doi:10.1029/2005jd006721, 2006.
Frank, G., Martinsson, B. G., Cederfelt, S.-I., Berg, O. H., Swi-etlicki, E., Wendisch, M., Yuskiewicz, B., Heintzenberg, J., Wiedensohler, A., Orsini, D., Stratmann, F., Laj, P., and Ricci, L.: Droplet Formation and Growth in Polluted Fogs, Contri. At-mos. Phys., 71, 65–85, 1998.
Georgii, H. W., and Kleinjung, E.: Relations between the chemical composition of atmospheric aerosol particles and the concentra-tion of natural ice nuclei, J. Rech. Atmos., 3, 145–156, 1967. Ghan, S. J., Leung, L. R., Easter, R. C., and Abdul-Razzak,
H.: Prediction of cloud droplet number in a general circu-lation model, J. Geophys. Res.-Atmos., 102, 21777–21794, doi:10.1029/97jd01810, 1997.
Grell, G. A., Peckham, S. E., Schmitz, R., McKeen, S. A., Frost, G., Skamarock, W. C., and Eder, B.: Fully coupled “online” chem-istry within the WRF model, Atmos. Environ., 39, 6957–6975, doi:10.1016/j.atmosenv.2005.04.027, 2005.
Griffin, D. W., Kellogg, C. A., and Shinn, E. A.: Dust in the wind: Long range transport of dust in the atmosphere and its impli-cations for global public and ecosystem health, Global Chang. Human Health, 2, 20–33, 2001.
Hayes, T. P., Kinney, J. J. R., and Wheeler, N. J. M.: California sur-face wind climatology, California Air Resources Board, Techni-cal Support Division, Modeling and Meteorology Branch, 180 pp., 1984.
Hong, S.-Y.: A new stable boundary-layer mixing scheme and its impact on the simulated East Asian summer monsoon, Quarterly Journal of the Royal Meteorological Society, 136, 1481–1496, doi:10.1002/qj.665, 2010.
Hong, S.-Y., Noh, Y., and Dudhia, J.: A New Vertical Diffusion Package with an Explicit Treatment of Entrainment Processes, Mon. Weather Rev., 134, 2318–2341, doi:10.1175/mwr3199.1, 2006.
IPCC: Climate change 2007-the physical science basis: Working group I contribution to the fourth assessment report of the IPCC, Cambridge University Press, 153–185, 2007.
Joe, D. K., Zhang, H., DeNero, S. P., Lee, H.-H., Chen, S.-H., McDonald, B. C., Harley, R. A., and Kleeman, M. J.: Im-plementation of a high-resolution Source-Oriented WRF/Chem model at the Port of Oakland, Atmos. Environ., 82, 351–363, doi:10.1016/j.atmosenv.2013.09.055, 2014.
Kain, J. S.: Convective parameterization for mesoscale models: The Kain-Fritsch scheme, The representation of cumulus convection in numerical models, Meteor. Monogr, 46, 165–170, 1993. Kain, J. S. and Fritsch, J. M.: A one-dimensional
entrain-ing/detraining plume model and its application in convective pa-rameterization, J. Atmos. Sci., 47, 2784–2802, 1990.
Kleeman, M. J., Cass, G. R., and Eldering, A.: Modeling the airborne particle complex as a source-oriented exter-nal mixture, J. Geophys. Res.-Atmos., 102, 21355–21372, doi:10.1029/97jd01261, 1997.
Koch, D. and Del Genio, A. D.: Black carbon semi-direct effects on cloud cover: review and synthesis, Atmos. Chem. Phys., 10, 7685–7696, doi:10.5194/acp-10-7685-2010, 2010.
Lance, S., Raatikainen, T., Onasch, T. B., Worsnop, D. R., Yu, X. Y., Alexander, M. L., Stolzenburg, M. R., McMurry, P. H., Smith, J. N., and Nenes, A.: Aerosol mixing state, hygroscopic growth and
cloud activation efficiency during MIRAGE 2006, Atmos. Chem. Phys., 13, 5049–5062, doi:10.5194/acp-13-5049-2013, 2013. Lesins, G., Chylek, P., and Lohmann, U.: A study of internal and
external mixing scenarios and its effect on aerosol optical prop-erties and direct radiative forcing, J. Geophys. Res.-Atmos., 107, 4094, doi:10.1029/2001jd000973, 2002.
Li, W. J. and Shao, L. Y.: Observation of nitrate coatings on at-mospheric mineral dust particles, Atmos. Chem. Phys., 9, 1863– 1871, doi:10.5194/acp-9-1863-2009, 2009.
Lin, Y.-L., Farley, R. D., and Orville, H. D.: Bulk Parameterization of the Snow Field in a Cloud Model, J. Clim. Appl. Meteorol., 22, 1065–1092, 1983.
Liu, Y., Daum, P. H., and McGraw, R. L.: Size trunca-tion effect, threshold behavior, and a new type of autocon-version parameterization, Geophys. Res. Lett., 32, L11811, doi:10.1029/2005gl022636, 2005.
Lohmann, U. and Feichter, J.: Global indirect aerosol effects: a re-view, Atmos. Chem. Phys., 5, 715–737, doi:10.5194/acp-5-715-2005, 2005.
Ma, J., Chen, Y., Wang, W., Yan, P., Liu, H., Yang, S., Hu, Z., and Lelieveld, J.: Strong air pollution causes widespread haze-clouds over China, J. Geophys. Res.-Atmos., 115, D18204, doi:10.1029/2009JD013065, 2010.
McMichael, A. J., Woodruff, R. E., and Hales, S.: Climate change and human health: present and future risks, The Lancet, 367, 859–869, 2006.
Ming, Y., and Russell, L. M.: Organic aerosol effects on fog droplet spectra, J. Geophys. Res.-Atmos., 109, D10206, doi:10.1029/2003jd004427, 2004.
Moore, K. F., Sherman, D. E., Reilly, J. E., and Collett, J. L.: Drop size-dependent chemical composition in clouds and fogs. Part I. Observations, Atmos. Environ., 38, 1389–1402, doi:10.1016/j.atmosenv.2003.12.013, 2004.
Motoi, K.: Electron-microscope study of snow crystal nuclei, J. Me-terol., 8, 151–156, 1951.
Niu, S. J., Liu, D. Y., Zhao, L. J., Lu, C. S., Lü, J. J., and Yang, J.: Summary of a 4-Year Fog Field Study in Northern Nanjing, Part 2: Fog Microphysics, Pure Appl. Geophys., 169, 1137–1155, doi:10.1007/s00024-011-0344-9, 2012.
Ramanathan, V., Crutzen, P. J., Kiehl, J. T., and Rosenfeld, D.: At-mosphere – Aerosols, climate, and the hydrological cycle, Sci-ence, 294, 2119–2124, doi:10.1126/science.1064034, 2001. Rogers, R. R. and Yau, M. K.: A Short Course in Cloud Physics,
Third ed., Butterworth Heinemann, 99–101, 1989.
Schell, B., Ackermann, I. J., Hass, H., Binkowski, F. S., and Ebel, A.: Modeling the formation of secondary organic aerosol within a comprehensive air quality model system, J. Geophys. Res.-Atmos., 106, 28275–28293, 2001.
Skamarock, W. C., Klemp, J. B., Dudhia, J., Gill, D. O., Barker, D. M., Duda, M. G., Huang, X.-Y., Wang, W., and Powers, J. G.: A Description of the Advanced Research WRF Version 3, NCAR Technical Note, NCAR/TN-475+STR, 2008.
Stelson, A. W.: Urban aerosol refractive index prediction by par-tial molar refraction approach, Environ. Sci. Technol., 24, 1676– 1679, doi:10.1021/es00081a008, 1990.
8374 H.-H. Lee et al.: Implementation of warm-cloud processes in a source-oriented WRF/Chem model
sulphuric acid condensation, Atmos. Chem. Phys., 10, 11471– 11487, doi:10.5194/acp-10-11471-2010, 2010.
Tegen, I., Lacis, A. A., and Fung, I.: The influence on climate forc-ing of mineral aerosols from disturbed soils, Nature, 380, 419– 422, doi:10.1038/380419a0, 1996.
Tewari, M., Chen, F., Kusaka, H., and Miao, S.: Coupled WRF/Unified Noah/urban-canopy modeling system, NCAR WRF Documentation, NCAR, Boulder, 1–22, 2007.
Twomey, S.: POLLUTION AND PLANETARY ALBEDO, Atmos. Environ., 8, 1251–1256, doi:10.1016/0004-6981(74)90004-3, 1974.
Yang, F.: Radiative forcing and climate impact of the Mount Pinatubo volcanic eruption, PhD, University of Illinois at Urbana-Champaign, 2000.
Yang, M., Howell, S. G., Zhuang, J., and Huebert, B. J.: Attri-bution of aerosol light absorption to black carbon, brown car-bon, and dust in China – interpretations of atmospheric measure-ments during EAST-AIRE, Atmos. Chem. Phys., 9, 2035–2050, doi:10.5194/acp-9-2035-2009, 2009.
Ying, Q. and Kleeman, M. J.: Effects of aerosol UV extinction on the formation of ozone and secondary particulate matter, Atmos. Environ., 37, 5047–5068, 2003.
Ying, Q., Lu, J., Allen, P., Livingstone, P., Kaduwela, A., and Kleeman, M.: Modeling air quality during the Califor-nia Regional PM10/PM2.5 Air Quality Study (CRPAQS) us-ing the UCD/CIT source-oriented air quality model – Part I. Base case model results, Atmos. Environ., 42, 8954–8966, doi:10.1016/j.atmosenv.2008.05.064, 2008.
Zaveri, R. A., Easter, R. C., Fast, J. D., and Peters, L. K.: Model for Simulating Aerosol Interactions and Chem-istry (MOSAIC), J. Geophys. Res.-Atmos., 113, D13204, doi:10.1029/2007jd008782, 2008.
Zaveri, R. A., Barnard, J. C., Easter, R. C., Riemer, N., and West, M.: Particle-resolved simulation of aerosol size, composition, mixing state, and the associated optical and cloud condensation nuclei activation properties in an evolving urban plume, J. Geo-phys. Res.-Atmos., 115, D17210, doi:10.1029/2009jd013616, 2010.
Zhang, H., DeNero, S. P., Joe, D. K., Lee, H. H., Chen, S. H., Micha-lakes, J., and Kleeman, M. J.: Development of a source oriented version of the WRF/Chem model and its application to the Cal-ifornia regional PM10/PM2.5air quality study, Atmos. Chem.