Atmos. Chem. Phys., 17, 277–296, 2017 www.atmos-chem-phys.net/17/277/2017/ doi:10.5194/acp-17-277-2017
© Author(s) 2017. CC Attribution 3.0 License.
Evaluating the representation of aerosol optical properties using an
online coupled model over the Iberian Peninsula
Laura Palacios-Peña1, Rocío Baró1, Juan Luis Guerrero-Rascado2,3, Lucas Alados-Arboledas2,3, Dominik Brunner4, and Pedro Jiménez-Guerrero1
1Department of Physics, Regional Campus of International Excellence “Campus Mare Nostrum”, Campus de Espinardo, University of Murcia, Murcia, 30100, Spain
2Andalusian Institute for Earth System Research (IISTA-CEAMA), Av. del Mediterráneo, Granada, 18006, Spain 3Department Applied Physics, University of Granada, Fuentenueva s/n, Granada, 18006, Spain
4Laboratory for Air Pollution/Environmental Technology (EMPA), Swiss Federal Laboratories for Materials Science and Technology, Dübendorf, 8600 Switzerland
Correspondence to:Pedro Jiménez-Guerrero ([email protected])
Received: 3 June 2016 – Published in Atmos. Chem. Phys. Discuss.: 6 July 2016
Revised: 22 November 2016 – Accepted: 12 December 2016 – Published: 5 January 2017
Abstract. The effects of atmospheric aerosol particles on the Earth’s climate mainly depend on their optical, micro-physical and chemical properties, which modify the Earth’s radiative budget. The aerosol radiative effects can be di-vided into direct and semi-direct effects, produced by the aerosol–radiation interactions (ARIs), and indirect effects, produced by aerosol–cloud interactions (ACIs). In this sense the objective of this work is to assess whether the inclusion of aerosol radiative feedbacks in the online coupled WRF-Chem model improves the modelling outputs over the Iberian Peninsula (IP) and surrounding water areas. For this pur-pose, the methodology is based on the evaluation of mod-elled aerosol optical properties under different simulation scenarios. The evaluated data come from two WRF-Chem simulations for the IP differing in the inclusion/no-inclusion of ARIs and ACIs (RF/NRF simulations). The case stud-ies cover two episodes with different aerosol types over the IP in 2010, namely a Saharan dust outbreak and a forest fire episode. The evaluation uses observational data from AERONET (Aerosol Robotic Network) stations and MODIS (Moderate Resolution Imaging Spectroradiometer) sensor, including aerosol optical depth (AOD) and Ångström ex-ponent (AE). Experimental data of aerosol vertical distribu-tion from the EARLINET (European Aerosol Research Lidar Network) Granada station are used for checking the models. The results indicate that for the spatial distribution the best-represented variable is AOD and the largest improvements
when including the aerosol radiative feedbacks are found for the vertical distribution. In the case of the dust outbreak, a slight improvement (worsening) is produced over the areas with medium (high/low) levels of AOD(−9 %/+12 % of im-provement) when including the aerosol radiative feedbacks. For the wildfire episode, improvements of AOD represen-tation (up to 11 %) over areas further away from emission sources are estimated, which compensates for the computa-tional effort of including aerosol feedbacks in the simula-tions. No clear improvement is observed for the AE repre-sentation, the variability of which is largely underpredicted by both simulations.
1 Introduction
Twomey, 1974, 1991; Albrecht, 1989). In the first case, light scattering by aerosol particles such as sea salt increases the solar radiation reflected by the planet, producing a cooling influence. Light-absorbing aerosols such as black carbon, which are a component of biomass burning, exert a warm-ing influence (e.g. Jacobson, 2001). These radiative influ-ences are quantified as forcings (in W m−2), defined as the
perturbation to the energy balance of the Earth–atmosphere system. A warming influence is denoted a positive forcing, and a cooling influence, a negative forcing (IPCC, 2013). Generally, modelling tools and observations indicate that an-thropogenic aerosols have had a cooling influence on Earth since preindustrial times, with a total ARI+ACI medium-confidence radiative forcing (excluding the effect of absorb-ing aerosol on snow and ice) of−0.9 (−1.9 to−0.1) W m−2 (Boucher et al., 2013). The uncertainty quantification of these aerosol effects on the Earth’s radiative budget is much higher than for any other climate-forcing agent (IPCC, 2013). This happens because the physical, chemical and optical aerosol properties are highly variable on scales of space and time due to the short-lived aerosol particles and non-uniform emissions (Forster et al., 2007).
In order to reduce this uncertainty, the use of models is one of the most powerful ways of understanding the dif-ferent processes affecting the climate system. As aerosols may strongly drive the Earth’s climate on global and re-gional scales, fully coupled meteorology–climate and chem-istry models allow for accounting for the climate–chemchem-istry– aerosol–cloud–radiation feedback mechanisms between sim-ulated aerosol concentrations and meteorological variables. It is also a promising way to go for future atmospheric simu-lation systems, leading to a new generation of models for im-proved meteorological, environmental and chemical weather forecasting (Baklanov et al., 2014).
Europe may be one of the most climatically sensitive world regions (Giorgi, 2006). Within the target domain, the role of aerosol particles may then be even more crucial over such regions as the Mediterranean basin, a crossroad that fu-els the mixing of particles from different sources (Papadi-mas et al., 2012). The Iberian Peninsula (IP), a good exam-ple within the Mediterranean basin, can be affected by high aerosols concentration of different aerosol types. Due to its closeness to the Sahara, the IP is frequently affected by dust outbreaks with large aerosol loads that modulate the aerosol climatology in different areas of this region, especially in southern Spain (e.g. Toledano et al., 2007; Guerrero-Rascado et al., 2008, 2009; Córdoba-Jabonero et al., 2011; Antón et al., 2012; Pereira et al., 2014) and Portugal (e.g. Wagner et al., 2009; Preißler et al., 2011). On the other hand, the Mediterranean climate, with high summer temperatures and dry soil–air conditions, encourages forest fire episodes over this region (Alados-Arboledas et al., 2010). Both types of emissions have major contributions to particle concentration in the atmosphere, particularly in the warmer season (Elias et al., 2006).
There are a large number of studies assessing the aerosol feedback effects over the IP using different remote-sensing measurement methods and devices such as sun photometers (Lyamani et al., 2005, 2006; Toledano et al., 2007; Cachorro et al., 2008; Obregón el at., 2012), nephelometers (Pereira et al., 2008, 2011), lidars (Guerrero-Rascado et al., 2008) or a combination of these (Elias et al., 2006; Córdoba-Jabonero et al., 2011). Other studies using these instruments share the satellite measurements when this assessment is carried out (Cachorro et al., 2006; Guerrero-Rascado et al., 2009). Fur-thermore, there are studies that use these different measuments to estimate the aerosol radiative forcing over some re-gions (Santos et al., 2008; Guerrero-Rascado et al., 2009; Valenzuela et al., 2012) or over the whole of the IP using a radiative transfer model (Mateos et al., 2014). On the other hand, a number of studies (e.g. Myhre et al., 2007, 2009) have tried to assess the aerosol feedback effects on a global scale, while other works (e.g. Péré et al., 2010; de Meij et al., 2012; Curci et al., 2014, among others) take a more regional approach. However, no modelling studies of the aerosol ra-diative effects have ever been carried out for the IP.
According to Randall et al. (2007), the responses of the climate system to aerosols and their effects on the radiative budget of the Earth are the most uncertain climate feedbacks. Therefore, the objectives of this work are (i) to assess whether the inclusion of aerosol radiative feedbacks in the online coupled WRF-Chem model improves the modelling outputs of aerosol optical properties (aerosol optical depth, AOD, and Ångström exponent, AE) over the IP and sur-rounding water areas (seas and ocean) and (ii) to evaluate the representation of aerosol optical properties by this model over the target domain.
2 Methodology
In this paper we evaluate the AOD and AE outputs of differ-ent simulations carried out by the WRF-Chem model (Grell et al., 2005) by using observational data provided by several instruments: two ground-based data networks (AERONET and EARLINET) and a sensor on board a satellite (MODIS). The results of the evaluation of the simulations presented here, concerning particulate matter concentrations, can be found in Im et al. (2015). Therefore, in this contribution we will focus on the evaluation of aerosol properties. Two differ-ent set-ups of the model have been considered, with or with-out aerosol radiative feedbacks in the simulation. According to Boucher et al. (2013), the inclusion of these feedbacks in-volves a change in the internal energy flows to the Earth’s system, affecting cloud cover or other components of the cli-mate system such as aerosol particles, thereby altering the global energy budget indirectly.
individ-L. Palacios-Peña et al.: Evaluating the representation of aerosol optical properties 279
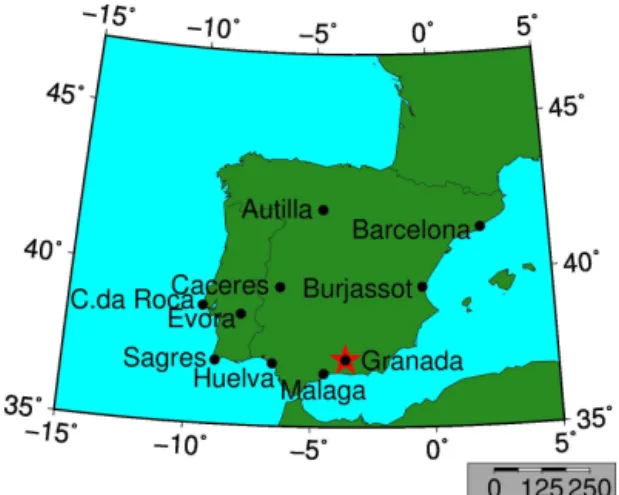
Figure 1.Map of the distribution of the AERONET (points) and the EARLINET (star) stations.
ual model prediction error or bias (ei), the mean bias error
(MBE), mean absolute error (MAE) and the correlation co-efficient (r) have been calculated. All data need to be
pre-processed and bilinearly interpolated to a common working grid. This has a resolution of 0.2◦ and covers between 35 and 47◦north and−15 and 5◦east. The grid size consists of 6000 cells and the grid type is a regular lon–lat grid. After the interpolation, modelled data are evaluated against MODIS. The data to be compared with AERONET and EARLINET are extracted from the model cell covering the corresponding station coordinates (Fig. 1) following a nearest-neighbour ap-proach.
First, in order to evaluate whether the inclusion of aerosol radiative feedbacks in the online coupled WRF-Chem model produces significant changes on the studied variables (or changes are just mere signal noise), a surrogate variable, as-sociated to the significance level of the changes modelled (S.L.), is defined (Eq. 1). Therefore, high values of S.L. in-dicate whether the changes between simulations with (and without) aerosol radiative feedbacks are noticeable with re-spect to the variability of the signal or not and, therefore, their significance is as follows:
S.L.= 1 n
Pn i=1
xiNRF−xiRF
SNRF2 ×100, (1)
where S.L. is the significance level, xi is the value of the
studied variable andSNRF2 is the associated variance for the
case not taking into account any aerosol radiative feedbacks (no radiative feedbacks, NRFs). Moreover, NRFs represent the base case and RF is the aerosol radiative feedbacks sim-ulation that includes the ARI+ACI.
Second, to evaluate whether the inclusion of the aerosol radiative feedbacks in the simulations leads to an improve-ment of the error of the model, the variable improveimprove-ment of
the MAE is used (Eq. 2): Improvement of MAE=1
n Xn
i=1|ei|NRF−
1 n
Xn
i=1|ei|RF, (2)
where|ei|is the absolute error of the simulations.
Finally, to estimate whether the inclusion of the aerosol radiative feedbacks in the simulations produces an improve-ment in the vertical distribution of aerosols, the normalized improvement of the MAE has been calculated (Eq. 3): Nor. Improv. of MAE(%)
=1
n
Pn
i=1|ei|NRF−Pni=1|ei|RF Pn
i=1|ei|NRF
×100, (3)
2.1 Modelling data: WRF-Chem
The evaluated data come from regional air-quality–climate simulations performed using the WRF-Chem online coupled meteorology and chemistry model (Grell et al., 2005), ver-sion 3.4.1, under the umbrella of the EuMetChem COST Ac-tion ES1004. A detailed descripAc-tion of the simulaAc-tions can be found in Forkel et al. (2015).
A brief description of the modelling methodology taken from the aforementioned work is described below. The following physics options were applied for both simula-tions, with (or without) aerosol radiative feedbacks: the Rapid Radiative Transfer Model for Global Climate Mod-els (RRTMG) longwave and shortwave radiation scheme; the Yonsei University (YSU) PBL scheme, the Noah land-surface model, the Lin microphysics scheme and the up-dated version of the Grell–Devenyi scheme with radiative feedbacks. Further description of the physics can be found in Grell et al. (2005). According to the chemistry options, the following were applied: the Modal Aerosol Dynam-ics model for Europe with the Secondary Organic Aerosol Model (MADE/SORGAM) aerosol scheme, the Regional Acid Deposition Model version 2 (RADM2) gas phase mech-anism and the Fast-J photolysis scheme.
For all simulations discussed in this paper the native mod-elling grid spacing is 23 km (270 by 225 grid cells, Lam-bert conformal conic projection with the centre at 50◦N and 12◦E). The modelling domain covers Europe and a portion of northern Africa as well as large areas affected by the Rus-sian forest fires. However, because the scope of the paper is the IP, only data for a domain covering the IP and the surrounding seas and ocean have been used (Fig. 2). In the vertical direction, the atmosphere up 50 hPa is resolved into 33 layers with a higher resolution close to the surface.
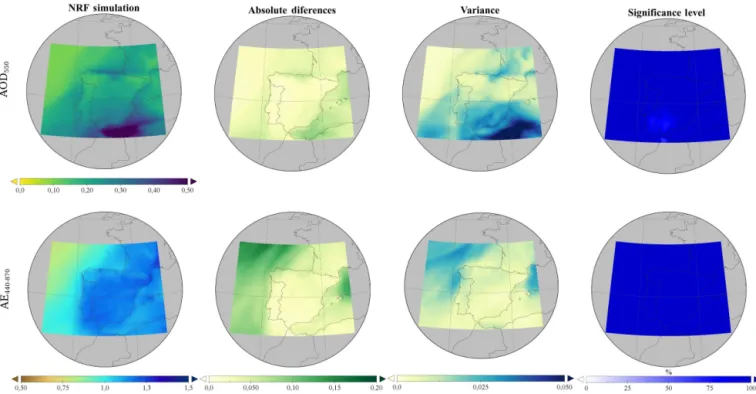
Figure 2.Dust episode (temporal mean from 28 June to 12 July). Top: AOD550, bottom: AE440/870. From left to right: modelled value of the variable (NRF simulation), value of the absolute differences between NRF-RF simulations (absolute differences), variance value of NRF simulation (variance) and significance level (S.L.) values.
from the MACC-II project (Monitoring Atmospheric Com-position and Climate Interim Implementation, Inness et al., 2013) 1.125◦ spatial resolution. Anthropogenic emis-sions for the EU domain provided by the TNO (Nether-lands Organization for Applied Scientific Research) from a recent update of the TNO MACC emissions inven-tory (http://www.gmes-atmosphere.eu/; Pouliot et al., 2012, 2014; Kuenen et al., 2014) were applied.
Biomass burning emission data have been calculated from global fire emission data, which have been supplied by the In-tegrated Monitoring and Modelling System for wildland fires (IS4FIRES) project (Sofiev et al., 2009) with 0.1◦×0.1◦ spa-tial resolution. Day and night vertical injection profiles were also provided. WRF-Chem emission species have been cal-culated by speciation following Andreae and Merlet (2001) and Wiedinmyer et al. (2011). However, no heat release due to the fires was taken into account.
Biogenic emissions are based on the Model of Emissions of Gases and Aerosols from Nature (MEGAN) model (Guen-ther et al., 2006). MEGAN is online, coupled with WRF-Chem and makes use of simulated temperature and solar ra-diation. Moreover, WRF-Chem predicts online dust emission as a function of the land usage information and the simu-lated meteorological fields. In this work and following Shaw et al. (2008), dust emission flux (G)depends on an
empir-ical proportionality constant estimated from region-specific data (C), the vegetation mask accounting for vegetation type
(α), the friction velocity (u∗), the threshold friction velocity
below which dust emission does not occur (u∗t=20 cm s−1)
following Shaw et al., 2008) and the soil wetness factor ac-counting for soil moisture (fw).
G=αCu4∗
1−fwu∗t
u∗
(4) The most important feature to bear in mind for this work is the aerosol module. This aerosol module is based on the modal aerosol MADE (Ackermann et al., 1998), which is a modification of the Regional Particulate Model (Binkowski and Shankar, 1995). Here aerosol particles are represented by three log-normal size distributions, corresponding to an Aitken mode (nucleation mode 0.1 µm diameter), an accumu-lation mode (0.1–2 µm) and a coarse mode (> 2 µm) (Forkel et al., 2012). Secondary organic aerosols (SOAs) have been incorporated into MADE in the SORGAM (Secondary Or-ganic Aerosol Model) module (Schell et al., 2001).
L. Palacios-Peña et al.: Evaluating the representation of aerosol optical properties 281
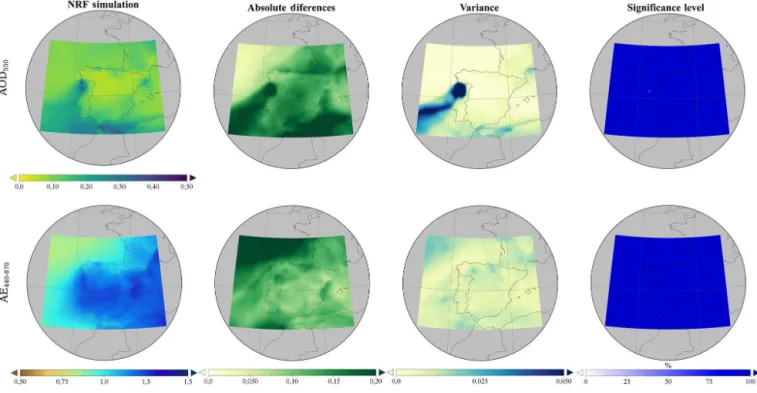
Figure 3.As Fig. 2 but for the fire episode (temporal mean from 25 July to 7 August).
The microphysical module, consisting of the Lin scheme based on Lin et al. (1983) and Rutledge and Hobbs (1984), is a single-moment scheme including some modifications, as saturation adjustment following Tao et al. (1989) and ice sed-imentation, which is related to the sedimentation of small ice crystals (Mitchell et al., 2008). It includes six classes of hy-drometeors: water vapour, cloud water, rain, cloud ice, snow and graupel (Baró et al., 2015). The WRF-Chem model al-lows us to transform the single moment scheme of the Lin microphysics scheme into a double moment scheme. This implementation is described in Chapman et al. (2009). Fol-lowing Ghan et al. (1997), a prognostic treatment of cloud droplet number was added, which treats water vapour and cloud water, rain, cloud ice, snow and graupel. The autocon-version of cloud droplets to rain droplets depends on droplet number and follows Liu et al. (2005). Droplet-number nu-cleation and (complete) evaporation rates correspond to the aerosol activation and resuspension rates. Ice nuclei based on predicted particulates are not treated. However, ice clouds are included via the prescribed ice nuclei distribution following the Lin scheme (Baró et al., 2015).
Finally, the effect of aerosols on incoming solar radiation within WRF-Chem is determined by transferring relevant pa-rameters to the shortwave radiation scheme, representing ra-diative feedbacks due to aerosol–radiation interactions. The interactions of clouds and incoming solar radiation have been implemented by linking simulated cloud droplet number with the shortwave radiation scheme and with Lin microphysics (Skamarock et al., 2005). Therefore, droplet number will af-fect both the calculated droplet mean radius and cloud
opti-cal depth when using shortwave radiation scheme, represent-ing radiative feedbacks due to aerosol–clouds interactions. A limitation of WRF-Chem in the treatment of aerosol–cloud interactions is that these couplings are not computed in con-vective clouds simulated by the cumulus parameterization (Chapman et al., 2009; Yang et al., 2011; Archer-Nicholls et al., 2016).
Although the modelling domain covers all Europe, for the purpose of this work, data from the IP and surrounding areas with a resolution of 0.2◦have been extracted for two impor-tant aerosol episodes in 2010. One of these episodes consists of a Saharan dust outbreak (from 28 June to 12 July) and a forest fire episode (from 25 July to 7 August). These episodes are selected because they represent two situations with a high load of atmospherics aerosol particles, which cause the ra-diative budget to be strongly affected. No volcanic emissions were considered in spite of the Eyjafjallajökull eruption in spring 2010. However, the volcanic plume only reached the whole of the IP in May 2010 (Sicard et al., 2012; Navas-Guzmán et al., 2013), so it is outside the scope of this case study.
because of the model assimilation of meteorological obser-vations by the ECMWF.
2.2 Observational data
2.2.1 Moderate Resolution Image Spectrometer (MODIS)
The satellite data chosen to evaluate the WRF-Chem sim-ulations come from MODIS (Levy et al., 2005) Level-2 Atmospheric Aerosol Product (MXD04_L2), collection or version 6 (C6) (Levy et al., 2013). The MODIS Aerosol Products monitor the ambient aerosol optical thickness over the oceans globally and over a portion of the continents. Daily Level 2 data have a spatial resolution of a 10×10 km. Two MODIS Aerosol data product files have been selected: MOD04_L2, containing data collected from the Terra plat-form, and MYD04_L2, containing data collected from the Aqua platform. In this case, the MXD04_L2 provides full global coverage of aerosol properties from the dark target (DT) aerosol retrieval algorithm, which is applied over ocean and dark land (e.g. vegetation) (Levy et al., 2013).
The variables used from MODIS are aerosol optical depth (AOD) and Ångström exponent (AE).
The AOD is measured at a wavelength of 550 nm (AOD550)for both ocean (best) and land (corrected) with the
highest-quality data (quality assurance confidence=3). The valid range of data is−0.05 to 5.0; that means a permission of small negative AOD values in order to avoid an arbitrary negative bias at the low AOD550end in long-term statistics. This is because MODIS does not have sensitivity over land to retrieve aerosol to better than ±0.05+15 % under very clean conditions. Negative values of AOD550have been con-sidered to be zero in this study. Over ocean the estimated error is−0.02 and+0.04±10 % (Levy et al., 2013).
AE for wavelengths between 550 and 860 nm (AE550/860)
over the ocean has a valid range of−1.0 to 5.0. In collec-tion 6, the preliminary estimated error for AE550/860is 0.45; pixels with an AOD550> 0.2 are expected to have a more ac-curate AE550/860representation (Levy et al., 2013).
2.2.2 Aerosol Robotic Network (AERONET)
The Aerosol Robotic Network (AERONET) collaboration (Holben et al., 1998) provides globally distributed observa-tions of spectral AOD, inversion products and precipitable water in diverse aerosol regimes. The highest-quality data can be found in Version 2, Level 2.0 (cloud screened and quality assured) data products.
The data used from AERONET in this work come from level 2.0 of AOD at different wavelengths (AOD440, AOD675, AOD870 and AOD1020)and AE (AE440/870) from stations
covering the IP for the episodes studied (Fig. 1). Typically the total uncertainty for AOD data under cloud-free conditions is
L. Palacios-Peña et al.: Evaluating the representation of aerosol optical properties 283
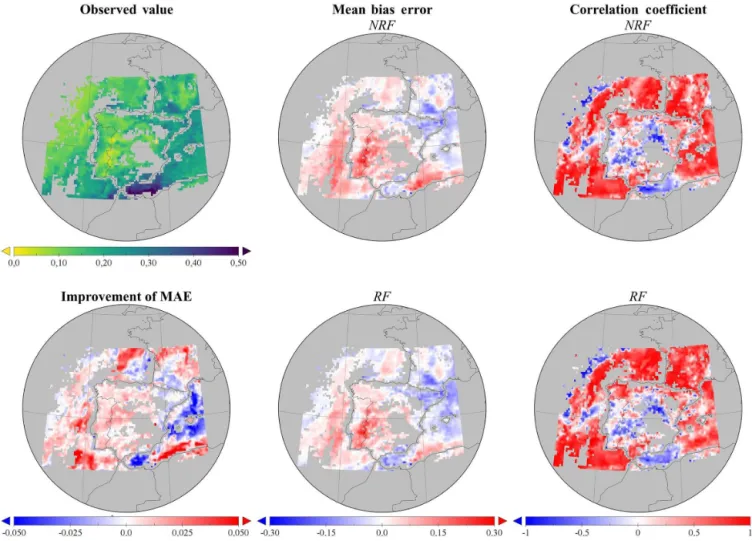
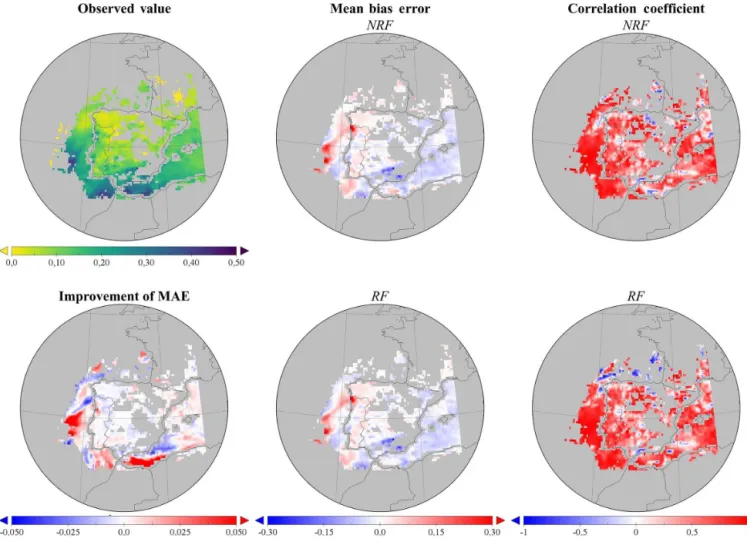
Figure 4.Comparison of AOD550model output vs. AOD550from MODIS data for the dust episode (temporal mean from 28 June to 12 July). AOD MODIS values (top left), improvement of the MAE due to the inclusion of RF (MAE in RF-NRF simulations, bottom left), MBE for NRF (top centre) and RF simulations (bottom centre). Correlation coefficient for NRF (top right) and RF (bottom right) simulations.
<±0.01 forλ> 440 nm and <±0.02 for shorter wavelengths (Holben et al., 1998).
2.2.3 European Aerosol Research Lidar Network (EARLINET)
EARLINET (Pappalardo et al., 2014) is the first aerosol lidar network, established in 2000, with the main goal of provid-ing a comprehensive, quantitative and statistically significant database for the aerosol distribution on a continental scale. EARLINET data include particle backscatter and extinction coefficient profiles at 355, 532 and 1064 nm. EARLINET data used include backscatter profiles (BSCAT) at 355 and 532 nm (for the dates and times selected, no information is available at 1064 nm). The only station with available data for the case studies in the IP during the year 2010 is Granada and, therefore, it is the only station included in this study.
3 Results and discussion
3.1 Significance level of simulated changes
First, to assess the effect of the inclusion of aerosol ra-diative feedbacks in the online coupled WRF-Chem model on the studied variables, the significance study described in Sect. 2 has been carried out. During the dust episode (Fig. 2), the inclusion of aerosol radiative feedbacks produces differ-ences with a significance level (defined as the ratio for the NRF-RF differences and the associated variance for the case not taking into account any aerosol radiative feedbacks) for AOD550 higher than 60 % over the south-western IP. The rest of the domain presents S.L. ratios > 100 % in spite of the high AOD550 variance values (above 0.05). In the case of AE440/870, the entire domain shows significance levels
higher than 100 %.
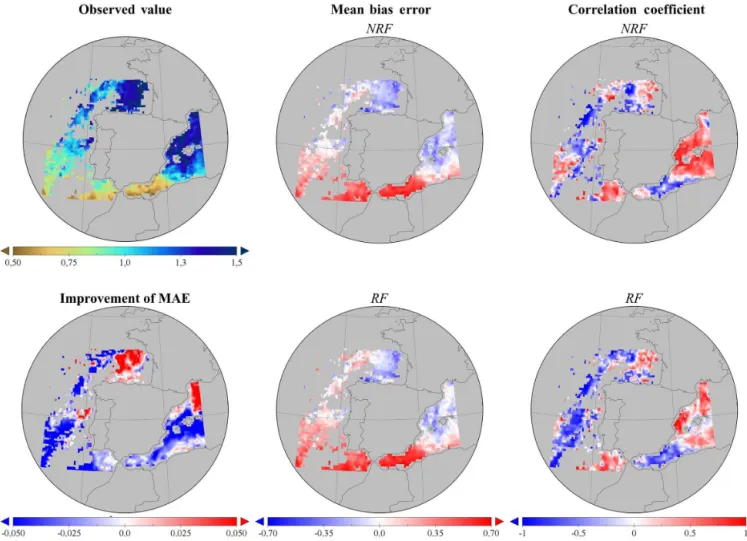
Figure 5.As Fig. 4 but for the fire episode (temporal mean from 25 July to 7 August).
the area of fire particle emissions, S.L. ranges between 50 and 100 % due to the higher absolute changes (> 0.2) than variance values (> 0.05). Similarly, for the dust episode the AE440/870 over the entire domain shows significance levels > 100 %.
Hence, over most of the domain, the changes or differ-ences due to the inclusion of aerosol radiative feedbacks have a high S.L., usually higher than 100 %, and therefore the changes modelled are significant with respect to the variabil-ity of the studied variables. We can then state that the changes discussed below are caused by the inclusion of the aerosol ra-diative feedbacks in our simulations and not merely by signal noise.
3.2 Model output vs. Terra-MODIS data
The results of the comparison between model outputs with MODIS data from the Terra platform are shown in Figs. 4– 7. The results from the Aqua platform are similar to Terra, and are therefore not shown here (but included in the Sup-plement). Figure 4a shows the mean values of AOD550from MODIS for the dust outbreak. In this episode, high levels
(above 0.4) over the south and the east of the domain are found, due to the shape of the dust outbreak. On the other hand, for the fire episode (Fig. 5a), the highest levels of MODIS AOD550 (> 0.25) are shown over the north of Por-tugal due to the presence of black carbon from wildfires, and over the south of the domain, where a dust intrusion occurred at the end of this episode (> 0.3).
For AOD550 over the entire domain, the model outputs present low values of the MBE (represented by Figs. 4 and 5c and d) for both NRF and RF simulations. During the dust episode the model underestimates MODIS AOD550 (MBE minimum values for NRF and RF simulations, respectively, −0.31 and −0.36) over the locations with significant dust loads (high AOD550) and overestimates (MBE maximum
L. Palacios-Peña et al.: Evaluating the representation of aerosol optical properties 285
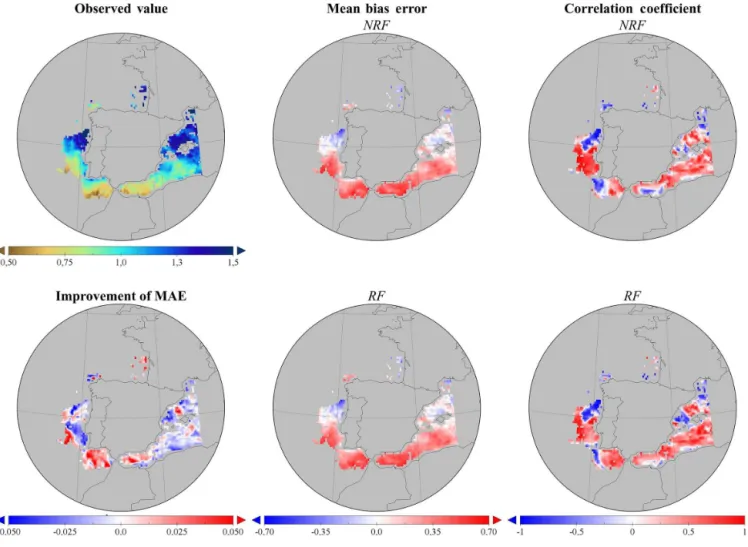
Figure 6.Comparison of AE550/860model output vs. AE at the same wavelength from MODIS data for the dust episode (temporal mean from 28 June to 12 July). AE MODIS values (top left), improvement of the MAE due to the inclusion of RF (MAE in RF-NRF simulations, bottom left), MBE for NRF (top centre) and RF simulations (bottom centre). Correlation coefficient for NRF (top right) and RF (bottom right) simulations.
of this type of particle, which has been reported by Chu et al. (2002); Levy et al. (2005) and Remer et al. (2005), among others. On the other hand, a too high predicted AOD value by the model can generally be explained by the presence of ei-ther too much aerosol dry mass, too great a fraction of small particles for a given mass or an excess of water associated with the aerosols (Chapman et al., 2009).
With respect to the correlation coefficients (Fig. 4e and f for the dust episode and Fig. 5e and f for the fire episode), both simulations show high levels (around 0.9) of this sta-tistical figure during the dust episode, except for those areas with high levels of AOD550, where the correlations are lower (even with negative correlations values close to−0.5). Con-versely, for the fire episode, correlation values are close to 1 both for both cases (NRF and RF) over the entire domain, especially over the areas with high values of AOD550.
When considering the improvement (or not) of the AOD550 when including aerosol radiative feedbacks in the
simulations, the difference in the MAEs of the simulations between NRF and RF is estimated in Eq. (2). For the dust episode (Fig. 4b), a slight improvement (worsening) is pro-duced over the areas with medium (high/low) levels of AOD550, taking these changes in values between−0.09 and +0.12. For the fire episode (Fig. 5b), a worsening of the MAE (difference NRF-RF of−0.02) is simulated close to the source of biomass burning aerosols. However, an improve-ment (up to+0.11) over areas further away from this source is estimated, which compensates for the importance of in-cluding aerosol feedbacks in the simulations when assessing the improvement or worsening of simulations.
T able 2. Maximum AER ONET A OD at 1020, 870, 675 and 440 nm; maximum and minimum error or bias values for both episodes at dif ferent representati ve stations. V alues in italics represents a better bias for the RF than for the NRF simulations. Dust episode Barcelona station Sagres station 1020 nm 870 nm 675 nm 440 nm 1020 nm 870 nm 675 nm 440 nm Max AER ONET A OD value 0.43 0.45 0.47 0.55 0.39 0.42 NRF RF NRF RF NRF RF NRF RF NRF RF NRF RF NRF RF NRF RF Minimum bias value − 0.22 − 0.27 − 0.20 − 0.25 − 0.20 − 0.22 − 0.34 − 0.31 − 0.19 − 0.22 − 0.17 − 0.20 Maximum bias value 0.11 0.09 0.12 0.11 0.16 0.14 0.24 0.19 0.23 0.17 0.27 0.21 Fire episode Caceres station Ev ora station 1020 nm 870 nm 675 nm 440 nm 1020 nm 870 nm 675 nm 440 nm Max AER ONET A OD value 0.23 0.30 0.38 0.67 0.35 0.37 0.41 0.61 NRF RF NRF RF NRF RF NRF RF NRF RF NRF RF NRF RF NRF RF Minimum bias value − 0.13 − 0.12 − 0.17 − 0.16 − 0.21 − 0.19 − 0.40 − 0.38 − 0.24 − 0.26 − 0.25 − 0.26 − 0.24 − 0.27 − 0.33 − 0.34 Maximum bias value 0.09 0.13 0.09 0.14 0.13 0.20 0.18 0.26 0.12 0.12 0.14 0.14 0.19 0.19 0.31 0.29
other hand, for the fire episode (Fig. 7a), the highest levels (around 1.6) are found over the north of Portugal, coinci-dent with the fires areas, thus representing the emissions of biomass burning particles. Generally, for both simulations in both episodes, the model underestimates the high values of AE550/860and overestimates the low values.
For the dust episode, the MBE (Fig. 6c and d) minimum values are found to be−0.65 and −0.62 for NRF and RF simulations (underestimation) and the maximum MBE takes values of 0.77 and 0.78 (overestimation). Concerning the cor-relation coefficient (Fig. 6e and f) for both simulations, the value of this statistic is lower than for AOD550. Over most of the domain, negative values are found around−0.7 and positive values found are low (< 0.3).
On the other hand, during the fire episode (Fig. 7.) MBE minimum values (underestimation) are found around−0.61 and −0.65 for NRF and RF simulation, respectively, and maximum MBE values around 0.68 and 0.66 for NRF and RF simulations. With respect to the correlation coefficient, just for the dust episode, positive correlations (> 0.5) are located over the most of the domain, while negative correlations are estimated over the emission areas of biomass burning parti-cles (with values around−0.8).
At the same time, there is a slight improvement for RF simulations for the dust episode over the areas where the AE550/860is overestimated (reaching values of improvement
of the MAE of 0.13) and a slight worsening (values of im-provement of the MAE around−0.09) over the areas where this variable is underestimated (Fig. 5b). For the fire episode, a slight improvement (values of improvement of the MAE of 0.16) is found over the south-eastern part of the domain and a slight worsening (around−0.18) is found over the rest of the IP (Fig. 6b).
3.3 Model output vs. AERONET data
L. Palacios-Peña et al.: Evaluating the representation of aerosol optical properties 287
Figure 7.As Fig. 6 for the fire episode (temporal mean from 25 July to 7 August).
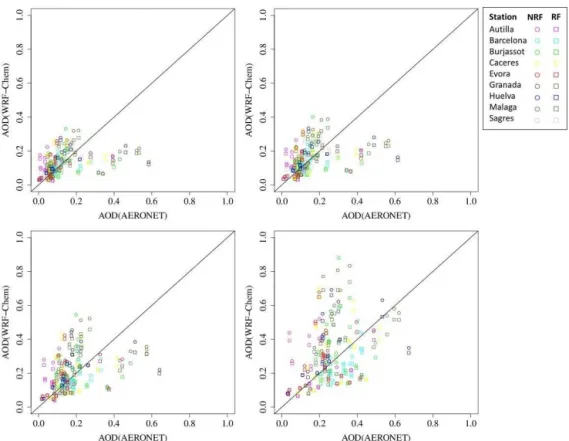
values than the comparison with MODIS data, which is done cell (MODIS) versus cell (model output) with approximately the same resolution. Results do not indicate a clear improve-ment or worsening of both variables in both episodes when including the aerosol radiative feedbacks in our modelling configuration.
High levels of AERONET AOD are found between 2 and 10 of July 2010 due to the dust outbreak in Barcelona and Sagres (Fig. 11a and c). The time series of these stations have been selected as representative of all AERONET stations in the IP affected by the Saharan dust outbreak (see Supple-ment for information on the rest of AERONET stations over the IP). Maximum values of AERONET AOD occur between 7 and 10 July 2010. For AOD1020, AOD870and AOD675, the model underestimates the highest levels of AOD, represented by the minimum bias values (Table 2). On the other hand, between 2 and 6 of July 2010 (medium levels of AOD) the model overestimates the values of this parameter (Table 2). When an underestimation (overestimation) is produced, the bias is lower (higher) for lower wavelengths. The Sagres sta-tion lacks AOD675and AOD440data. Finally, the behaviour of AOD440 in Barcelona is different from the other
wave-lengths due to the location of the station, close to a main street of the city where fine particles are emitted because of the road traffic.
For the fire episode, the stations shown are Caceres and Evora (see Supplement for the rest of the stations). In both stations, AOD presents the highest levels from 28 to 30 of July due to the wildfires that occurred in Portugal (Table 2). Except for the first 2 days, the model tends to underestimate the AOD values. For all wavelengths, the bias or error in both stations increases when the wavelength decreases.
Regarding the AE440/870, for the dust episode the
Figure 8.Linear regression between AERONET (x) and simulation daily data (y; NRF in circles and RF in squares) for the dust episode (from 28 June to 12 July): AOD1020(top left), AOD870(top right), AOD675(bottom left) and AOD440(bottom right).
L. Palacios-Peña et al.: Evaluating the representation of aerosol optical properties 289
Figure 10.Linear regression between AERONET (x) and simulation daily data (y, NRF in circles and RF in squares) of AE440/870: dust episode (from 28 June to 12 July, left) and fire episode (from 25 July to 7 August, right).
3.4 Model output vs. EARLINET data
Finally, the results of the comparison between the model out-put and EARLINET data are shown. In this section, only the dust episode is studied because the only station with avail-able data for both study episodes in the IP during the year 2010 is Granada. At this site, dust has an important contribu-tion to aerosol loads. Two specific days (6 and 12 July 2010) are shown for the sake of brevity, but this discussion is valid for other days of this episode. It is important to notice the dif-ferences between both discrete profile resolutions: the model profile, with 33 levels from the ground to approx. 20 km, and the profile measurement, which has a much higher vertical resolution (7.5 m). So the results below should be considered mainly from a qualitative perspective. However, in order to provide a more quantitative approach, the MAE of the model versus lidar observations is estimated.
As for the particle backscatter (BSCAT) at 532 nm for 6 July 2010 (Fig. 12a), the lidar detects a peak between 1.5 and 2×10⁻⁶m−1sr−1 around 3250 m above sea level caused by a dust layer. Although the model outputs overes-timate the BSCAT values, simulations capture the profile of BSCAT. Although NRF and RF model configurations per-form similarly, there is a slight improvement of the MAE of the vertical profile (estimated after Eq. 3) when the aerosol radiative feedbacks are taken into account (Fig. 12a). Av-erage MAEs are 6.37×10⁻⁷and 6.22×10⁻⁷m−1sr−1for NRF and RF simulations, respectively. Hence, the normal-ized MAE is improved by 2.4 % when aerosol radiative feed-backs are included in WRF-Chem simulations.
For the BSCAT for 12 July 2010 (Fig. 12b), the model overestimates the BSCAT values of the vertical profile, as mentioned above. However, the shape of the vertical profile is correctly reproduced. Mean MAEs are 3.14×10⁻⁷ and 3.12×10⁻⁷m−1sr−1 at 355 nm for NRF and RF simula-tions, respectively, and 4.1×10⁻⁷ m−1sr−1 at 532 nm for both cases. Here, the improvement when including aerosol
radiative feedbacks is very limited and is estimated as 0.63 and 0.14 % at 355 and 532 nm.
4 Conclusions
The use of online coupled models is one of the most power-ful ways of understanding the different processes influencing the climate system. In particular, for the study of atmospheric aerosol particles, realistic simulations of the combined ARIs and ACIs are needed, irrespective of the aerosols source, in which the interactions of aerosols, meteorology, radiation, and chemistry are coupled in a fully interactive manner. The use of modelling tools requires the observational study of physical, chemical and optical properties of aerosol particles to establish its behaviour and to assess how well these prop-erties are represented in online coupled models.
In this study, two configurations with and without (RF/NRF simulations) the aerosol radiative feedbacks have been assessed against a number of remote-sensing observa-tions for two episodes characterized by dust and biomass burning aerosols, respectively.
Figure 11.AERONET (dots), NRF (line) and RF simulations (dashed line). AOD at different AERONET wavelengths: Barcelona (top left) and Sagres (top right) stations for the dust episode (from 28 June to 12 July) and Caceres (centre left) and Evora (centre right) stations for the fire episode (from 25 July to 7 August). AE440/870in the Sagres station for the dust episode (from 28 June to 12 July, bottom left) and for the Caceres station for the fire episode (from 25 July to 7 August, bottom right).
particles. The inclusion of aerosol feedbacks does not pro-duce a clear benefit when taking into account the expensive computational cost required for including the ARIs and ACIs in the model. As well as for MODIS, for the comparison be-tween model output and AERONET data, the results indi-cate that the best-represented variable is AOD. Generally, for both episodes, the model underestimates the levels of AOD, but the highest levels of this variable for dust episode are
L. Palacios-Peña et al.: Evaluating the representation of aerosol optical properties 291
Figure 12.EARLINET (line), NRF (dashed line) and RF simulations (dotted line) of the backscatter coefficient at 532 and 355 nm. For 6 July 2010 at 02:00 UTC (left) and for 12 July 2010 at 13:00 UTC (right).
For the comparison between model output and EAR-LINET data, the results show a general slight improvement in the representation of vertical aerosol profiles when the aerosol radiative feedbacks are taken into account for all studied wavelengths.
It is important to take into account these considerations to improve the time efficiency when running the simulations, because the inclusion of aerosol radiative feedbacks in the simulations causes a notable increase in computational time. The improvements observed, in particular those related to the vertical distribution of aerosols, justify the inclusion of aerosol radiative feedbacks in the WRF-Chem online cou-pled model and the much higher time devoted to running the simulations.
5 Data availability
Appendix A: List of acronyms
ACIs Aerosol–cloud interactions
AE Ångström exponent
AERONET Aerosol Robotic Network AOD Aerosol optical depth
ARIs Aerosol–radiation interactions
BSCAT Backscatter
DB Deep blue
DT Dark target
EARLINET European Aerosol Research Lidar Network
ECMWF European Centre for Medium-Range Weather Forecasts
EuMetChem European framework for online integrated air quality and meteorology modelling IFS-MOZART Integrated Forecast System – model for ozone and related tracers
IP Iberian Peninsula
IPCC Intergovernmental Panel on Climate Change
IS4FIRES Integrated Monitoring and Modelling System for wildland fires
MACC-II Monitoring Atmospheric Composition and Climate Interim Implementation
MAE Mean absolute error
MBE Mean bias error
MEGAN Model of Emissions of Gases and Aerosols from Nature MODIS Moderate Resolution Imaging Spectroradiometer NRF No radiative feedbacks
r Correlation coefficient
RF Radiative feedbacks
RRTMG Rapid Radiative Transfer Model for global climate models S.L. Significance level
TNO Netherlands Organization for Applied Scientific Research YSU PBL Yonsei University planetary boundary layer scheme
L. Palacios-Peña et al.: Evaluating the representation of aerosol optical properties 293 The Supplement related to this article is available online
at doi:10.5194/acp-17-277-2017-supplement.
Acknowledgements. The authors acknowledge the project
REPAIR-CGL2014-59677-R of Ministerio de Economía y Com-petitividad, the FPU scholarship (ref. FPU14/05505) and FEDER European programme for the support to carry out this research. The work has been possible thanks to the fellowship 19677/EE/14 funded by “Fundación Séneca-Agencia de Ciencia y Tecnología de la Región de Murcia”, Programme “Jiménez de la Espada de Movilidad, Cooperación e Internacionalización”, in the framework of II PCTIRM 2011-2014. Authors thank the support from Eu-MetChem COST Action ES1004 and the Air Quality Modelling Evaluation International Initiative (AQMEII).
This work also was supported by the University of Granada through the contract “Plan Propio. Programa 9. Convocatoria 2013”, by the Andalusia Regional Government through project P12-RNM-2409, by the Spanish Ministry of Economy and Competitiveness through project CGL2013-45410-R and by the European Union’s Horizon 2020 research and innovation pro-gramme through project ACTRIS-2 (grant agreement no. 654109). The authors thankfully acknowledge the FEDER programme for the instrumentation used in this work.
Edited by: S. Freitas
Reviewed by: two anonymous referees
References
Ackermann, I. J., Hass, H., Memmesheimer, M., Ebel, A., Binkowski, F. S., and Shankar, U.: Modal aerosol dynamics model for Europe: Development and first applications, Atmos. Environ., 32, 2981–2999, doi:10.1016/S1352-2310(98)00006-5, 1998.
Alados-Arboledas, L., Müller, D., Guerrero-Rascado, J. L., Navas-Guzmán, F., Pérez-Ramírez, D., and Olmo, F. J.: Optical and mi-crophysical properties of fresh biomass burning aerosol retrieved by Raman lidar, and star- and Sun-photometry, Geophys. Res. Lett., 38, L01807, doi:10.1029/2010GL045999, 2010.
Albrecht, B.: Aerosols, cloud microphysics, and fractional cloudi-ness, Science, 245, 1227–1230, 1989.
Andreae, M. and Merlet, P.: Emission of trace gases and aerosols from biomass burning, Global Biogeochem. Cy., 15, 955–966, 2001.
Antón, M., Valenzuela, A., Cazorla, A., Gil, J. E., Fernández-Gálvez, J., Lyamani, H., Foyo-Moreno, I., Olmo, F. J., and Alados-Arboledas, L: Global and diffuse shortwave irradiance during a strong desert dust episode at Granada (Spain), Atmos. Res., 118, 232–239, 2012.
Archer-Nicholls, S., Lowe, D., Schultz, D. M., and McFiggans, G.: Aerosol-radiation-cloud interactions in a regional coupled model: the effects of convective parameterisation and resolution, Atmos. Chem. Phys., 16, 5573–5594, doi:10.5194/acp-16-5573-2016, 2016.
Baklanov, A., Schlünzen, K., Suppan, P., Baldasano, J., Brunner, D., Aksoyoglu, S., Carmichael, G., Douros, J., Flemming, J., Forkel, R., Galmarini, S., Gauss, M., Grell, G., Hirtl, M., Joffre, S., Jorba, O., Kaas, E., Kaasik, M., Kallos, G., Kong, X., Ko-rsholm, U., Kurganskiy, A., Kushta, J., Lohmann, U., Mahura, A., Manders-Groot, A., Maurizi, A., Moussiopoulos, N., Rao, S. T., Savage, N., Seigneur, C., Sokhi, R. S., Solazzo, E., Solomos, S., Sørensen, B., Tsegas, G., Vignati, E., Vogel, B., and Zhang, Y.: Online coupled regional meteorology chemistry models in Europe: current status and prospects, Atmos. Chem. Phys., 14, 317–398, doi:10.5194/acp-14-317-2014, 2014.
Barnard, J. C., Fast, J. D., Paredes-Miranda, G., Arnott, W. P., and Laskin, A.: Technical Note: Evaluation of the WRF-Chem “Aerosol Chemical to Aerosol Optical Properties” Module using data from the MILAGRO campaign, Atmos. Chem. Phys., 10, 7325–7340, doi:10.5194/acp-10-7325-2010, 2010.
Baró, R., Jiménez-Guerrero, P., Balzarini, A., Curci, G., Forkel, R., Grell, G., Hirtl, M., Honzak, L., Langer, M., Pérez, J. L., Pirovano, G., San José, R., Tuccella, P., Werhahn, J., and Žabkar, R.: Sensitivity analysis of the microphysics scheme in WRF-Chem contributions to AQMEII phase 2, Atmos. Environ., 115, 620–629, 2015.
Binkowski, F. S. and Shankar, U.: The regional particulate matter model: 1.Model description and preliminary results, J. Geophys. Res, 100, 26191–26209, 1995.
Boucher, O., Randall, D., Artaxo, P., Bretherton, C., Feingold, G., Forster, P., Kerminen, V.-M., Kondo, Y., Liao, H., Lohmann, U., Rasch, P., Satheesh, S.K., Sherwood, S., Stevens, B., and Zhang, X. Y.: Clouds and aerosols, in: Climate Change 2013: The Phys-ical Science Basis, Contribution of Working Group I to the Fifth Assessment Report of the Intergovernmental Panel on Climate Change, edited by: Stocker, T. F., Qin, D., Plattner, G.-K., Tig-nor, M., Allen, S. K., Doschung, J., Nauels, A., Xia, Y., Bex, V., and Midgley, P. M., Cambridge University Press, Cambridge, UK and New York, NY, USA, 2013.
Cachorro, V. E., Vergaz, R., de Frutos, A. M., Vilaplana, J. M., Hen-riques, D., Laulainen, N., and Toledano, C.: Study of desert dust events over the southwestern Iberian Peninsula in year 2000: two case studies, Ann. Geophys., 24, 1493–1510, doi:10.5194/angeo-24-1493-2006, 2006.
Cachorro, V. E., Toledano, C., Prats, N., Sorribas, M., Mogo, S., Berjon, A., Torres, B., Rodrigo, R., de la Rosa, J., and De Frutos, A. M.: The strongest desert dust intrusion mixed with smoke over the Iberian Peninsula registered with Sun photometry, J. Geo-phys. Res., 113, D14S04, doi:10.1029/2007JD009582, 2008. Chapman, E. G., Gustafson Jr., W. I., Easter, R. C., Barnard, J. C.,
Ghan, S. J., Pekour, M. S., and Fast, J. D.: Coupling aerosol-cloud-radiative processes in the WRF-Chem model: Investigat-ing the radiative impact of elevated point sources, Atmos. Chem. Phys., 9, 945–964, doi:10.5194/acp-9-945-2009, 2009.
Charlson, R. J., Schwartz, S. E., Hales, J. M., Cess, R. D., Coakley Jr., J. A., Hansen, J. E., and Hofmann, D. J.: Climate forcing by anthropogenic aerosols, Science, 255, 423–430, 1992.
Chu, D. A., Kaufman, Y. J., Ichoku, C., Remer, L. A., Tanré, D., and Holben, B.: Validation of MODIS aerosol optical depth retrieval over land, Geophys. Res. Lett., 29, 8007, doi:10.1029/2001GL013205, 2002.
M., Alados-Arboledas, L., Cuevas, E., and de la Morena, B.: Synergetic monitoring of Saharan dust plumes and potential im-pact on surface: a case study of dust transport from Canary Is-lands to Iberian Peninsula, Atmos. Chem. Phys., 11, 3067–3091, doi:10.5194/acp-11-3067-2011, 2011.
Curci, G., Hogrefe, C., Bianconi, R., Im, U., Balzarini, A., Baró, R., Brunner, D., Forkel, R., Giordano, L., Hirtl, M., Honzak, L., Jiménez-Guerrero, P., Knote, C., Langer, M., Makar, P. A., Pirovano, G., Pérez, J. L., San José, R., Syrakov, D., Tuccella, P., Werhahn, J., Wolke, R., Žabkar, R., Zhang, J., and Gal-marini, S.: Uncertainties of simulated aerosol optical properties induced by assumptions on aerosol physical and chemical prop-erties: An AQMEII-2 perspective, Atmos. Environ., 115, 541– 552, doi:10.1016/j.atmosenv.2014.09.009, 2014.
Elias, T., Silva, A. M., Belo, N., Pereira, S., Formenti, P., Helas, G., and Wagner, F.: Aerosol extinction in a remote continental region of the Iberian Peninsula during summer, J. Geophys. Res., 111, D14204, doi:10.1029/2005JD006610, 2006.
Fast, J. D., Gustafson Jr., W. I., Easter, R. C., Zaveri, R. A., Barnard, J. C., Chapman, E. G., Grell, G. A., and Peckham, S. E.: Evolution of Ozone, Particulates and Aerosol Direct Radia-tive Forcing in the Vicinity of Houston Using a Fully Coupled Meteorology-Chemistry-Aerosol Model, J. Geophys. Res., 111, D21305, doi:10.1029/2005JD006721, 2006.
Forkel, R., Werhahn, J., Hansen, A. B., McKeen, S., Peckham, S., Grell, G., and Suppan, P.: Effect of aerosol-radiation feedback on regional air quality – a case study with WRF/Chem, Atmos. Environ., 53, 202–211, 2012.
Forkel, R., Balzarini, A., Baró, R., Bianconi, R., Curci, G., Jiménez-Guerrero, P., Hirtl, M., Honzak, L., Lorenz, C., Im, U., Pérez, J.L., Pirovano, G., San José, R., Tuccella, P., Werhahn, J., and Zabkar, R.: Analysis of the WRF-Chem contributions to AQMEII phase2 with respect to aerosol radiative feedbacks on meteorology and pollutant distributions, Atmos. Environ., 115, 630–645, doi:10.1016/j.atmosenv.2014.10.056, 2015.
Forster, P., Ramaswamy, V., Artaxo, P., Berntsen, T., Betts, R., Fa-hey, D. W., Haywood, J., Lean, J., Lowe, D. C., Myhre, G., Nganga, J., Prinn, R., Raga, G., Schulz, M., and Van Dorland, R.: Changes in Atmospheric Constituents and in Radiative Forc-ing, in: Climate Change 2007: The Physical Science Basis. Con-tribution of Working Group I to the Fourth Assessment Report of the Intergovernmental Panel on Climate Change, edited by: Solomon, S., Qin, D., Manning, M., Chen, Z., Marquis, M., Av-eryt, K. B., Tignor, M., and Miller, H. L., Cambridge University Press, Cambridge, UK and New York, NY, USA, 2007. Ghan, S. J., Leung, L. R., Easter, R. C., and Abdul-Razzak, H.:
Pre-diction of Droplet Number in a General Circulation Model, J. Geophys. Res., 102, 21777–21794, 1997.
Giorgi, F.: Climate change hot-spots, Geophys. Res. Lett., 33, L08707, doi:10.1029/2006GL025734, 2006.
Grell, G. A., Peckham, S. E., Schmitz, R., McKeen, S. A., Frost, G., Skamarock, W. C., and Eder, B.: Fully coupled “online” chem-istry within the WRF model, Atmos. Environ., 39, 6957–6975, 2005.
Guenther, A., Karl, T., Harley, P., Wiedinmyer, C., Palmer, P. I., and Geron, C.: Estimates of global terrestrial isoprene emissions using MEGAN (Model of Emissions of Gases and Aerosols from Nature), Atmos. Chem. Phys., 6, 3181–3210, doi:10.5194/acp-6-3181-2006, 2006.
Guerrero-Rascado, J. L., Ruiz, B., and Alados-Arboledas, L.: Mul-tispectral Lidar characterization of the vertical structure of Saha-ran dust aerosol over southern Spain, Atmos. Environ., 42, 2668– 2681, 2008.
Guerrero-Rascado, J. L., Olmo, F. J., Avilés-Rodríguez, I., Navas-Guzmán, F., Pérez-Ramírez, D., Lyamani, H., and Alados Ar-boledas, L.: Extreme Saharan dust event over the southern Iberian Peninsula in september 2007: active and passive remote sensing from surface and satellite, Atmos. Chem. Phys., 9, 8453– 8469, doi:10.5194/acp-9-8453-2009, 2009.
Hansen, J., Sato, M., and Ruedy, R.: Radiative Forcing and Climate Response, J. Geophys. Res., 102, 6831–6864, 1997.
Holben, B. N., Eck, T. F., Slutsker, I., Tanré, D., Buis, J. P., Setzer, A., Vermote, E., Reagan, J. A., Kaufman, Y. J., Nakajima, T., Lavenu, F., Jankowiak, I., and Smirnov, A.: AERONET-A Fed-erated Instrument Network and Data Archive for Aerosol Char-acterization, Remote Sens. Environ., 66, 1–19, 1998.
Im, U., Bianconi, R., Solazzo, E., Kioutsioukis, I., Badia, A., Balzarini, A., Baró, R., Bellasio, R., Brunner, D., Chemel, C., Curci, G., Denier van der Gon, H., Flemming, J., Forkel, R., Giordano, L., Jiménez-Guerrero, P., Hirtl, M., Hodzic, A., Hon-zak, L., Jorba, O., Knote, C., Makar, P. A., Manders-Groot, A., Neal, L., Pérez, J. L., Pirovano, G., Pouliot, G., San Jose, R., Sav-age, N., Schroder, W., Sokhi, R. S., Syrakov, D., Torian, A., Tuc-cella, P., Wang, K., Werhahn, J., Wolke, R., Zabkar, R., Zhang, Y., Zhang, J., Hogrefe, C., and Galmarini, S.: Evaluation of op-erational online-coupled regional air quality models over Europe and North America in the context of AQMEII phase2. Part II: particulate matter, Atmos. Environ., 115, 421–441, 2015. Inness, A., Baier, F., Benedetti, A., Bouarar, I., Chabrillat, S., Clark,
H., Clerbaux, C., Coheur, P., Engelen, R. J., Errera, Q., Flem-ming, J., George, M., Granier, C., Hadji-Lazaro, J., Huijnen, V., Hurtmans, D., Jones, L., Kaiser, J. W., Kapsomenakis, J., Lefever, K., Leitão, J., Razinger, M., Richter, A., Schultz, M. G., Simmons, A. J., Suttie, M., Stein, O., Thépaut, J.-N., Thouret, V., Vrekoussis, M., Zerefos, C., and the MACC team: The MACC reanalysis: an 8 yr data set of atmospheric composition, Atmos. Chem. Phys., 13, 4073–4109, doi:10.5194/acp-13-4073-2013, 2013.
IPCC: Climate Change 2013: The Physical Science Basis. Contri-bution of Working Group I to the Fifth Assessment Report of the Intergovern- mental Panel on Climate Change, edited by: Stocker, T. F., Qin, D., Plattner, G.-K., Tignor, M., Allen, S. K., Boschung, J., Nauels, A., Xia, Y., Bex, V., and Midgley, P. M., Cambridge University Press, Cambridge, United Kingdom and New York, NY, USA, 1535 pp., 2013.
Jacobson, M. Z.: Strong radiative heating due to the mixing state of black carbon in atmospheric aerosols, Nature, 409, 695–697, 2001.
Kuenen, J. J. P., Visschedijk, A. J. H., Jozwicka, M., and Denier van der Gon, H. A. C.: TNO-MACC_II emission inventory; a multi-year (2003–2009) consistent high-resolution European emission inventory for air quality modelling, Atmos. Chem. Phys., 14, 10963–10976, doi:10.5194/acp-14-10963-2014, 2014.
L. Palacios-Peña et al.: Evaluating the representation of aerosol optical properties 295 Levy, R. C., Mattoo, S., Munchak, L. A., Remer, L. A., Sayer, A.
M., Patadia, F., and Hsu, N. C.: The Collection 6 MODIS aerosol products over land and ocean, Atmos. Meas. Tech., 6, 2989– 3034, doi:10.5194/amt-6-2989-2013, 2013.
Liu, Y., Daum, P. H., and McGraw, R. L.: Size Truncation Effect, Threshold Behavior, and a New Type of Autocon-version Parameterization, Geophys. Res. Lett., 32, L11811, doi:10.1029/2005GL022636, 2005.
Lin, Y.-L., Farley, R. D., and Orville, H. D.: Bulk Parameterization of the Snow Field in a Cloud Model, J. Clim. Appl. Meteorol., 22, 1065–1092, 1983.
Lyamani, H., Olmo, F. J., and Alados-Arboledas, L.: Saharan dust outbreak over southeastern Spain as detected by sun photometer, Atmos. Environ., 39, 7276–7284, 2005.
Lyamani, H., Olmo, F. J., Alcántara, A., and Alados-Arboledas, L.: Atmospheric aerosols during the 2003 heat wave in southeastern Spain I: Spectral optical depth, Atmos. Environ., 40–33, 6453– 6464, 2006.
Mateos, D., Antón, M., Toledano, C., Cachorro, V. E., Alados-Arboledas, L., Sorribas, M., Costa, M. J., and Baldasano, J. M.: Aerosol radiative effects in the ultraviolet, visible, and near-infrared spectral ranges using long-term aerosol data series over the Iberian Peninsula, Atmos. Chem. Phys., 14, 13497–13514, doi:10.5194/acp-14-13497-2014, 2014.
de Meij, A., Pozzer, A., Pringle, K. J., Tost, H., and Lelieveld, J.: EMAC model evaluation and analysis of at-mospheric aerosol properties and distribution with a focus on the Mediterranean region, Atmos. Res., 114–115, 38–69, doi:10.1016/j.atmosres.2012.05.014, 2012.
Mitchell, D. L., Rasch, P., Ivanova, D., McFarquhar, G., and Nou-siainen, T.: Impact of small ice crystal assumptions on ice sedi-mentation rates in cirrus clouds and GCM simulations, Geophys. Res. Lett., 35, L09806, doi:10.1029/2008GL033552, 2008. Myhre, G., Bellouin, N., Berglen, T. F., Berntsen, T. K., Boucher,
O., Grini, A., Isaksen, I. S. A., Johnsrud, M., Mishchenki, M. I., Stordal, F., and Tanré, D.: Comparison of the radiative properties and direct radiative effect of aerosols from a global aerosol model and remote sensing data over ocean, Tellus, 59, 115–129, 2007. Myhre, G.: Consistency between satellite-derived and modelled
es-timates of the direct aerosol effect, Science, 325, 187–190, 2009. Navas-Guzmán, F., Müller, D., Bravo-Aranda, J. A., Guerrero-Rascado, J. L., Granados-Muñoz, M. J., Pérez-Ramírez, D., Olmo-Reyes, F., and Alados-Arboledas, L.: Eruption of the Eyjafjallajökull Volcano in spring 2010: Multiwave-length Raman Lidar Measurements of Sulphate Particles in the Lower Troposphere, J. Geophys. Res., 118, 1804–1813, doi:10.1002/jgrd.50116, 2013.
Obregón, M. A., Pereira, S., Wagner, F., Serrano, A., Cancillo, M. L., and Silva, A. M.: Regional differences of column aerosol pa-rameters in western Iberian Peninsula, Atmos. Environ., 62, 208– 219, doi:10.1016/j.atmosenv.2012.08.016, 2012.
Papadimas, C. D., Hatzianastassiou, N., Matsoukas, C., Kanaki-dou, M., Mihalopoulos, N., and Vardavas, I.: The direct effect of aerosols on solar radiation over the broader Mediterranean basin, Atmos. Chem. Phys., 12, 7165–7185, doi:10.5194/acp-12-7165-2012, 2012.
Pappalardo, G., Amodeo, A., Apituley, A., Comeron, A., Freuden-thaler, V., Linné, H., Ansmann, A., Bösenberg, J., D’Amico, G., Mattis, I., Mona, L., Wandinger, U., Amiridis, V.,
Alados-Arboledas, L., Nicolae, D., and Wiegner, M.: EARLINET: to-wards an advanced sustainable European aerosol lidar network, Atmos. Meas. Tech., 7, 2389–2409, doi:10.5194/amt-7-2389-2014, 2014.
Péré, J. C., Mallet, M., Pont, V., and Bessagnet, B.: Evaluation of an aerosol optical scheme in the chemistry-transport model CHIMERE, Atmos. Environ., 44, 3688–3699, 2010.
Pereira, S., Wagner, F., and Silva, A. M.: Scattering properties and mass concentration of local and long-range transported aerosols over the South Western Iberia Peninsula, Atmos. Environ., 42, 7623–7631, doi:10.1016/j.atmosenv.2008.06.008, 2008. Pereira, S. N., Wagner, F., and Silva, A. M.: Seven years of
mea-surements of aerosol scattering properties, near the surface, in the southwestern Iberia Peninsula, Atmos. Chem. Phys., 11, 17– 29, doi:10.5194/acp-11-17-2011, 2011.
Pereira, S., Preißler, J., Guerrero-Rascado, J. L., Silva, A. M., and Wagner, F.: Forest fire smoke layers observed in the free tro-posphere over Portugal with a Multiwavelength Raman Lidar: optical and microphysical properties, Scientific World J., 2014, 421838, doi:10.1155/2014/421838, 2014.
Pouliot, G., Pierce, T., Van Der Gon, H. D., Schaap, M., Moran, M., and Nopmongcol, U.: Comparing emission inventories and model-ready emission datasets between Europe and North Amer-ica for the AQMEII project, Atmos. Environ., 53, 4–14, 2012. Pouliot, G., Van Der Gon, H. A. D., Kuenen, J., Zhang, J., Moran,
M. D., and Makar, P. A.: Analysis of the emission inventories and model-ready emission datasets of Europe and North America for phase 2 of the AQMEII project, Atmos. Environ., 115, 345–360, doi:10.1016/j.atmosenv.2014.10.061, 2014.
Preißler, J., Wagner, F., Pereira, S., and Guerrero-Rascado, J. L.: Multi-instrumental observation of an exceptionally strong Saha-ran dust outbreak over Portugal, J. Geophys. Res, 116, D24204, doi:10.1029/2011JD016527, 2011.
Ramanathan, V. and Feng, Y.: Air pollution, greenhouse gases and climate change: Global and regional perspectives, Atmos. Envi-ron., 43, 37–50, 2009.
Randall, D. A., Wood, R. A., Bony, S., Colman, R., Fichefet, T., Fyfe, J., Kattsov, V., Pitman, A., Shukla, J., Srinivasan, J., Stouf-fer, R.J., Sumi, A., and Taylor, K. E.: Climate Models and Their Evaluation, in: Climate Change 2007: The Physical Science Ba-sis. Contribution of Working Group I to the Fourth Assessment Report of the Intergovernmental Panel on Climate Change, edited by: Solomon, S., Qin, D., Manning, M., Chen, Z., Marquis, M., Averyt, K. B., Tignor, M., and Miller, H. L., Cambridge Univer-sity Press, Cambridge, UK and New York, NY, USA, 2007. Remer, L. A., Kaufman, Y. J., Tanré, D., Mattoo, S., Chu, D. A.,
Martins, J. V., Li, R. R., Ichoku, C., Levy, R. C., Kleidman, R. G., Eck, T. F., Vermote, E., and Holben, B. N.: The MODIS aerosol algorithm, products, and validation, J. Atmos. Sci., 62, 947–973, 2005.
Precip-itation Development in Narrow Cold-Frontal Rainbands, J. At-mos. Sci., 20, 2949–2972, 1984.
Santos, D., Costa, M. J., and Silva, A. M.: Direct SW aerosol radia-tive forcing over Portugal, Atmos. Chem. Phys., 8, 5771–5786, doi:10.5194/acp-8-5771-2008, 2008.
Schell, B., Ackermann, I. J., Hass, H., Binkowski, F. S., and Ebel, A.: Modeling the formation of secondary organic aerosol within a comprehensive air quality model system, J. Geophys. Res., 106, 28275–28293, 2001.
Shaw, W., Allwine, K. J., Fritz, B. G., Rutz, F. C., Rishel, J. P., and Chapman, E. G.: An evaluation of the wind erosion module in DUSTRAN, Atmos. Environ., 42, 1907–1921, 2008.
Sicard, M., Guerrero-Rascado, J. L., Navas-Guzmán, F., Preißler, J., Molero, F., Tomás, S., Bravo-Aranda, J. A., Comerón, A., Roca-denbosch, F., Wagner, F., Pujadas, M., and Alados-Arboledas, L.: Monitoring of the Eyjafjallajökull volcanic aerosol plume over the Iberian Peninsula by means of four EARLINET lidar stations, Atmos. Chem. Phys., 12, 3115–3130, doi:10.5194/acp-12-3115-2012, 2012.
Skamarock, W. C., Klemp, J. B., Dudhia, J., Gill, D. O., Barker, D. M., Wang, W., and Powers, J. G.: A Description of the Advanced Research WRF Version 2. NCAR Technical Note, NCAR/TN-468+STR, 88 pp., National Center for Atmospheric Research, Boulder, Colorado, USA, available at: http://wrf-model.org/ wrfadmin/publications.php (last access: 18 October 2016), 2005. Sofiev, M., Vankevich, R., Lotjonen, M., Prank, M., Petukhov, V., Ermakova, T., Koskinen, J., and Kukkonen, J.: An operational system for the assimilation of the satellite information on wild-land fires for the needs of air quality modelling and forecasting, Atmos. Chem. Phys., 9, 6833–6847, doi:10.5194/acp-9-6833-2009, 2009.
Tao, W. K., Simpson, J., and McCumber, M.: An ice-water satura-tion adjustment. Mon. Weather Rev., 117, 231–235, 1989. Toledano, C., Cachorro, V. E., de Frutos, A. M., Sorribas, M., Prats,
N., and de la Morena, B. A.: Inventory of African desert dust events over the southwestern Iberian Peninsula in 2000–2005 with an AERONET Cimel Sun photometer, J. Geophys. Res., 112, D21201, doi:10.1029/2006JD008307, 2007.
Twomey, S. A.: Pollution and the planetary albedo, Atmos. Envi-ron., 8, 1251–1256, 1974.
Twomey, S. A.: Aerosols, clouds and radiation, Atmos. Environ., 25, 2435–2442, 1991.
Valenzuela, A., Olmo, F. J., Lyamani, H., Antón, M., Quirantes, A., and Alados-Arboledas, L.: Aerosol radiative forcing dur-ing African desert dust events (2005–2010) over Southeastern Spain, Atmos. Chem. Phys., 12, 10331–10351, doi:10.5194/acp-12-10331-2012, 2012.
Wagner, F., Bortoli, D., Pereira, S., Costa, M. J., Silva, A. M., Weinzierl, B., Esselborn, M., Petzold, A., Rasp, K., Heinold, B., and Tegen, I.: Properties of dust aerosol particles transported to Portugal from the Sahara desert, Tellus, 61, 297–306, 2009. Weil, J., Sykes, R., and Venkatram, A.: Evaluating air-quality
mod-els: review and outlook, J. Appl. Meteorol, 31, 1121–1145, 1992. Wiedinmyer, C., Akagi, S. K., Yokelson, R. J., Emmons, L. K., Al-Saadi, J. A., Orlando, J. J., and Soja, A. J.: The Fire INventory from NCAR (FINN): a high resolution global model to estimate the emissions from open burning, Geosci. Model Dev., 4, 625– 641, doi:10.5194/gmd-4-625-2011, 2011.
Willmott, C. J., Ackleson, S. G., Davis, R. E., Feddema, J. J., Klink, K. M., Legates, D. R., O’Donnell, J., and Rowe, C. M.: Statistics for the evaluation and comparison of models, J. Geophys. Res., 90, 8995–9005, 1985.
Willmott, C. J. and Matsuura, K.: Advantages of the mean absolute error (MAE) over the root mean square error (RMSE) in assess-ing average model performance, Clim. Res., 30, 79–82, 2005. Yang, Q., W. I. Gustafson Jr., Fast, J. D., Wang, H., Easter, R.