AMTD
5, 813–838, 2012Site selective real-time measurements of atmospheric N2O
J. Mohn et al.
Title Page
Abstract Introduction
Conclusions References
Tables Figures
◭ ◮
◭ ◮
Back Close
Full Screen / Esc
Printer-friendly Version Interactive Discussion
Discussion
P
a
per
|
Dis
cussion
P
a
per
|
Discussion
P
a
per
|
Discussio
n
P
a
per
|
Atmos. Meas. Tech. Discuss., 5, 813–838, 2012 www.atmos-meas-tech-discuss.net/5/813/2012/ doi:10.5194/amtd-5-813-2012
© Author(s) 2012. CC Attribution 3.0 License.
Atmospheric Measurement Techniques Discussions
This discussion paper is/has been under review for the journal Atmospheric Measurement Techniques (AMT). Please refer to the corresponding final paper in AMT if available.
Site selective real-time measurements of
atmospheric N
2
O isotopomers by laser
spectroscopy
J. Mohn1, B. Tuzson1, A. Manninen1, N. Yoshida2, S. Toyoda2, W. A. Brand3, and L. Emmenegger1
1
Laboratory for Air Pollution & Environmental Technology, Empa, D ¨ubendorf, Switzerland
2
Department of Environmental Chemistry and Engineering, Tokyo Institute of Technology, Yokohama, Japan
3
Max-Planck-Institute for Biogeochemistry, Jena, Germany
Received: 3 January 2012 – Accepted: 9 January 2012 – Published: 23 January 2012 Correspondence to: J. Mohn (joachim.mohn@empa.ch)
AMTD
5, 813–838, 2012Site selective real-time measurements of atmospheric N2O
J. Mohn et al.
Title Page
Abstract Introduction
Conclusions References
Tables Figures
◭ ◮
◭ ◮
Back Close
Full Screen / Esc
Printer-friendly Version Interactive Discussion
Discussion
P
a
per
|
Dis
cussion
P
a
per
|
Discussion
P
a
per
|
Discussio
n
P
a
per
|
Abstract
We describe the first high precision real-time analysis of the N2O site-specific isotopic
composition at ambient mixing ratios. Our technique is based on mid-infrared quan-tum cascade laser absorption spectroscopy (QCLAS) combined with an automated preconcentration unit. The QCLAS allows for simultaneous and specific analysis of the 5
three main stable N2O isotopic species, 14
N15N16O,15N14N16O,14N14N16O, and the re-spective site-specific relative isotope ratio differencesδ15Nα andδ15Nβ. Continuous, stand-alone operation is achieved by using liquid nitrogen free N2O preconcentration, a quasi-room-temperature quantum cascade laser (QCL), quantitative sample transfer to the QCLAS, and an optimized calibration algorithm. The N2O site-specific isotopic
10
composition (δ15Nα andδ15Nβ) can be analysed with a long term precision of 0.2 ‰. The potential of this analytical tool is illustrated by continuous N2O isotopomer
mea-surements above a grassland plot over three weeks period, which allowed identification of microbial source and sink processes.
1 Introduction 15
Nitrous oxide (N2O) is the most important anthropogenically emitted ozone depleting
substance and also a significant greenhouse gas (Ravishankara et al., 2009). N2O mix-ing ratios in the troposphere increased from 270 ppb to the current level of 321.6 ppb (AGAGE 2008) at 0.8 ppb yr−1 (2005 to 2008) with more than one third of N2O
emis-sions being anthropogenic (Montzka et al., 2011; Solomon et al., 2007). For a better 20
understanding of source and sink processes, however, the information obtained from measuring the intramolecular distribution of 15N on the central (α) and the end (β) position of the linear N2O molecule is crucial (Yoshida and Toyoda, 2000).
Abundances of the different isotopic species (14N14N16O, 14N15N16O, 15N14N16O, etc.) are usually reported in theδ-notation, whereδ15N denotes the relative difference 25
AMTD
5, 813–838, 2012Site selective real-time measurements of atmospheric N2O
J. Mohn et al.
Title Page
Abstract Introduction
Conclusions References
Tables Figures
◭ ◮
◭ ◮
Back Close
Full Screen / Esc
Printer-friendly Version Interactive Discussion
Discussion
P
a
per
|
Dis
cussion
P
a
per
|
Discussion
P
a
per
|
Discussio
n
P
a
per
|
to atmospheric N2as the reference material (Coplen, 2011). Similarly,δ 15
Nβ denotes the relative difference of isotope ratios for15N14N16O vs.14N14N16O.
The bulk nitrogenδ value (δ15Nbulk=(δ15Nα+δ15Nβ)/2) of tropospheric N2O is en-riched by 6.3±0.3 ‰ to 6.72±0.12 ‰, depending on the sampling location and time (Kaiser et al., 2003; Park et al., 2004; R ¨ockmann and Levin, 2005; Toyoda et al., 2004), 5
with a strong site preference (SP=δ15Nα−δ15Nβ) of 18.7±2.2 ‰ for the central nitro-gen atom (Yoshida and Toyoda, 2000). Temporal trends in the N2O isotopic
compo-sition from firn air, ice core and archived air sample measurements indicate a year to year decrease inδ15Nbulk of 0.04 ‰ yr−1, confirming substantial emissions of isotopi-cally depleted N2O (Bernard et al., 2006; Ishijima et al., 2007; R ¨ockmann and Levin,
10
2005). According to isotopic budgetary calculations based on a simple two-box model, this could be due to increased anthropogenic N2O emission from agricultural soils, as well as a to a change in their average isotopic signature (Ishijima et al., 2007).
On a local scale, the N2O isotopic composition can be applied to disentangle or even
quantitatively apportion N2O production and destruction pathways. For example, the 15
15
N depletion in N2O produced by autotrophic nitrification was found to be considerably higher as compared to heterotrophic denitrification (Koba et al., 2009; Sutka et al., 2006; Toyoda et al., 2005; Yoshida, 1988). On the other hand, process-specific effects on δ15Nbulk might be masked by shifts in the precursor signature (Well et al., 2008), and theoretical considerations indicate a major impact of the involved bacterial species 20
(Schmidt et al., 2004). In contrast to δ15Nbulk, the site preference is considered to be independent of the isotopic composition of the precursor and thus supplies clear process information even if the isotopic signature of the substrate for N2O production
is lacking (Frame and Casciotti, 2010; Ostrom et al., 2007; Sutka et al., 2006; Toyoda et al., 2002; Well and Flessa, 2009; Yamagishi et al., 2007).
25
The standard technique for N2O isotopic measurements is laboratory-based
AMTD
5, 813–838, 2012Site selective real-time measurements of atmospheric N2O
J. Mohn et al.
Title Page
Abstract Introduction
Conclusions References
Tables Figures
◭ ◮
◭ ◮
Back Close
Full Screen / Esc
Printer-friendly Version Interactive Discussion
Discussion
P
a
per
|
Dis
cussion
P
a
per
|
Discussion
P
a
per
|
Discussio
n
P
a
per
|
and δ15Nβ (Bernard et al., 2006; Toyoda et al., 2011a,b). Nevertheless, it also has some disadvantages such as the large size of the instrument, which hinders in-situ field measurements. Laser spectroscopy is a valuable alternative because it is inher-ently selective, even for molecules with the same mass (Janssen and Tuzson, 2006; Gagliardi et al., 2005; Nakayama et al., 2007; Uehara et al., 2001, 2003; W ¨achter and 5
Sigrist, 2007), and field-deployable instruments for unattended measurements can be designed. A significant improvement was obtained in recent years by the implementa-tion of quantum cascade laser sources (QCL) to reach a precision of 0.5 ‰ forδ15Nα andδ15Nβat N2O mixing ratios of 90 ppm (W ¨achter et al., 2008).
In the present project we describe the first instrumentation to perform real-time anal-10
ysis of N2O site-specific isotopic composition at atmospheric mixing ratios. This is
achieved combining a liquid nitrogen-free fully-automated preconcentration unit opti-mized and validated for N2O isotopomer analysis by Mohn et al. (2010) with an
im-proved version of the QCLAS published by W ¨achter et al. (2008). The potential of this approach is demonstrated by a three week measurement campaign of atmospheric 15
N2O to identify distinct soil microbial N2O source and sink processes.
2 Materials and methods
A schematic diagram of the measurement setup is shown in Fig. 1. Details on the development, optimization and validation of the N2O preconcentration unit and the QC
laser spectrometer have been described previously (Mohn et al., 2010; W ¨achter et al., 20
AMTD
5, 813–838, 2012Site selective real-time measurements of atmospheric N2O
J. Mohn et al.
Title Page
Abstract Introduction
Conclusions References
Tables Figures
◭ ◮
◭ ◮
Back Close
Full Screen / Esc
Printer-friendly Version Interactive Discussion
Discussion
P
a
per
|
Dis
cussion
P
a
per
|
Discussion
P
a
per
|
Discussio
n
P
a
per
|
2.1 Sampling site and setup
Field experiments were conducted in D ¨ubendorf at 430 m a.s.l.
(47◦24′10′′N/8◦36′43′′E). The observation area is located in an industrial and densely populated region near Zurich. A main road passes 100 m south, and a high-way around 750 m north of the sampling site. Air was continuously sampled above 5
a grassland plot (5 m×20 m) at a flow rate of about one standard litre per minute (slpm) through a 15 m long unheated PTFE tubing (ID 4 mm) using a diaphragm vacuum pump (KNF Neuberger, CH). The air intake was first mounted at 1.5 m above ground (8 to 24 September), and then (24 to 31 September) 10 cm above the surface to be more representative for soil N2O production. At the pump outlet, the pressure was adjusted 10
to 4 bar by means of a pressure relief valve. Water and CO2 were quantitatively
removed by permeation drying (PD-100T-48, PermaPure Inc., USA) and by chemical trapping with Ascarite (30 g, 10–35 mesh, Fluka, Switzerland) bracketed by Mg(ClO4)2 (2×13 g, Fluka, Switzerland). Finally, the sample was passed through a sintered metal filter (SS-6F-MM-2, Swagelok, USA) and directed to the preconcentration unit. An 15
alternative sample input consisted of pressurized air (Messer, Switzerland) employed as target gas (Klausen et al. 2010) which was treated as described above by a second permeation dryer and a chemical trap (20 g Ascarite, 2×8 g Mg(ClO4)2). This setup
allows determining the long term stability and precision of the complete analytical procedure, including preconcentration, laser spectroscopic analysis and calibration. 20
The chemical traps were exchanged every 3 to 4 days before reaching their maximal load. To detect any potential breakthrough, the CO2 concentration was monitored by QCLAS after preconcentration together with the N2O isotopomers (CO2 line at
AMTD
5, 813–838, 2012Site selective real-time measurements of atmospheric N2O
J. Mohn et al.
Title Page
Abstract Introduction
Conclusions References
Tables Figures
◭ ◮
◭ ◮
Back Close
Full Screen / Esc
Printer-friendly Version Interactive Discussion
Discussion
P
a
per
|
Dis
cussion
P
a
per
|
Discussion
P
a
per
|
Discussio
n
P
a
per
|
2.2 Instrumentation
2.2.1 N2O preconcentration
The technology of our preconcentration unit is based on a previously developed system called “Medusa” (Miller et al., 2008), re-designed and optimized for the preconcentra-tion of N2O isotopic species and their subsequent quantification by laser spectroscopy
5
(Mohn et al., 2010). During standard operation, 10 l of ambient air are preconcentrated on a HayeSep D trap and desorbed in approximately 50 ml of synthetic air, yielding a concentration increase from ambient mixing ratios to>71 ppm N2O. The system
of-fers quantitative (>99%) N2O recovery without any significant isotopic fractionation or
relevant spectral interferences from other atmospheric constituents. Modifications to 10
the previous procedure (Mohn et al., 2010) are mainly related to the desorption phase, where the N2O concentration profile was further optimized by increasing the trap
tem-perature to 10◦C and decreasing the flow rate of high purity synthetic air to 10 sccm (standard cubic centimetre per minute).
2.2.2 Laser spectrometer
15
The employed QCLAS is based on the instrument described by W ¨achter et al. (2008). It consists of a single-mode, pulsed QCL emitting at 2188 cm−1, a multipass absorp-tion cell (optical path length 56 m, volume 0.5 l; Aerodyne Research Inc., USA) and a detection system with pulse normalization. Laser control, data acquisition and simul-taneous quantification of the three main N2O isotopic species (
14
N14N16O,15N14N16O, 20
14
N15N16O) is accomplished by the TDLWintel software (Aerodyne Research Inc., USA), taking into account path length, gas temperature (∼305 K), pressure (8 kPa) and laser line width (0.0068 cm−1). Employing a new generation thermo-electrically cooled detector (PVI-3TE-5, Vigo System, PL), a new quasi-room temperature QCL (Alpes Lasers SA, Switzerland) and redesigned electronics led to a considerably im-25
AMTD
5, 813–838, 2012Site selective real-time measurements of atmospheric N2O
J. Mohn et al.
Title Page
Abstract Introduction
Conclusions References
Tables Figures
◭ ◮
◭ ◮
Back Close
Full Screen / Esc
Printer-friendly Version Interactive Discussion
Discussion
P
a
per
|
Dis
cussion
P
a
per
|
Discussion
P
a
per
|
Discussio
n
P
a
per
|
Applying the Allan variance approach (Werle, 2011) for the site-specific relative dif-ference of isotope ratios δ15Nα and δ15Nβ, a short term precision of 1 ‰ Hz −1/2 is achieved at mixing ratios of 70 ppm N2O, as typically obtained by preconcentration of atmospheric N2O. For six minutes spectral averaging a precision below 0.1 ‰ is
ob-tained, the maximum precision at 30 min averaging corresponds to 0.04 ‰, for both 5
δ15Nαandδ15Nβ.
The laser spectrometer was operated in a batch mode, where the gas cell was first evacuated by a scroll pump (TriScroll 300, Varian), then purged for 4 min with 10 sccm of purge gas at reduced pressure (1 kPa), before the downstream on-off valve (V3 in Fig. 1) (2-way, 009-0089-900, Parker Hannifin Corp., USA) was closed. The purge gas 10
was either synthetic air (prior to analysis of preconcentrated ambient or pressurized air) or calibration gas (prior to calibration). Subsequently, the multipass cell was filled with preconcentrated air or calibration gas to a cell pressure of 8 kPa. Finally, the multipass cell was closed by switching the 3-way valve V2 or V4 (009-0933-900, Parker Hannifin Corp., USA) before the gas sample was analysed.
15
2.3 Automation and measurement procedure
The complete experimental setup including preconcentration unit, solenoid valves (V1– V6, Parker Hannifin Corp., USA) and thermal mass flow controllers (MFCs, Redy Smart series, V ¨ogtlin Instruments, Switzerland) was controlled and monitored by a LabVIEW program (National Instruments Corp., USA). All peripherals were connected through 20
a 16-port serial to Ethernet connector (EL-160, Digi International Inc., USA). For am-bient air monitoring, a 460 min measuring cycle was repeated which consists of the following steps (Fig. 2): (A) analysis of preconcentrated N2O from compressed air
(tar-get gas, one sample) and ambient air (three gas samples), (B) analysis of standard II (two replicates) dynamically diluted to 71 ppm N2O with synthetic air to calibrate theδ
25
scale, (C) identical to (A), (D) analysis of standard I (88 ppm N2O, two replicates) to
AMTD
5, 813–838, 2012Site selective real-time measurements of atmospheric N2O
J. Mohn et al.
Title Page
Abstract Introduction
Conclusions References
Tables Figures
◭ ◮
◭ ◮
Back Close
Full Screen / Esc
Printer-friendly Version Interactive Discussion
Discussion
P
a
per
|
Dis
cussion
P
a
per
|
Discussion
P
a
per
|
Discussio
n
P
a
per
|
samples (A)–(D), standard I (71 ppm N2O) was analysed as a reference point and to correct for drift effects.
2.4 Analysis of N2O mixing ratios and isotopomer ratios
The N2O mixing ratios of ambient air were determined based on the concentration
of the main isotopic species 14N14N16O and calibrated against laboratory standard I 5
dynamically diluted to different concentration levels (see Fig. 2 step D). The precon-centration step was taken into account via the ratio of the gas volume in the multipass cell (Vcell) and the gas volume applied for N2O preconcentration (Vprecon). WhileVprecon
can be accurately computed based on the adsorption time and flow, forVcell this is not
possible. Therefore, the exact value forVcellunder standard conditions was determined
10
analysing preconcentrated N2O from a highly accurate standard (319.91±0.12 ppb)
provided by the World Meteorological Organization (WMO) Central Calibration Lab-oratory (CCL) (Hall et al., 2007). N2O concentrations of the laboratory standards
were quantified by QCLAS against commercial calibration gases (90.5±0.1 ppm N2O,
Messer, Switzerland) and are indicated in Table 1. 15
Relative differences of isotopic ratiosδ15Nα andδ15Nβ were determined employing a set of standard gases produced in our laboratory based on gravimetric and dynamic dilution methods from pure medical N2O (Messer, Switzerland) supplemented with distinct amounts of isotopically pure (>98 %) 15N14N16O and 14N15N16O (Cambridge Isotope Laboratories, USA). Primary laboratory standards were analysed forδ15Nα, 20
δ15Nβandδ15Nbulkby IRMS at the Tokyo Institute of Technology (Toyoda and Yoshida, 1999). Table 1 indicates the isotopic composition of the secondary laboratory stan-dards applied in the current project and analysed against primary stanstan-dards by QCLAS. Theδ15Nbulkof pure medical N2O was additionally analysed by mass spectrometry at
the IsoLab of the Max-Planck Institute for Biogeochemistry (MPI-BGC, Jena, Germany) 25
AMTD
5, 813–838, 2012Site selective real-time measurements of atmospheric N2O
J. Mohn et al.
Title Page
Abstract Introduction
Conclusions References
Tables Figures
◭ ◮
◭ ◮
Back Close
Full Screen / Esc
Printer-friendly Version Interactive Discussion
Discussion
P
a
per
|
Dis
cussion
P
a
per
|
Discussion
P
a
per
|
Discussio
n
P
a
per
|
operated 6-port valve. This setup enabled a direct comparison of N2 produced from
combustion of IAEA-N1 to N2obtained from the medical N2O by reduction in the 2nd EA reactor. Quantitative N2O conversion reaction yield was verified by the absence
of anym/z 44 ion current response following N2O introduction. Using aδ 15
N value of
+0.43 ‰ for IAEA-N1 as the scale anchor, aδ15Nbulkvalue of 1.64±0.10 ‰ (n=4) was 5
obtained which was different by 0.39 ‰ from the Tokyo Tech result. A similar difference of 0.3 ‰ was observed by Toyoda and Yoshida (1999) forδ15Nbulkof a laboratory stan-dard calculated from δ15Nα and δ15Nβ (calibration via NH4NO3 decomposition) and determined after N2O to N2 reduction. Discrepancies were attributed to fractionation
during incomplete NH4NO3decomposition (Toyoda and Yoshida, 1999).
10
Relative differences of site - selective isotope ratios δ15Nα and δ15Nβ of precon-centrated N2O were corrected for dependency of the isotope ratios on the N2O mixing
ratio (before preconcentration). These corrections were small, about 0.004 ‰ ppb−1 and 0.016 ‰ ppb−1forδ15Nα andδ15Nβ, respectively. Moreover, measurements that were significantly influenced by abrupt changes in the laser intensity were discarded. 15
These light intensity changes affected less than 2 % of the data, and the laser driver that was identified as the source of instability was recently replaced.
To confirm the accuracy of our measurements, we analysed background air in a cylin-der filled in 2006 by the Earth System Research Laboratory (Global Monitoring Divi-sion) of the National Oceanic & Atmospheric Administration (NOAA). The trace gas 20
mixing ratios analysed by the WMO CCL are typical for natural air: 384.40±0.02 ppm CO2, 319.91±0.12 ppb N2O, 1838.5±0.4 ppb CH4, 143.9±1.0 ppb CO. The QCLAS
analysis of the N2O site-selective isotopic composition, withδ 15
Nα=15.62±0.06 ‰, δ15Nβ=−2.84±0.04 ‰,δ15Nbulk=6.39±0.03 ‰ and SP=18.45±0.08 ‰ (the preci-sion indicated is the standard error of the mean), is in perfect agreement with published 25
AMTD
5, 813–838, 2012Site selective real-time measurements of atmospheric N2O
J. Mohn et al.
Title Page
Abstract Introduction
Conclusions References
Tables Figures
◭ ◮
◭ ◮
Back Close
Full Screen / Esc
Printer-friendly Version Interactive Discussion
Discussion
P
a
per
|
Dis
cussion
P
a
per
|
Discussion
P
a
per
|
Discussio
n
P
a
per
|
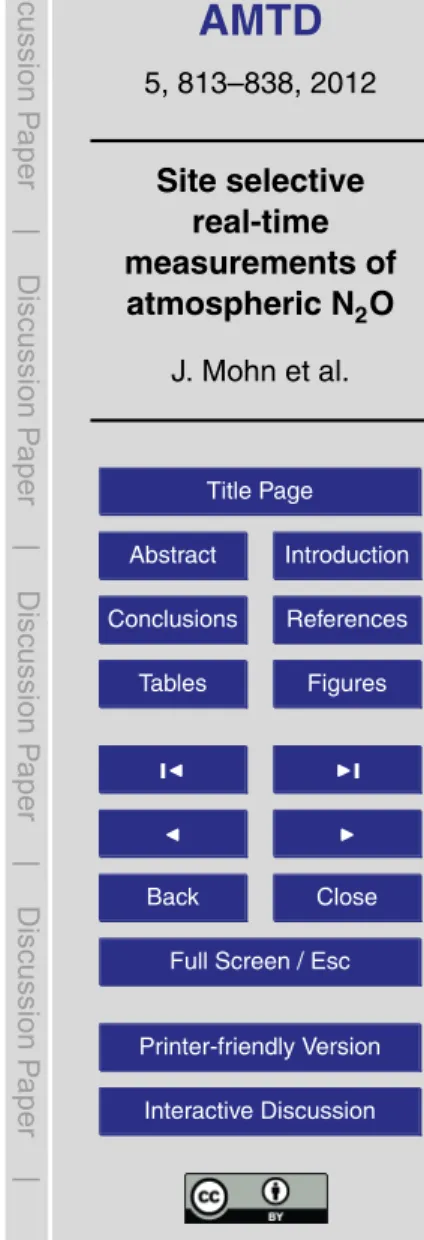
3 Results and discussion
3.1 Continuous analysis of N2O isotopomers in ambient air
Figure 3 presents to our knowledge the first example of real-time analysis of N2O site-selective isotopic composition. Measurements were conducted for three weeks be-tween 8th and 31st September 2010, corresponding to almost 550 air samples (408 5
samples of ambient air, 136 target gas samples) that were analysed in stand-alone op-eration. During the first two weeks of the measuring campaign (up to 22nd September), N2O mixing ratios display tiny but typical diurnal variations with night-time increases up
to 334.2 ppb, i.e. 10 ppb above background concentrations (Fig. 3). Even though these changes in N2O mixing ratios were small in the beginning, theδ
15
Nbulkvalues display 10
a detectable inverse trend indicating emissions of 15N depleted nitrous oxide. Sub-stantially higher N2O mixing ratios accompanied byδ
15
Nbulkchanges up to 10 ‰ were observed after fertilizer addition (200 kg N ha−1 NH
4NO3, 400 kg C ha− 1
sucrose) on 22 September.
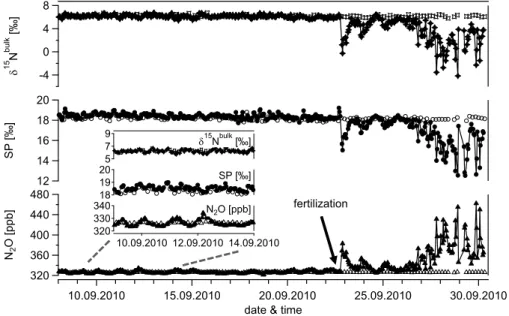
Long-term precision and repeatability including preconcentration and calibration was 15
assessed analysing a pressurized air cylinder (target gas) at every fourth preconcentra-tion run (open symbols Fig. 3). Figure 4 displays histogram plots of repeated measure-ments (n=136) with average N2O mixing ratios of 326.47±0.36 ppb and site-specific
relative isotope ratio differences ofδ15Nα=15.28±0.24 ‰ andδ15Nβ=−2.91±0.17 ‰ (the precision indicated is the standard deviation). These values are consistent with 20
background air with minor contributions from a 15N depleted N2O emission source.
The achieved long-term precision for δ15Nα and δ15Nβ is superior to state-of-the-art IRMS (Bernard et al., 2006; Toyoda et al., 2011a,b). Additionally, precision for N2O mix-ing ratios determined by QCLAS is comparable to gas chromatography with electron capture detection (GC-ECD), the standard technique applied in global monitoring net-25
AMTD
5, 813–838, 2012Site selective real-time measurements of atmospheric N2O
J. Mohn et al.
Title Page
Abstract Introduction
Conclusions References
Tables Figures
◭ ◮
◭ ◮
Back Close
Full Screen / Esc
Printer-friendly Version Interactive Discussion
Discussion
P
a
per
|
Dis
cussion
P
a
per
|
Discussion
P
a
per
|
Discussio
n
P
a
per
|
capabilities, the statistical uncertainty for repeated measurements (standard error of the mean) is considerably lower.
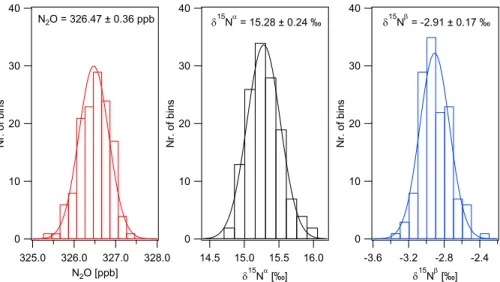
3.2 Source appointment by N2O isotopomer analysis
The isotopic signature of a source process can be estimated by the Keeling-plot ap-proach where the variations in the isotopic composition are plotted against the inverse 5
of concentration values. This technique was originally developed for carbon dioxide and its isotopologues and has been employed in numerous studies, recently also in combination with field-deployable instrumentation for continuous CO2 isotopic
analy-sis (McManus et al., 2010; Mohn et al., 2008; Tuzson et al., 2011). For N2O, up to date all process studies on N2O isotopic species had to rely on grab sampling followed
10
by IRMS laboratory analysis because real-time analysis was not available with the re-quired precision. Consequently, current research is based on short-term investigations with limited temporal and spatial averaging capabilities (Ostrom et al., 2010; Toyoda et al., 2011a; Yamagishi et al., 2007).
In Fig. 5, data obtained in a 24 h time interval (e.g. from 23 September noon to 15
24 September noon) was analysed using the Keeling plot approach. Individual data points represent the average N2O mixing ratio and isotopic composition over 20 min of
N2O sampling during preconcentration. Assuming a two source mixing with unpolluted background air, the intercept of the linear regression line corresponds to the isotopic signature of the N2O emitting processes forδ
15
Nbulks and SPs. This approach implies
20
that the soil microbial N2O production pathways and its isotopic signatures are basically
constant for one diurnal cycle. As can be observed from the low scatter in the Keeling plots (i.e. Fig. 5), this model is adequate for the studied processes and gives moderate uncertainties in the linear regression parameters (Fig. 6).
Before fertilizer addition the diurnal variability in N2O mixing ratios was small, in the 25
range of 3.0 to 10.5 ppb, accompanied by only a slight shift to lower relative isotope ratio differences at higher N2O mixing ratios. It was, nevertheless, possible to resolve
AMTD
5, 813–838, 2012Site selective real-time measurements of atmospheric N2O
J. Mohn et al.
Title Page
Abstract Introduction
Conclusions References
Tables Figures
◭ ◮
◭ ◮
Back Close
Full Screen / Esc
Printer-friendly Version Interactive Discussion
Discussion
P
a
per
|
Dis
cussion
P
a
per
|
Discussion
P
a
per
|
Discussio
n
P
a
per
|
signatures (δ15Nbulks , SPs). These varied between−5±7 ‰ to−26±6 ‰ forδ 15
Nbulks
and 3±13 ‰ to 29±5 ‰ for SPs with a temporal trend (9 to 22 September) from low
to highδ15Nbulks and high to low SPsvalues (Fig. 6). Periods with changes in N2O
mix-ing ratios below 6.5 ppb (2%) were not considered. To estimate the net isotope effect (∆δ15Nbulks =δ
15
N(substrate)−δ15Nbulks ) of the microbial source process, the 15
N con-5
tent of the substrate for N2O production needs to be known. As the focus of the present study was on method development for ambient air monitoring and not on soil science, no supplementary soil parameters were determined. However, a δ15N (substrate) of 5 ‰ may be assumed for the inorganic soil nitrogen pool (Makarov et al., 2010). This results in a net isotope effect (∆δ15Nbulks ) between 10 and 31 ‰, which is characteristic 10
for N2O produced by heterotrophic denitrification. In pure culture studies with
denitri-fying bacteria, Sutka et al. (2006) and Toyoda et al. (2005) reported up to 39 ‰ for
∆δ15Nbulks of N2O, and Koba et al. (2009) assigned the range 0 to 39 ‰ for N2O
de-rived from heterotrophic denitrification. In contrast, N2O produced by nitrifying bacteria leads to a significantly higher15N depletion with a net isotope effect (∆δ15Nbulks =δ
15
N 15
(NH+4)−δ15Nbulks ) between 46.9 ‰ (Sutka et al., 2006) and 68 ‰ (Yoshida, 1988).
The observed co-variation of SPsand∆δ 15
Nbulks (Fig. 6) for N2O emitted before
fer-tilizer application with a slope of 1.18±0.32 can be attributed to a partial consumption by N2O reductase activity of denitrifying bacteria (Koba et al., 2009; Yamagishi et al., 2007). Similar values between 1.0 and 1.2 for SPs/∆δ
15
Nbulks were reported by
Os-20
trom et al. (2007) for N2O reduction by two denitrifier species. The temporal trend from
high to low SPs and low to high∆δ15Nbulks values (Fig. 6) can thus be interpreted as a decreasing share of N2O reduction vs. N2O production. The N2O vs. (N2O+N2) ratio
increase correlates with a night-time air temperature decrease from 13◦C to 6◦C at the nearby NABEL station (data not shown), which is consistent with the temperature de-25
AMTD
5, 813–838, 2012Site selective real-time measurements of atmospheric N2O
J. Mohn et al.
Title Page
Abstract Introduction
Conclusions References
Tables Figures
◭ ◮
◭ ◮
Back Close
Full Screen / Esc
Printer-friendly Version Interactive Discussion
Discussion
P
a
per
|
Dis
cussion
P
a
per
|
Discussion
P
a
per
|
Discussio
n
P
a
per
|
After fertilizer application the isotopic source signatures are better constrained be-cause of larger diurnal changes in N2O mixing ratios (Fig. 6). Furthermore, much less variation was observed in the isotopic source signatures with values between −0.1±0.8 ‰ to −5.1±1.3 ‰ for SPs and 41.8±0.9 ‰ to 23.2±0.7 ‰ for ∆δ
15
Nbulks .
To calculate the net isotope effect (∆δ15Nbulks =(δ15N(substrate)−δ15Nbulks ), the 15
N 5
content of the fertilizer N analysed by IRMS (δ15N(NH4NO3)=1.3±0.3 ‰) was
ap-plied. The resulting SPsand∆δ15Nbulks values are indicative for N2O production by
het-erotrophic denitrification without or with only minor N2O to N2 reduction (Sutka et al.,
2006; Toyoda et al., 2005). The observed low N2O consumption agrees with a
re-cent publication assuming that the N2O/(N2O+N2) product ratio of denitrification is 10
positively correlated with the NO−
3 availability in soils (Senbayram et al., 2011). The
successive increase in∆δ15Nbulks suggests a shift in the isotope composition of the soil
nitrate pool due to fractionation during denitrification.
4 Conclusions
This study presents to our knowledge the first real-time analysis of N2O site-selective
15
isotopic composition at atmospheric mixing ratios. Our approach is based on a cryo-genic free instrumentation which comprises a mid-IR QCL absorption spectrometer and a fully automated N2O preconcentration unit. During three weeks of continuous
field measurements nearly 550 air samples were analysed for N2O mixing ratios and site-specific isotopic composition. Long term precision forδ15Nαandδ15Nβwas found 20
to be superior to state-of-the-art IRMS. Additionally, precision for N2O mixing ratios
determined by QCLAS was comparable to the standard technique applied in global monitoring networks (GC-ECD).
The excellent analytical precision allowed resolving even small changes in N2O
mixing ratios and isotope composition, δ15Nbulk and SP and calculating daily (24 h 25
AMTD
5, 813–838, 2012Site selective real-time measurements of atmospheric N2O
J. Mohn et al.
Title Page
Abstract Introduction
Conclusions References
Tables Figures
◭ ◮
◭ ◮
Back Close
Full Screen / Esc
Printer-friendly Version Interactive Discussion
Discussion
P
a
per
|
Dis
cussion
P
a
per
|
Discussion
P
a
per
|
Discussio
n
P
a
per
|
a grassland plot. Before fertilizer application,∆δ15Nbulks indicates heterotrophic
denitri-fication as the main N2O production pathway. Co-variation of SPs and∆δ 15
Nbulks can
be attributed to a partial consumption by N2O reductase activity of denitrifying bacteria.
Heterotrophic denitrification remained the main N2O production pathway after fertiliza-tion. However, the N2O reductase activity ceased due to increased NO−
3 availability.
5
As demonstrated in this feasibility study, continuous high precision analysis of N2O
iso-topomers at atmospheric mixing ratios can be applied for identification of N2O source
processes and open a completely new field of applications.
Acknowledgement. We would like to thank Roland Bol (North Wyke Research) for15N analysis of the NH4NO3 fertilizer. Patrick Sturm (Empa) and Pascal Wunderlin (Eawag) are
acknowl-10
edged for helpful discussions during the preparation of the manuscript. Thanks to Mario Lovric for his support during field measurements and Thomas Seitz from the Swiss National Air Pollu-tion Monitoring Network (NABEL) for providing us supporting meteorological parameters. Heike Geilmann (MPI-BGC) is acknowledged for assistance duringδ15Nbulk analysis of primary lab-oratory standards. Funding from the Swiss National Foundation for Scientific Research (SNF)
15
and the State Secretariat for Education and Research (SER) within COST-ES0806 is gratefully acknowledged. Naohiro Yoshida and Sakae Toyoda were supported by KAKENHI (17GS0203 and 23224013) of the Ministry of Education, Culture, Sports, Science and Technology and by Global Environmental Research Fund (A-0904) of the Ministry of the Environment, Japan.
References 20
Avalakki, U. K., Strong, W. M., and Saffigna, P. G.: Measurement of gaseous emissions from denitrification of applied15N. 2. Effects of temperature and added straw, Aust. J. Soil Res., 33, 89–99, doi::10.1071/SR9950089, 1995.
Bailey, L. D. and Beauchamp, E. G.: Effects of temperature on NO−
3and NO
−
2reduction,
nitroge-nous gas production, and redox potential in a saturated soil, Can. J. Soil Sci., 53, 213–218,
25
doi:10.4141/cjss73-032, 1973.
AMTD
5, 813–838, 2012Site selective real-time measurements of atmospheric N2O
J. Mohn et al.
Title Page
Abstract Introduction
Conclusions References
Tables Figures
◭ ◮
◭ ◮
Back Close
Full Screen / Esc
Printer-friendly Version Interactive Discussion
Discussion
P
a
per
|
Dis
cussion
P
a
per
|
Discussion
P
a
per
|
Discussio
n
P
a
per
|
ice core isotope measurements, Atmos. Chem. Phys., 6, 493–503, doi:10.5194/acp-6-493-2006, 2006.
Brenninkmeijer, C. A. M. and R ¨ockmann, T.: Mass spectrometry of the intramolec-ular nitrogen isotope distribution of environmental nitrous oxide using fragment-ion analysis, Rapid Commun. Mass Spectrom., 13, 2028–2033,
doi:10.1002/(SICI)1097-5
0231(19991030)13:20<2028::AID-RCM751>3.0.CO;2-J, 1999.
Coplen, T. B.: Guidelines and recommended terms for expression of stable-isotope-ratio and gas-ratio measurement results, Rapid Commun. Mass Spectrom., 25, 2538–2560, 2011. Corazza, M., Bergamaschi, P., Vermeulen, A. T., Aalto, T., Haszpra, L., Meinhardt, F.,
O’Doherty, S., Thompson, R., Moncrieff, J., Popa, E., Steinbacher, M., Jordan, A.,
Dlugo-10
kencky, E., Br ¨uhl, C., Krol, M., and Dentener, F.: Inverse modelling of European N2O emis-sions: assimilating observations from different networks, Atmos. Chem. Phys., 11, 2381– 2398, doi:10.5194/acp-11-2381-2011, 2011.
Frame, C. H. and Casciotti, K. L.: Biogeochemical controls and isotopic signatures of nitrous oxide production by a marine ammonia-oxidizing bacterium, Biogeosciences, 7, 2695–2709,
15
doi:10.5194/bg-7-2695-2010, 2010.
Gagliardi, G., Borri, S., Tamassia, F., Capasso, F., Gmachl, C., Sivco, D. L., Baillargeon, J. N., Hutchinson, A. L., and Cho, A. Y.: A frequency-modulated quantum-cascade laser for spectroscopy of CH4 and N2O isotopomers, Isot. Environ. Health Stud., 41, 313–321, doi:10.1080/10256010500384572, 2005.
20
Hall, B. D., Dutton, G. S., and Elkins, J. W.: The NOAA nitrous oxide standard scale for atmo-spheric observations, J. Geophys. Res., 112, D09305, doi:10.1029/2006jd007954, 2007. Ishijima, K., Sugawara, S., Kawamura, K., Hashida, G., Morimoto, S., Murayama, S., Aoki, S.,
and Nakazawa, T.: Temporal variations of the atmospheric nitrous oxide concentration and itsδ15N andδ18O for the latter half of the 20th century reconstructed from firn air analyses,
25
J. Geophys. Res., 112, D03305, doi:10.1029/2006JD007208, 2007.
Janssen, C. and Tuzson, B.: A diode laser spectrometer for symmetry selective detection of ozone isotopomers, Appl. Phys. B, 82, 487–494, doi:10.1007/s00340-005-2044-6, 2006. Kaiser, J., R ¨ockmann, T., and Brenninkmeijer, C. A. M.: Complete and accurate mass
spec-trometric isotope analysis of tropospheric nitrous oxide, J. Geophys. Res., 108, 4476,
30
doi:10.1029/2003JD003613, 2003.
Biogeo-AMTD
5, 813–838, 2012Site selective real-time measurements of atmospheric N2O
J. Mohn et al.
Title Page
Abstract Introduction
Conclusions References
Tables Figures
◭ ◮
◭ ◮
Back Close
Full Screen / Esc
Printer-friendly Version Interactive Discussion
Discussion
P
a
per
|
Dis
cussion
P
a
per
|
Discussion
P
a
per
|
Discussio
n
P
a
per
|
chemistry of nitrous oxide in groundwater in a forested ecosystem elucidated by ni-trous oxide isotopomer measurements, Geochim. Cosmochim. Acta, 73, 3115–3133, doi:10.1016/j.gca.2009.03.022, 2009.
Makarov, M. I., Leoshkina, N. A., Ermak, A. A., and Malysheva, T. I.: Seasonal dynamics of the mineral nitrogen forms in mountain-meadow alpine soils, Eur. Soil Sci., 43, 905–913,
5
doi:10.1134/s1064229310080077, 2010.
McManus, J. B., Nelson, D. D., and Zahniser, M. S.: Long-term continuous sampling of12CO2,
13
CO2and12C18O16O in ambient air with a quantum cascade laser spectrometer, Isot. Envi-ron. Health Stud., 46, 49–63, doi:10.1080/10256011003661326, 2010.
Miller, B. R., Weiss, R. F., Salameh, P. K., Tanhua, T., Greally, B. R., M ¨uhle, J., and
Sim-10
monds, P. G.: Medusa: a sample preconcentration and GC/MS detector system for in situ measurements of atmospheric trace halocarbons, hydrocarbons, and sulfur compounds, Anal. Chem., 80, 1536–1545, doi:10.1021/ac702084k, 2008.
Mohn, J., Zeeman, M. J., Werner, R. A., Eugster, W., and Emmenegger, L.: Continuous field measurements of δ13C-CO2 and trace gases by FTIR spectroscopy, Isot. Environ. Health
15
Stud., 44, 241–251, doi:10.1080/10256010802309731, 2008.
Mohn, J., Guggenheim, C., Tuzson, B., Vollmer, M. K., Toyoda, S., Yoshida, N., and Emmeneg-ger, L.: A liquid nitrogen-free preconcentration unit for measurements of ambient N2O iso-topomers by QCLAS, Atmos. Meas. Tech., 3, 609–618, doi:10.5194/amt-3-609-2010, 2010. Montzka, S. A., Reimann, S., Engel, A., Kr ¨uger, K., O’Doherty, S., Sturges, W. T., Blake, D.,
20
Dorf, M., Fraser, P., Froidevaux, L., Jucks, K., Kreher, K., Kurylo, M. J., Mellouki, A., Miller, J., Nielsen, O.-J., Orkin, V. L., Prinn, R. G., Rhew, R., Santee, M. L., Stohl, A., and Verdonik, D.: Ozone-depleting substances (ODSs) and related chemicals, Chapter 1, in: Scientific Assess-ment of Ozone Depletion: 2010, Global Ozone Research and Monitoring Project, Report No. 52, edited by: Ennis, C. A., World Meteorological Organization, Geneva, 516, 2011.
25
Nakayama, T., Fukuda, H., Kamikawa, T., Sugita, A., Kawasaki, M., Morino, I., and Inoue, G.: Measurements of the 3ν3 band of 14N15N16O and 15N14N16O using continuous-wave cav-ity ring-down spectroscopy, Appl. Phys. B, 88, 137–140, doi:10.1007/s00340-007-2653-3, 2007.
Ostrom, N. E., Pitt, A., Sutka, R., Ostrom, P. H., Grandy, A. S., Huizinga, K. M., and
Robert-30
son, G. P.: Isotopologue effects during N2O reduction in soils and in pure cultures of denitri-fiers, J. Geophys. Res., 112, G02005, doi:10.1029/2006JG000287, 2007.
Fis-AMTD
5, 813–838, 2012Site selective real-time measurements of atmospheric N2O
J. Mohn et al.
Title Page
Abstract Introduction
Conclusions References
Tables Figures
◭ ◮
◭ ◮
Back Close
Full Screen / Esc
Printer-friendly Version Interactive Discussion
Discussion
P
a
per
|
Dis
cussion
P
a
per
|
Discussion
P
a
per
|
Discussio
n
P
a
per
|
cher, J. C., and Robertson, G. P.: Isotopologue data reveal bacterial denitrification as the primary source of N2O during a high flux event following cultivation of a native temperate grassland, Soil Biol. Biochem., 42, 499–506, doi:10.1016/j.soilbio.2009.12.003, 2010. Park, S., Atlas, E. L., and Boering, K. A.: Measurements of N2O isotopologues in the
strato-sphere: Influence of transport on the apparent enrichment factors and the isotopologue
5
fluxes to the troposphere, J. Geophys. Res., 109, D01305, doi:10.1029/2003JD003731, 2004.
Ravishankara, A. R., Daniel, J. S., and Portmann, R. W.: Nitrous oxide (N2O): The dom-inant ozone-depleting substance emitted in the 21st century, Science, 326, 123–125, doi:10.1126/science.1176985, 2009.
10
R ¨ockmann, T. and Levin, I.: High-precision determination of the changing isotopic com-position of atmospheric N2O from 1990 to 2002, J. Geophys. Res., 110, D21304, doi:10.1029/2005JD006066, 2005.
Schmidt, H. L., Werner, R. A., Yoshida, N., and Well, R.: Is the isotopic composition of nitrous oxide an indicator for its origin from nitrification or denitrification? A theoretical approach
15
from referred data and microbiological and enzyme kinetic aspects, Rapid Commun. Mass Spectrom., 18, 2036–2040, doi:10.1002/rcm.1586, 2004.
Senbayram, M., Chen, R., Budai, A., Bakken, L., and Dittert, K.: N2O emission and the N2O/(N2O + N2) product ratio of denitrification as controlled by available carbon substrates and nitrate concentrations, Agric. Ecosyst. Environ., 147, 4–12,
20
doi:10.1016/j.agee.2011.06.022, 2011.
Solomon, S., Qin, D., Manning, M., Alley, R. B., Berntsen, T., Bindoff, N. L., Chen, Z., Chidthaisong, A., Gregory, J. M., Hegerl, G. C., Heimann, M., Hewitson, B., Hoskins, B. J., Joos, F., Jouzel, J., Kattsov, V., Lohmann, U., Matsuno, T., Molina, M., Nicholls, N., Over-peck, J., Raga, G., Ramaswamy, V., Ren, J., Rusticucci, M., Somerville, R., Stocker, T. F.,
25
Whetton, P., Wood, R. A., and Wratt, D.: Technical Summary, in: Climate Change 2007: The Physical Science Basis. Contribution of Working Group I to the Fourth Assessment Re-port of the Intergovernmental Panel on Climate Change, edited by: Solomon, S., Qin, D., Manning, M., Chen, Z., Marquis, M., Averyt, K. B., Tignor, M., and Miller, H. L., Cambridge University Press, Cambridge, UK and New York, 91, 2007.
30
doi:10.1128/AEM.72.1.638-AMTD
5, 813–838, 2012Site selective real-time measurements of atmospheric N2O
J. Mohn et al.
Title Page
Abstract Introduction
Conclusions References
Tables Figures
◭ ◮
◭ ◮
Back Close
Full Screen / Esc
Printer-friendly Version Interactive Discussion
Discussion
P
a
per
|
Dis
cussion
P
a
per
|
Discussion
P
a
per
|
Discussio
n
P
a
per
|
644.2006, 2006.
Toyoda, S. and Yoshida, N.: Determination of nitrogen isotopomers of nitrous oxide on a modi-fied isotope ratio mass spectrometer, Anal. Chem., 71, 4711–4718, doi:10.1021/ac9904563, 1999.
Toyoda, S., Yoshida, N., Miwa, T., Matsui, Y., Yamagishi, H., Tsunogai, U., Nojiri, Y., and
Tsu-5
rushima, N.: Production mechanism and global budget of N2O inferred from its isotopomers in the Western North Pacific, Geophys. Res. Lett., 29, 1037, doi:10.1029/2001GL014311, 2002.
Toyoda, S., Yoshida, N., Urabe, T., Nakayama, Y., Suzuki, T., Tsuji, K., Shibuya, K., Aoki, S., Nakazawa, T., Ishidoya, S., Ishijima, K., Sugawara, S., Machida, T., Hashida, G.,
Mori-10
moto, S., and Honda, H.: Temporal and latitudinal distributions of stratospheric N2O iso-topomers, J. Geophys. Res., 109, D08308, doi:10.1029/2003JD004316, 2004.
Toyoda, S., Mutobe, H., Yamagishi, H., Yoshida, N., and Tanji, Y.: Fractionation of N2O isotopomers during production by denitrifier, Soil Biol. Biochem., 37, 1535–1545, doi:10.1016/j.soilbio.2005.01.009, 2005.
15
Toyoda, S., Suzuki, Y., Hattori, S., Yamada, K., Fujii, A., Yoshida, N., Kouno, R., Murayama, K., and Shiomi, H.: Isotopomer analysis of production and consumption mechanisms of N2O and CH4in an advanced wastewater treatment system, Environ. Sci. Technol., 45, 917–922, doi:10.1021/es102985u, 2011a.
Toyoda, S., Yano, M., Nishimura, S., Akiyama, H., Hayakawa, A., Koba, K., Sudo, S., Yagi, K.,
20
Makabe, A., Tobari, Y., Ogawa, N. O., Ohkouchi, N., Yamada, K., and Yoshida, N.: Character-ization and production and consumption processes of N2O emitted from temperate agricul-tural soils determined via isotopomer ratio analysis, Global Biogeochem. Cy., 25, GB2008, doi:10.1029/2009GB003769, 2011b.
Tuzson, B., Henne, S., Brunner, D., Steinbacher, M., Mohn, J., Buchmann, B., and
Emmeneg-25
ger, L.: Continuous isotopic composition measurements of tropospheric CO2 at Jungfrau-joch (3580 m a.s.l.), Switzerland: Real-time observation of regional pollution events, Atmos. Chem. Phys., 11, 1685–1696, doi:10.5194/acp-11-1685-2011, 2011.
Uehara, K., Yamamoto, K., Kikugawa, T., and Yoshida, N.: Isotope analysis of environmen-tal substances by a new laser-spectroscopic method utilizing different pathlengths, Sens.
30
Actuators B, 74, 173–178, doi:10.1016/S0925-4005(00)00729-2, 2001.
AMTD
5, 813–838, 2012Site selective real-time measurements of atmospheric N2O
J. Mohn et al.
Title Page
Abstract Introduction
Conclusions References
Tables Figures
◭ ◮
◭ ◮
Back Close
Full Screen / Esc
Printer-friendly Version Interactive Discussion
Discussion
P
a
per
|
Dis
cussion
P
a
per
|
Discussion
P
a
per
|
Discussio
n
P
a
per
|
doi:10.1016/S1386-1425(02)00260-3, 2003.
W ¨achter, H. and Sigrist, M. W.: Mid-infrared laser spectroscopic determination of isotope ratios of N2O at trace levels using wavelength modulation and balanced path length detection, Appl. Phys. B, 87, 539–546, doi:10.1007/s00340-007-2576-z, 2007.
W ¨achter, H., Mohn, J., Tuzson, B., Emmenegger, L., and Sigrist, M. W.: Determination of N2O
5
isotopomers with quantum cascade laser based absorption spectroscopy, Opt. Express, 16, 9239–9244, doi:10.1364/OE.16.009239, 2008.
Well, R., Flessa, H., Xing, L., Xiaotang, J., and R ¨omheld, V.: Isotopologue ratios of N2O emitted from microcosms with NH+4 fertilized arable soils under conditions favoring nitrification, Soil Biol. Biochem., 40, 2416–2426, doi:10.1016/j.soilbio.2008.06.003, 2008.
10
Well, R., and Flessa, H.: Isotopologue signatures of N2O produced by denitrification in soils, J. Geophys. Res., 114, G02020, doi:10.1029/2008JG000804, 2009.
Werle, P.: Accuracy and precision of laser spectrometers for trace gas sensing in the presence of optical fringes and atmospheric turbulence, Appl. Phys. B, 102, 313–329, doi:10.1007/s00340-010-4165-9, 2011.
15
Werner, R. A., Bruch, B. A., and Brand, W. A.: ConFlo III – an interface for high precision
δ13C andδ15N analysis with an extended dynamic range, Rapid Commun. Mass Spectrom., 13, 1237–1241, doi:10.1002/(sici)1097-0231(19990715)13:13<1237::aid-rcm633> 3.0.co;2-c, 1999.
Yamagishi, H., Westley, M. B., Popp, B. N., Toyoda, S., Yoshida, N., Watanabe, S., Koba, K.,
20
and Yamanaka, Y.: Role of nitrification and denitrification on the nitrous oxide cycle in the eastern tropical North Pacific and Gulf of California, J. Geophys. Res., 112, G02015, doi:10.1029/2006JG000227, 2007.
Yoshida, N.: 15N-depleted N2O as a product of nitrification, Nature, 335, 528–529, doi:10.1038/335528a0, 1988.
25
AMTD
5, 813–838, 2012Site selective real-time measurements of atmospheric N2O
J. Mohn et al.
Title Page
Abstract Introduction
Conclusions References
Tables Figures
◭ ◮
◭ ◮
Back Close
Full Screen / Esc
Printer-friendly Version Interactive Discussion
Discussion
P
a
per
|
Dis
cussion
P
a
per
|
Discussion
P
a
per
|
Discussio
n
P
a
per
|
Table 1. N2O mixing ratios and relative differences of isotopic ratios δ15Nα and δ15Nβ of
secondary laboratory standards applied in the current project (the precision indicated is the standard error of the mean). Standard Ia was replaced by standard Ib 22 September.
AMTD
5, 813–838, 2012Site selective real-time measurements of atmospheric N2O
J. Mohn et al.
Title Page
Abstract Introduction
Conclusions References
Tables Figures
◭ ◮
◭ ◮
Back Close
Full Screen / Esc
Printer-friendly Version Interactive Discussion
Discussion
P
a
per
|
Dis
cussion
P
a
per
|
Discussion
P
a
per
|
Discussio
n
P
a
per
|
QCLAS
Preconcen-tration
P
pressu
r.
air
N2
/O
2
s
ta
ndar
d
gas I sta
ndar
d
gas II
Permeation dryer
Mg(ClO4)2 Ascarite pressure
relief
N2
/O
2
pump vacuum
pump flow
adjustment air intake
MFC Permeation
dryer
Mg(ClO4)2 Ascarite
V1 V2 V3
V4
V5,6
Fig. 1. Experimental setup for on-line N2O isotopomer analysis in ambient air. Vi are solenoid
AMTD
5, 813–838, 2012Site selective real-time measurements of atmospheric N2O
J. Mohn et al.
Title Page
Abstract Introduction
Conclusions References
Tables Figures
◭ ◮
◭ ◮
Back Close
Full Screen / Esc
Printer-friendly Version Interactive Discussion
Discussion
P
a
per
|
Dis
cussion
P
a
per
|
Discussion
P
a
per
|
Discussio
n
P
a
per
|
gas
analy
z
ed by
QCLAS
400 300
200 100
0
time [min] std I-1 (71 ppm N2O)
std I-2 (88 ppm N2O)
std II (72 ppm N2O)
precon. ambient air
precon. pressurized air (A) (C)
(B)
(D)
Fig. 2. Measurement cycle: (A)+(C)analysis of ambient air or pressurized air (target gas),
AMTD
5, 813–838, 2012Site selective real-time measurements of atmospheric N2O
J. Mohn et al.
Title Page
Abstract Introduction
Conclusions References
Tables Figures
◭ ◮
◭ ◮
Back Close
Full Screen / Esc
Printer-friendly Version Interactive Discussion
Discussion
P
a
per
|
Dis
cussion
P
a
per
|
Discussion
P
a
per
|
Discussio
n
P
a
per
|
480
440
400
360
320 N2
O [ppb]
10.09.2010 15.09.2010 20.09.2010 25.09.2010 30.09.2010
date & time 8
4
0
-4
15
N
bu
lk [‰]
20
18
16
14
12
SP [
‰
]
fertilization 340
330 320
10.09.2010 12.09.2010 14.09.2010 20
19 18 9 7 5
15
Nbulk [‰]
SP [‰]
N2O [ppb]
Fig. 3. Time series of N2O mixing ratio and the correspondingδ15Nbulkand SP values of
AMTD
5, 813–838, 2012Site selective real-time measurements of atmospheric N2O
J. Mohn et al.
Title Page
Abstract Introduction
Conclusions References
Tables Figures
◭ ◮
◭ ◮
Back Close
Full Screen / Esc
Printer-friendly Version Interactive Discussion
Discussion
P
a
per
|
Dis
cussion
P
a
per
|
Discussion
P
a
per
|
Discussio
n
P
a
per
|
40
30
20
10
0
Nr. of bins
328.0 327.0 326.0 325.0
N2O [ppb]
N2O = 326.47 ± 0.36 ppb
40
30
20
10
0
Nr. of bins
16.0 15.5 15.0 14.5
15
N [‰]
15
N = 15.28 ± 0.24 ‰
40
30
20
10
0
Nr. of bins
-3.6 -3.2 -2.8 -2.4
15
N [‰]
15
N = -2.91 ± 0.17 ‰
Fig. 4. Repeated measurements of pressurized air (target gas) during the field experiment.
AMTD
5, 813–838, 2012Site selective real-time measurements of atmospheric N2O
J. Mohn et al.
Title Page
Abstract Introduction
Conclusions References
Tables Figures
◭ ◮
◭ ◮
Back Close
Full Screen / Esc
Printer-friendly Version Interactive Discussion
Discussion
P
a
per
|
Dis
cussion
P
a
per
|
Discussion
P
a
per
|
Discussio
n
P
a
per
|
7
6
5
4
3
2
15
N
bulk
[‰]
3.1x10⁻³ 3.0
2.9 2.8 2.7
1/N2O [ppb -1
]
15
Nbulk = (-40.5 ± 0.9) + (15220 ± 314) x 1/N2O
19.0
18.5
18.0
17.5
17.0
16.5
16.0
SP [‰]
3.1x10⁻³ 3.0
2.9 2.8 2.7
1/N2O [ppb -1
]
SP = (-3.5 ± 1.2) + (7147 ± 389) x 1/N2O
Fig. 5. Exemplary 24 h Keeling plot (23 September noon–24 September 2010 noon) after
fertilizer addition. Site preference andδ15Nbulkare plotted vs. the inverse of the N2O concen-tration. The intercept of the ordinary least square linear regression corresponds to the isotopic signature of the main N2O emitting process (δ15Nbulks , SPs) and is given together with its 1σ
AMTD
5, 813–838, 2012Site selective real-time measurements of atmospheric N2O
J. Mohn et al.
Title Page
Abstract Introduction
Conclusions References
Tables Figures
◭ ◮
◭ ◮
Back Close
Full Screen / Esc
Printer-friendly Version Interactive Discussion
Discussion
P
a
per
|
Dis
cussion
P
a
per
|
Discussion
P
a
per
|
Discussio
n
P
a
per
|
40
30
20
10
0
-10
-20
SP
s
[‰]
60 40
20 0
-20
15
Nbulks = 15
N (substrate) - 15Nbulks [‰]
SPs / 15
Nbulks = 1.18 ± 0.32
Fig. 6. SPs vs.∆δ15Nbulks plot to interpret the biogeochemistry of soil emitted N2O. Isotopic