www.atmos-meas-tech.net/2/193/2009/
© Author(s) 2009. This work is distributed under the Creative Commons Attribution 3.0 License.
Measurement
Techniques
Chlorine activation by N
2
O
5
: simultaneous, in situ detection of
ClNO
2
and N
2
O
5
by chemical ionization mass spectrometry
J. P. Kercher1, T. P. Riedel1,2, and J. A. Thornton1
1Department of Atmospheric Sciences, University of Washington, Seattle, WA 98195, USA 2Department of Chemistry, University of Washington, Seattle, WA 98195, USA
Received: 2 December 2008 – Published in Atmos. Meas. Tech. Discuss.: 14 January 2009 Revised: 21 April 2009 – Accepted: 17 May 2009 – Published: 26 May 2009
Abstract. We report a new method for the simultaneous in situ detection of nitryl chloride (ClNO2) and dinitrogen pen-toxide (N2O5)using chemical ionization mass spectrometry (CIMS). The technique relies on the formation and detection of iodide ion-molecule clusters, I(ClNO2)− and I(N2O5)−. The novel N2O5detection scheme is direct. It does not suf-fer from high and variable chemical intersuf-ferences, which are associated with the typical method of nitrate anion detec-tion. We address the role of water vapor, CDC electric field strength, and instrument zero determinations, which influ-ence the overall sensitivity and detection limit of this method. For both species, the method demonstrates high sensitivity (>1 Hz/pptv), precision (∼10% for 100 pptv in 1 s), and ac-curacy (∼20%), the latter ultimately determined by the nitro-gen dioxide (NO2) cylinder calibration standard and charac-terization of inlet effects. For the typically low background signals (<10 Hz) and high selectivity, we estimate signal-to-noise (S/N) ratios of 2 for 1 pptv in 60 s averages, but uncer-tainty associated with the instrumental zero currently leads to an ultimate detection limit of∼5 pptv for both species. We validate our approach for the simultaneous in situ measure-ment of ClNO2and N2O5while on board theR/V Knorr as part of the ICEALOT 2008 Field Campaign.
1 Introduction
Human activities of industry, transportation, and agri-culture account for ∼75% of global nitrogen oxide (NOx≡NO+NO2) emissions, and these emissions are ex-pected to be double the 1990 values in about a decade (van
Correspondence to:J. A. Thornton ([email protected])
Aardenne et al., 1999; Yienger, 1999). NOxplays a funda-mental role in the troposphere’s oxidizing capacity by regu-lating photochemical ozone production rates, and by partly controlling hydrogen oxide (HOx≡OH+HO2) and halogen oxide radical cycles (Logan, 1981). The regional and global scale impacts of anthropogenic NOxemissions ultimately de-pend on its atmospheric lifetime, which is primarily con-trolled by nitric acid (HNO3)formation during the daytime,
NO2+OH+M→HNO3+M (R1)
and by homogeneous and heterogeneous reactions of the ni-trate radical (NO3)and dinitrogen pentoxide (N2O5)at night (Reactions R2–R7).
NO2+O3→NO3+O2 (R2)
NO2+NO3⇄N2O5 (R3)
NO3+VOC→products (R4)
NO3+particles→products (R5)
N2O5+particles−→H2O 2HNO3 (R6)
N2O5+particles H+,Cl−
aq
−→ ClNO2+HNO3 (R7)
1994; Wayne et al., 1991). The branching between various pathways is strongly dependent on temperature, NOx, hy-drocarbons, particle composition, and vertical mixing (Ayers and Simpson, 2006; Brown et al., 2007; Stutz et al., 2004); as such, several aspects of this chemistry remain uncertain.
Laboratory studies have conclusively shown that the re-action of N2O5on chloride containing solutions and solids yields nitryl chloride (ClNO2), a photo-labile chlorine atom source (Behnke et al., 1997; Finlayson-Pitts et al., 1989; Thornton and Abbatt, 2005). The relative branching between Reactions (R6) and (R7) for use in atmospheric chemistry models has essentially remained unconstrained due to a lack of in situ observations of ClNO2. ClNO2 is fairly unreac-tive at night such that given sustained production via Reac-tion (R7), its concentraReac-tion can increase throughout night-time. A recent theoretical study predicted ClNO2mixing ra-tios of up to 50 parts per trillion by volume (pptv) in polluted regions (e.g. the Long Island Sound) (Pechtl and von Glasow, 2007).
During the daytime, ClNO2undergoes photolysis by UV-VIS radiation to generate chlorine atoms and NO2 with a clear-sky lifetime of order 30–60 min depending on season and location.
ClNO2+hν→Cl+NO2 (R8)
The importance of the reaction sequence (R7–R8) is two-fold. First, in a NOx-laden air mass, the photodissociation of ClNO2 can initiate photochemical ozone production earlier than would otherwise occur, ultimately increasing the inte-gral amount of ozone produced. This effect is due to the fact that Reaction (R8) goes to completion within an hour or two after sunrise, liberating chlorine atoms which react with hydrocarbons up to 10–100 times faster than does the hy-droxyl radical (OH). While Cl-atoms have not been directly observed, labile sources in addition to ClNO2, such as Cl2, have been observed (Spicer et al., 1998). Regionally aver-aged Cl abundances have been inferred from observational analyses of hydrocarbons (Arsene et al., 2007; Cavender et al., 2008), but due to the limited spatial and temporal cover-age of such measurements, the global Cl-atom source term remains largely unconstrained (Platt et al., 2004). Second, since ClNO2is not a terminal NOxsink, production via N2O5 heterogeneous reaction represents a reduction, by as much as 50%, in the amount of NOx removed during night by NO3 and N2O5chemistry, effectively enhancing the NOx-lifetime because Reaction (R8) ultimately returns one NOx.
Tropospheric N2O5mixing ratios can vary from less than 10 pptv to above 1000 pptv (Aldener et al., 2006; Ayers and Simpson, 2003, 2006). The tropospheric N2O5 abundance was first inferred from long-path differential optical absorp-tion spectroscopy (DOAS) measurements of NO3 together with measurements of NO2 and an assumption that NO3, NO2and N2O5are related by the equilibrium shown in Re-action (R3) (Heintz et al., 1996; Smith et al., 1995; Stutz et al., 2004). Recently, multiple groups have demonstrated
a difference method for in situ N2O5 observations, where N2O5 is thermally decomposed to NO3, which is then de-tected by cavity ring-down spectroscopy (CaRDS) or laser-induced fluorescence (Geyer et al., 1999; Simpson, 2003; Wood et al., 2003). The contribution of ambient NO3, which is generally small, is subtracted from the total signal mea-sured after N2O5thermal decomposition. The sum of N2O5 and NO3can also be measured as the nitrate anion, NO−3, by chemical ionization mass spectrometry (CIMS) using the io-dide reagent ion (I−). Indeed, this particular CIMS approach has been employed in numerous laboratory studies (Huey et al., 1995; Thornton et al., 2003) and has been demonstrated as a potential in situ method for N2O5detection (Huey, 2007; Slusher et al., 2004).
Recently, we showed that ClNO2could be sensitively and selectively detected by I−CIMS (McNeill et al., 2006),
lead-ing to the first in situ detection of ClNO2 in the polluted Gulf of Mexico (Osthoff et al., 2008). Here, we describe this technique further, and demonstrate a new method that allows the detection of both N2O5and ClNO2at pptv mix-ing ratios usmix-ing the same instrument. We illustrate the in-strument’s performance during the initial phase of the In-ternational Chemistry Experiment in the Arctic Lower Tro-posphere (ICEALOT), a recent ship-based research cruise that took place March–April 2008. The unique aspects of this method include a combination of high sensitivity (∼1 Hz pptv−1), low background noise (<10 Hz), and chem-ical selectivity for both ClNO2and N2O5. The N2O5 mea-surement is direct, i.e. the signal does not include contribu-tions from NO3, and it does not suffer from high and vari-able chemical interferences which affect the NO−3-based de-tection method. Essentially, the method provides the abil-ity to simultaneously monitor both the reactant (N2O5)and product (ClNO2)of an atmospheric heterogeneous process, in situ, with a fixed relative calibration.
2 Instrument description
2.1 Ion Molecule Reaction Region (IMR)
Ambient air, sampled by a rotary vane pump, passes through a critical orifice into a 4 cm OD electrically isolated stainless steel flow tube that serves as the IMR region. The orifice and vacuum pump maintain a constant volumetric flow rate of 2 standard liters per minute (slpm) through the sampling orifice, and a pressure of 60 torr. A commercial210Po ra-dioactive ion source (alpha-emitter, 10 mCu), oriented per-pendicular to the main sample flow axis, is located along the reaction flow tube∼1 cm downstream of the sampling ori-fice. Iodide anions (I−)are introduced to the sample stream by passing a 2.5 slpm flow of ultra high purity (UHP) N2that contains a trace amount of methyl iodide (CH3I) through the 210Po ion source. Neutral molecules in air react with iodide anions for∼70 ms before exiting the IMR region.
2.2 Collisional Dissociation Chamber (CDC)
A fraction (∼10%) of the ion-molecule reaction mixture is sampled from the IMR into the collsional declustering re-gion (CDC) by means of a second orifice biased to−65 V relative to ground. A 7 liter per second (lps) molecular drag pump is used to drop the pressure from 60 torr in the IMR to 1.5 torr in the CDC. The CDC is comprised of a series of 4 static lenses. The lenses are 2 mm thick, 4 cm OD, 1 cm ID, stainless steel discs that are spaced 6 mm from each other, and from the two orifice plates, which serve as the entrance and exit to/from the CDC. The front pair of lenses are bi-ased to −45 V and the rear pair are biased to −25 V. The third orifice plate, which separates the CDC from the high vacuum chamber, is biased to−5.1 V to create a net electric field of−20 V/cm at 1.5 torr. This field strength is less than that typically used by our group and others to detect acyl per-oxy nitrates by I−CIMS (Wolfe et al., 2007). As discussed below, this lower field strength allows for the simultaneous detection of N2O5and ClNO2.
2.3 Octupole ion guide
Ions are focused through the CDC orifice plate into the fore chamber of a differentially pumped stainless steel high vac-uum region. The fore chamber, pumped by a 250 lps turbo-molecular pump, is maintained at 3 mtorr. Ions are focused into a narrow beam and transmitted into the quadrupole re-gion by a custom RF-only octupole ion guide. The 4 cm long, 2 cm OD octupole ion guide, based on the designs of D. J. Tanner et al. (personal communication, 2004) at Geor-gia Tech., is driven by a compact RF-only power supply (2.2 MHz, 220 V p-p) designed at the University of Washing-ton. The octupole is mounted on a fourth, and final orifice plate, which drops the pressure from 3 mtorr to 2×10⁻⁵torr by means of a second 250 lps turbomolecular pump. The ion beam is focused through the orifice into the quadrupole mass selector. The two turbomolecular pumps are backed
IMR CDC
Octupole Ion Guide
Quadrupole Mass Selector Detection IMR
CDC Octupole Ion Guide
Quadrupole Mass Selector Detection
210Po
a
b c d
e f Virtual Impactor CIMS IMR CDC Octupole Ion Guide
Quadrupole Mass Selector Detection IMR
CDC Octupole Ion Guide
Quadrupole Mass Selector Detection
210Po
a
b c d
e f IMR CDC Octupole Ion Guide
Quadrupole Mass Selector Detection IMR
CDC Octupole Ion Guide
Quadrupole Mass Selector Detection IMR
CDC Octupole Ion Guide
Quadrupole Mass Selector Detection IMR
CDC Octupole Ion Guide
Quadrupole Mass Selector Detection
210Po
a
b c d
e f a
b c d
e f Virtual Impactor CIMS ≡ ≡
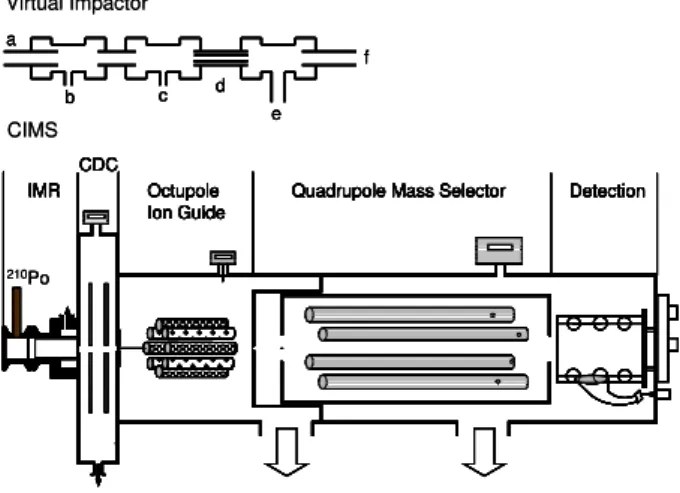
Fig. 1. Schematic of the virtual impactor and University of Wash-ington Chemical Ionization Mass Spectrometer used while in Boul-der, CO and on board theR/V Knorr. The virtual impactor consists of a 1 cm long, 6 mm OD inlet(a), N2O5(b)and NO(c)addition
ports, a 3 mm OD constriction(d), 12 m of 6 mm OD sampling line to the CIMS(e)and a bypass pumping line(f). The CIMS con-sists of an IMR≡(ion molecule region) which houses the 210 Po radiaoactive ion source, a CDC≡collisional dissociation chamber, an octupole ion guide, a quadrupole mass selector and an electron multiplier.
by molecular drag pumps, in turn backed by the same ro-tary vane pump which maintains the IMR region pressure and flows.
2.4 Quadrupole Mass Selection (QMS) and detection
Ions transmitted through the final orifice are mass selected using a quadrupole mass selector (QMS) from Extrel Inc. housed in a high vacuum region held at 2×10⁻⁵torr. The quadrupole has 19 mm OD rods equipped with RF-only pre and post filters, and is driven by a 300 W, 1.2 MHz RF/DC power supply. The quadrupole rods are housed in a per-forated stainless steel tube capped with entrance and exit lenses, and are followed by an off-axis electron multiplier detector with dynode from Extrel Inc. An MTS-100 preamp is used to convert the output pulses of the multiplier into TTL. The multiplier, preamp, and ion optics, including ori-fice plates and CDC lenses, are powered or biased using pre-packaged Extrel Inc. power supplies.
2.5 Instrument control and data acquisition
Fig. 2. UW-CIMS ion time trace showing the evolution of the ICl−(solid grey circles), I(ClNO2)−(open grey circles), I(N2O5)−
(open black triangles) and NO−3 (solid black triangles) anions when sampling a trace amount (750 pptv) of N2O5. The boxed regions
highlight sampling periods during which the N2O5 flow was
ex-posed to a wet NaCl salt bed prior to sampling by the UW-CIMS.
voltage to the RF/DC quadrupole power supply, counting the TTL preamp output for a set period perm/z, typically 80– 250 ms, then moving to the next m/z. Depending on the number of individualm/zto monitor, this scheme leads to sampling frequencies ranging from 0.2 to 3 Hz perm/z.
2.6 Ion chemistry
Neglecting the role of water vapor in the ion-molecule re-action region, the ion chemistry for the detection of both N2O5 and ClNO2 proceeds through two channels: disso-ciative charge transfer (Reactions R9 and R12) and cluster formation (Reactions R11 and R13). With the exception of Reaction (R11), the reaction channels described below have been demonstrated and used previously, primarily for labo-ratory studies (Huey, 2007; McNeill et al., 2006; Thornton et al., 2003).
I−+N2O5→NO−3 +INO2 (R9)
I−+NO3→NO−3 +I (R10)
I−+N2O5→I(N2O5)− (R11)
I−+ClNO2→ICl−+INO2 (R12)
I−+ClNO2→I(ClNO2)− (R13)
Figure 2 shows a sample ion time trace obtained in the laboratory for the four products discussed above, under sam-pling conditions which have been optimized for the detection of the cluster anions. Initially, N2O5(750 pptv) in a 2.5 slpm flow of dry N2was sampled directly into the UW-CIMS. The
50 100 150 200 250
0.0 5.0x10² 1.0x10³
IN2O5
-IClNO2
-ICl -I(H2O)
-I
-NO3
-1.0x 10⁷
CIMS
Signal (Hz)
m/z (amu)
− −
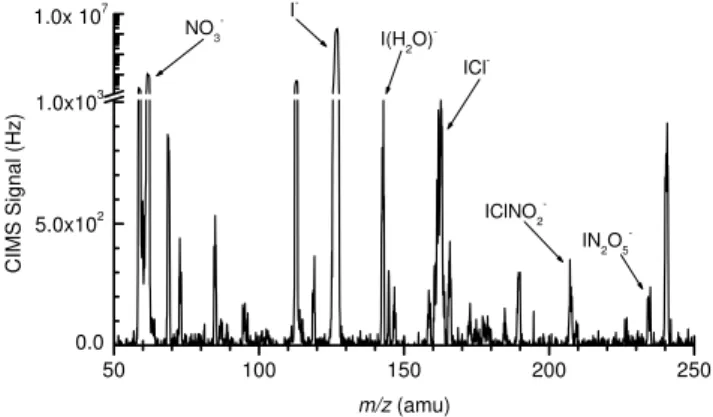
Fig. 3. A sample mass spectrum, taken the night of 18 March 2009 while in port at Woods Hole Oceanographic Institute (WHOI). ClNO2and N2O5mixing ratios were 200 and 250 ppt, respectively.
All four product ions are present in addition to the two most impor-tant reagent ions, I−and I(H2O)−.
NO−3 and I(N2O5)−anions are observed in a 3:1 ratio. The boxed regions highlight the times when the N2O5flow passed over a wet sodium chloride (NaCl) salt bed prior to sam-pling by the UW-CIMS. In addition to NO−3 and I(N2O5)−, ICl− and I(ClNO2)−are observed during these times, with the cluster anion representing 80% of the total nitryl chlo-ride signal. Figure 3 shows a full mass spectrum, taken at Woods Hole Oceanographic Institute (WHOI) on the night of 18 March 2009. The spectrum shows all four product ions as well as the important reagent ions, I− and I(H2O)−. In this case, the reactive charge transfer anions are the dominant species for both N2O5and ClNO2, due to the dry sampling conditions and high CDC electric field of−60 V/cm. ClNO2 and N2O5mixing ratios were 200 and 250 ppt, respectively. The factors governing the observed branching between re-active charge transfer and cluster formation for both ClNO2 and N2O5are discussed below.
3 Sensitivity and selectivity
3.1 Calibrations
(Hz/pptv) of N2O5or ClNO2sampled, that is then interpo-lated onto the measurement time base and used to convert instantaneous count rates into absolute mixing ratios.
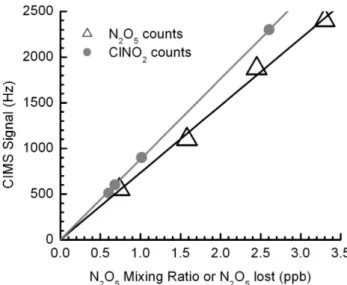
Well-quantified, highly reproducible, and commercially available sources of N2O5and ClNO2do not exist. We use a combination of generation and quantification methods to de-velop confidence in the calibration sources we apply in the field. During ICEALOT 2008, N2O5 was delivered to the sampling inlet for calibration purposes, one to two times per day, by passing a small flow of N2 over pure, solid N2O5 maintained at 200 K. Two types of additions were performed: one while overflowing the inlet with dry zero air, and one by adding the N2O5 directly to moist ambient air. In gen-eral, calibrations were conducted between 01:00–04:00 p.m. local time. This time was chosen to insure that the atmo-spheric N2O5 and ClNO2 signals had decayed completely in the morning hours but also to allow ample time for the inlet cleaning and replacement before sunset. The NOAA CaRDS instrument, sampling from the same inlet manifold as the UW-CIMS, used these additions primarily to assess inlet transmission. For the purpose of this campaign, a goal of which was to test our N2O5 detection capability, we re-lied on the NOAA CaRDS instrument to determine the N2O5 concentration being delivered to the UW-CIMS inlet during these calibrations. We then used this known N2O5 concentra-tion, typically a single value between 1–5 ppbv, to generate aCf for the UW-CIMS based on the observed signal at the I(N2O5)−m/z. Figure 4 shows the resulting plots of signal (Hz) versus N2O5mixing ratio sampled in relatively dry air (RH∼20%). The slope of linear least squares fit to the data yield a calibration factor of 0.75 Hz/pptv. An example of a calibration performed during the deployment is shown and discussed in the section on field performance.
We calibrate to ClNO2by passing a known mixing ratio of N2O5in either a relatively dry N2flow or ambient air over a wet NaCl bed, which is dispersed along the inner walls of a 20 cm length of 13 mm OD tubing. The mixing ratio of ClNO2 eluting from the salt bed is calculated from the observed amount of N2O5lost when passing through the salt bed and the known ClNO2 yield (100%) from the reaction of N2O5 on NaCl (Behnke et al., 1997; Finlayson-Pitts et al., 1989; McNeill et al., 2006). For ClNO2calibrations, the ion counts are plotted against the amount of N2O5lost, as in Fig. 4. The ClNO2 data in Fig. 4 were obtained using the same flow conditions as for the N2O5calibration described above.
The difficulty with using the equilibrium vapor pressure over solid N2O5 as a CIMS calibration source is that the N2O5solid is subject to contamination, which results in un-known changes in the vapor pressure on a weekly, if not daily timescale. Without an absolute calibration, such as the known NO3absorption cross-section available to cavity ring-down techniques, abrupt (or gradual) changes in trap-output are undesirable. Furthermore, temperature control of the cold-bath must also be precise given that the vapor
pres-Fig. 4.UW-CIMS signal (Hz) vs mixing ratio (ppbv) for N2O5
(tri-angles) and ClNO2(circles) at the I(N2O5)−and I(ClNO2)−
clus-ter anion masses, respectively. The size of the points corresponds to the 1σ deviation of the points used in the average. The N2O5
mixing ratio was determined using the NOAA CaRDS. The ClNO2
mixing ratio is assumed to be equal to the amount of N2O5which reacts over a wet NaCl salt bed and is plotted against the reacted N2O5concentration. The slopes of the linear regressions provide the UW-CIMS sensitivities to each cluster anion.
sure in equilibrium with the solid changes by 30–50% per degree K, and routine calibrations require dry ice or liquid nitrogen to maintain the trap cold-bath which is not ideal for long field deployments. Our preferred method for in-dependent calibration of the UW-CIMS to N2O5 in future field deployments is to deliver the output from a custom PFA-Teflon flow reactor in which N2O5is continuously produced from the well known reaction of NO2 with O3, i.e. Reac-tions (R2–R3). This N2O5source is described in detail else-where (Bertram et al., 2009).
3.2 Factors affecting sensitivity
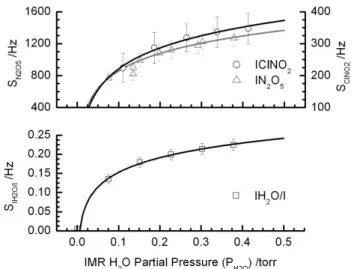
Fig. 5. Upper Panel: UW-CIMS cluster anion signal dependence on the ion molecule region (IMR) water partial pressure (PH2O). Lower Panel: the iodide-water (IH2O−)cluster anion signal,
nor-malized to the iodide reagent ion signal (I−).
(Reactions R11 and R13): water vapor mediated cluster for-mation and collisional dissociation in the CDC.
In sampling humid ambient air, iodide ions form clusters containing one or more water molecules, as do many of the analyte ions produced during the chemical ionization pro-cess. The formation of such complexes can enhance sensi-tivity by stabilizing reactive complexes, or, as is more often the case, such complexes can degrade sensitivity by reduc-ing the reactivity of the reagent ion and/or by distributreduc-ing the analyte ion of interest among severalm/zthus decreasing the signal-to-noise (S/N). For this latter reason, a number of CIMS instruments employ a CDC to increase the S/N, by collapsing the analyte ion water cluster distribution into a singlem/zrepresentative of the parent ion mass. We illustrate below that both aspects are important.
3.2.1 Water vapor mediated cluster formation
Figure 5 shows the water vapor dependence of the I(ClNO2)−and I(N2O5)−signals. To obtain this data, a con-stant mixing ratio of 2 ppb of N2O5and∼1 ppb of ClNO2 were delivered to the UW-CIMS inlet as described below, while a humidified flow of N2 was delivered directly to the IMR region via a separate length of tubing and orifice so that the results were not affected by humidity-dependent losses of N2O5 on the inlet tubing walls. The experiments were conducted with a CDC electric field strength of−60 V/cm (at 1.5 torr) that we use to simultaneously detect acyl per-oxy nitrates, N2O5, and ClNO2in the field. The signals at both the N2O5and ClNO2iodide clusters increase rapidly at low water concentrations and become independent of water vapor at approximately 0.3 torr water vapor pressure,PH2O,
in the IMR region. Due to the moist salt bed used to
pro-duce ClNO2, we were unable to achievePH2O<0.1 torr in the
IMR. Clearly, the formation of the N2O5and ClNO2clusters is facilitated by water vapor implying that the I(H2O)− clus-ter likely becomes an important additional reagent ion for production of I(ClNO2)−and I(N2O5)−
I(H2O)−+N2O5→I(N2O5)−+H2O (R14) I(H2O)−+ClNO2→I(ClNO2)−+H2O (R15) The behavior observed here for the N2O5 and ClNO2 iodide clusters is remarkably similar to that exhibited by acyl peroxy radicals (Slusher et al., 2004). Under minimal declustering, i.e. E<−5 V/cm in the CDC, the ratio of I−to I(H2O)− signals is approximately 1:1 to 1:2. Higher order water clusters, such as I(H2O)−2 and I(H2O)−3, are detected, but are less than 25% and 10%, respectively, of the I(H2O)− cluster signal. Thus, we presume that both I−and I(H2O)−
are the most important reagent ions. Indeed to obtain ex-cellent agreement between the NOAA-CaRDS N2O5 mea-surements and the UW-CIMS N2O5measurements, we must scale our I(N2O5)−cluster signal by the I(H2O)−/I−ratio to take into account fluctuations in ambient water vapor that af-fect our sensitivity. While the nitrate anion does cluster with water, producing NO3(H2O)−, there is no evidence that the iodide clusters of ClNO2or N2O5form water clusters under the sampling conditions reported in this study.
3.2.2 Collisional dissociation in the CDC
While the sensitivity to ClNO2and N2O5at their respective iodide clusters is enhanced by the presence of water vapor, it is degraded by collisional dissociation in the CDC. Thus, we strike a balance in the operation of the CDC. The CDC elec-tric field must be strong enough to dissociate water molecules associated with the analyte ions of interest to maintain a high
S/N at the cluster-ionm/z. However, the field strength must be weak enough to allow the survival of the I(ClNO2)−and I(N2O5)−clusters. In practice, there are often other species of interest for detection, such as acyl peroxy nitrates, the product ions of which may cluster with water more strongly than the iodide clusters of N2O5and ClNO2. Thus, it may be necessary to choose a CDC electric field strength that does not favor maximum sensitivity to N2O5and ClNO2via their iodide clusters if other species are to be measured.
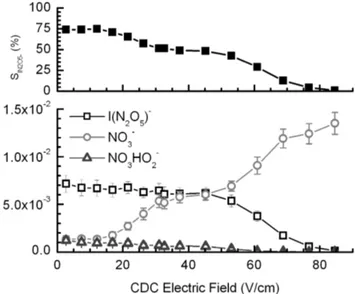
moist N2sample or ion source flows, I(N2O5)−approaches up to∼75% of the total measured N2O5signal{I(N2O5)−
+ NO−3 + NO3(H2O)−} as the CDC field strength is low-ered below−20 V/cm at 1.5 torr (upper panel, Fig. 6). The cluster anion, I(N2O5)−, remains the dominant ion signal up to−40 V/cm, but at high CDC electric fields (<−70 V/cm), the nitrate anion signal dominates. It should be noted that the cluster product ions dissociate in the CDC so the relative signals detected after the CDC provide only lower limits to the true branching of the ion-molecule reactions occurring upstream of the CDC. Other CIMS instruments using a CDC typically employ electric fields of−60 to−80 V/cm but at lower pressures (Slusher et al., 2004; Veres et al., 2008) lead-ing to even larger collisional dissociation energies and thus would require smaller potentials relative to ground for detec-tion of the clusters than those shown here. In addidetec-tion, the affect of water vapor on product ion branching ratios can be inferred from the mass spectrum presented in Fig. 3 in the context of the effect of CDC potentials just described. In Fig. 3, the CDC electric field strength is −60 V/cm, how-ever the ambient sample flow was fairly dry (RH∼30%) and thus the dissociative charge transfer anions, NO−3 and ICl−, are more abundant than expected based solely on the CDC electric field strength. The branching between charge trans-fer and cluster formation reactions are likely pressure depen-dent, and thus the IMR pressure also likely affects the abso-lute branching given that the cluster channels are probably enhanced by third-body stabilization of the complexes. This issue deserves further study and has implications for the abil-ity of other CIMS instruments with different IMR and CDC pressures to use this reaction scheme.
3.3 Specificity and instrumental zero determinations
In a complex matrix such as air, signal at somem/z can-not always be uniquely attributed to a specific compound. Chemical ionization provides a degree of specificity given that many possible ion-molecule reactions are either kineti-cally or thermodynamikineti-cally prohibited from occurring. Thus, the appropriate choice of a reagent ion can greatly improve specificity. N2O5 and ClNO2 also have certain chemical properties which can be utilized to enhance the inherent specificity of the CIMS method. First, both N2O5and ClNO2 thermally decompose around 425 K (Zhu and Lin, 2004). Second, at temperatures near 298 K, N2O5 exists in a dy-namic equilibrium with NO3and NO2. NO3reacts rapidly with NO to form NO2
NO3+NO→2NO2 (R16)
Thus, addition of high concentrations of NO to sample air near room temperature should effectively titrate both N2O5 and NO3 from the sample air (Fuchs et al., 2008). Third, chlorine has two abundant isotopes,35Cl and37Cl, naturally present at∼3:1, respectively. Thus, the I(ClNO2)−cluster will appear at both 207.9 and 209.9m/zin a ratio that should
Fig. 6. Upper Panel: relative IN2O−5 cluster anion signal (%).
Lower Panel: N2O5anion signal (IN2O−5, NO−3, NO3H2O−)
de-pendence on the CDC electric field.
match the natural isotopic abundance for chlorine. We use all of these qualities to ensure specificity in the N2O5 and ClNO2measurements. We assume that it is highly unlikely there exists chemical species that havem/zidentical to N2O5 and ClNO2, that cluster with the iodide ion, and that have the same chemical properties described above. Recent field tests suggest this assumption is valid.
To account for sources of signal at the I(N2O5)−and the I(ClNO2)−m/z that are not due to N2O5 or ClNO2, i.e. sources of background noise, we perform routine “zero” de-terminations in which N2O5 and ClNO2are scrubbed from ambient air and the residual signal is recorded. This back-ground signal has two main sources: internal electronic noise and interferences, the latter of which are ions having m/z within the mass resolution of them/zof the N2O5and ClNO2 iodide clusters. Our zero determinations include both short additions of high concentrations of NO (∼1 ppm) to the sam-pling manifold to titrate N2O5in a long-residence time tube, and sampling ambient air through a 30 cm long, 13 mm OD stainless steel tube filled with stainless steel wool and heated to 450 K. The air exiting the hot metal tube passes through a 20 cm length of 6 mm OD tubing and thus likely cools back to near ambient temperature prior to entry into the UW-CIMS. This latter method, with its high surface area of hot metal, efficiently scrubs NO3and Cl-atoms released by thermal de-composition of N2O5and ClNO2whereas the NO addition will only scrub N2O5.
Table 1.Table 1: Summary of UW-CIMS performance for simultaneous, in situ detection of N2O5and ClNO2during ICEALOT.
Species Ion Sensitivity Background Detection Limita Zero Uncertaintyb (Hz/pptv) (Hz) (pptv) (1 s/1 min) (pptv)
N2O5 I(N2O5)− 0.93±0.2 2.1±2 11.0/2.7 2.3
N2O5 NO−3 4–40c 200–4000c <2c 50–100c
ClNO2 I(ClNO2)− 1.18±0.15 2.7±2.3 13.0/3.0 2.0
aMixing ratio which yields an instantaneous signal-to-noise ratio of 2:1. This theoretical value assumes the background count rate is known
with absolute certainty.
bBased on 1σvariation between adjacent background measurements. This value is a more realistic measure of the lowest detectable mixing
ratio. See text for details.
cSensitivity and background values for NO−
3m/zcovaried unpredictably, and thus these values are highly uncertain.
scenarios lead to an uncertainty in the true background. We have observed that thePH2O in the IMR is routinely lower
during zero determinations than during ambient sampling, implying a different sensitivity during zero determinations (Fig. 5). To account for such sensitivity differences, we use I(H2O)−and I(H2O)−signals as indicators ofPH2Oand the
sensitivity behavior shown in Fig. 5 to scale our measured background signal accordingly. This leads to an average background of 3±2 pptv for both N2O5and ClNO2.
3.4 Detection limits
The lowest concentration that gives rise to a signal which can be statistically differentiated from the instrumental back-ground is termed the detection limit. It is a function of the in-strumental sensitivity, background noise, and averaging time. A useful threshold for a statistical definition of a detection limit is the concentration at which the signal-to-noise ratio (S/N) is 2. Discrete ion counting follows Poisson statistics, thus the expected random variation about a mean count rate goes as the square root of the count rate. The signal-to-noise ratio can be calculated via
S N =
Cf[X]t p
Cf [X]t+2Bt
(1) where the numerator provides the total number of counts pro-duced during a given integration period, t, while sampling air with a mixing ratio,[X], of N2O5or ClNO2, and with a calibration factor,Cf. The denominator represents the total noise associated with such a measurement which comes from the scatter about the sum of the count rate associated with the signal and the underlying background count rate,B.
Under moist ambient conditions at Earth’s surface, i.e. RH>50% andT >280 K, theCf for N2O5and ClNO2at the iodide clusters are 1.1 and 1.3 Hz/pptv, respectively, and the background count rates are 2 and 3 Hz, respectively. These parameters and Eq. (1) yield detection limits for N2O5 and ClNO2 of 11 and 13 pptv for a one second measurement. These values improve with the square root of the averaging time to<2 pptv for a 1-min average. However, there is a limit
to which time averaging can improve theS/N. The ability to distinguish signal from the background depends on the un-certainty in the background value which can be approximated as the point-to-point variation in the values determined by individual zero determinations as described above. During a recent field campaign the 1σ variation in the background count rate measurements was 2.5 Hz for N2O5and ClNO2, respectively, which is equivalent to 2.3 and 2.0 pptv using the aboveCf.
3.5 Accuracy and precision
Ultimately, we expect the accuracy of our reported N2O5and ClNO2 mixing ratios will be largely determined by uncer-tainty in the NO2 cylinder and O3 concentration measure-ment. As described in Bertram, et al. (2009), the output of our continuous-flow N2O5source agrees with the predicted values to within the ±20% uncertainty in the NO2 cylin-der concentration, O3mixing ratio measurement, and plug-flow estimated reaction time in the synthesis volume. Other sources of inaccuracy include unaccounted for fluctuations in sample flow rates, IMR pressure, ambient water, instru-ment trailer temperature, and inlet transmission efficiency. We actively control IMR pressure and sample flow rates to better than 1%, we use short transit times through sample tubing (250 ms) to minimize wall interactions and chemistry, and we employ daily standard addition calibrations and inlet transmission tests to assess drift on this timescale. On shorter timescales, we rely on normalization of ion count rates to the total I−and I(H2O)−to capture changes in sensitivity due to
changes in ion transmission and ambient water vapor. Note, the sensitivity varies by only 0.25% per percent change am-bient water vapor mixing ratio whenPH2O>0.2 torr. It is only
in regions where PH2O<0.15, and changing on timescales
Thus, for hourly or longer time averages, across which we will have a well-calibrated knowledge of instrument sensi-tivity and background, we estimate an accuracy of±20% for ClNO2and N2O5mixing ratios well above 5 pptv.
We expect that the precision of our N2O5and ClNO2 ob-servations is governed largely by counting statistics as we have already demonstrated for our acyl peroxy nitrate mea-surements using adjacent differences of high time resolution measurements of a calibration source (Wolfe et al., 2007). The 1σ relative precision under counting statistics is S/√S where S is the signal count rate. For a 1 s integration and 100 pptv N2O5or ClNO2, we estimate a precision of 10% and 7.5%, respectively under moist conditions. This preci-sion improves with the square root of the integration time. Generally, atmospheric variability is large enough, even on 60-s timescales to be the dominant source of point-to-point variability. Indeed given the poor vertical mixing near the surface at night, very large relative changes in concentrations are possible on short timescales.
4 Field performance
We recently deployed the UW-CIMS instrument aboard the Research Vessel (RV) Knorr as part of the International Chemistry in the Arctic Lower Troposphere (ICEALOT) campaign. The measurement campaign ran from 19 March– 24 April, 2008 as the ship left Woods Hole, MA and trav-eled from the Long Island Sound to Rekjavik, Iceland via Tromso, Norway. For more information on the goals and measurement suite during this campaign please visit: http: //saga.pmel.noaa.gov/Field/icealot/. Our goal was to provide high quality measurements of ClNO2 and to test the per-formance of our N2O5measurement technique side-by-side with the NOAA cavity ringdown spectrometer (CaRDS) in-strument (Brown et al., 2002). Table 1 summarizes instru-ment performance during this campaign.
Prior to deployment, the UW-CIMS instrument and the NOAA CaRDS instrument made ambient measurements in Boulder, CO as part of the integration of the instruments into the shipping container that housed them on theRV Knorr. The inlet configuration, shown in Fig. 1, for sampling both in Boulder, CO and on the Knorr is a virtual impactor, con-sisting of N2O5and NO addition ports, a reducer, and a 12m length of 6 mm OD PFA tubing into the sea container. Am-bient air is sampled at∼11 slpm through a 1 cm length of 6 mm OD PFA tubing inlet (a) on the front end of a custom built virtual impactor (f). Standard addition ports for N2O5 (6 mm, b) and NO (3 mm, c) are tied into the main sampling line via PFA fittings. Immediately following the NO addition port is a constriction (d) which serves to drop the sampling line pressure to∼300 torr. A 12 m length of PFA tubing is used to transport the gas from the top of the sampling tower to the sea container (e) where it is split∼1 m from the end to
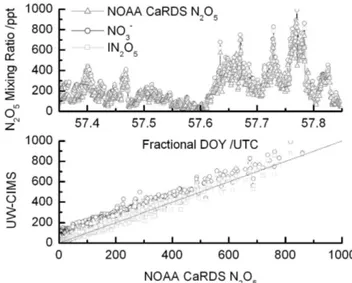
Fig. 7.Upper Panel: the N2O5mixing ratio for 26 February, 2008, as measured by the NOAA CaRDS (triangles), the I(N2O5)−
clus-ter (squares) and NO−3 (circles). Lower Panel: a comparison be-tween the I(N2O5)−cluster (squares) and NO−3 anion (circles) with
the NOAA cavity ringdown measurement, respectively. The solid black line is a 1:1 ratio.
allow the UW-CIMS and NOAA CaRDS to sample from the same inlet simultaneously.
Fig. 8. The ClNO2 (black) and N2O5(grey) mixing ratios
mea-sured from 22 March (DOY 82) through 24 March 2008 during the ICEALOT field campaign. The maximum N2O5mixing ratio was
∼100 pptv on 22 March (82), while ClNO2reached 80 pptv.
N2O5mixing ratio over the full range of atmospheric con-centrations than does the NO−3 ion.
Figure 8 shows a subset of the time series of N2O5 and ClNO2mixing ratios measured by the UW-CIMS during the first portion of ICEALOT. On 22 March (DOY 82), theRV Knorrwas traveling east-northeast exiting the Long Island Sound, and continued in this direction through 24 March. By 24 March, theRV Knorrwas several hundred km off the North American Continent in the North Atlantic (∼45◦N, 55◦W). During this period, the prevailing wind direction was westerly to northwesterly at 5–10 m/s, suggesting these data represent sampling of aged continental airmasses. Our obser-vations show concentration maxima were 10–100 pptv dur-ing this period, which on the one hand are significant, rela-tive to previously predicted values of ClNO2(Pechtl and von Glasow, 2007), but also illustrate the low detection limits of this method. Most nights while within the Long Island Sound (data not shown), N2O5 reached 100–250 pptv on average during night, with average nighttime ClNO2being generally equal to or higher at mixing ratios of 150–200 pptv.
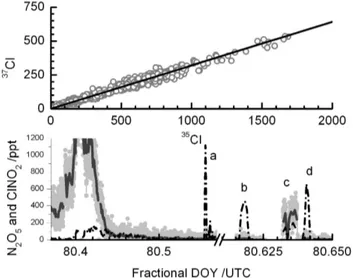
During the field deployment, several tests were performed to assess the presence of interferences at them/zused to de-tect ClNO2 and the potential generation of ClNO2 by re-actions of N2O5 on inlet tubing walls. Figure 9 summa-rizes the results of such tests. In the top panel, we plot the raw signal obtained at I(35ClNO2)−m/z versus the sig-nal at the I(37ClNO2)−m/z from the entire period of sam-pling in the Long Island Sound (see Fig. 8). A linear least squares fit to the data (not shown), forced through the inter-cept, yields a slope of 0.3207 andR2=0.996. This is within 0.5% percent of the theoretical isotopic value, 0.3199, indi-cated by the thick solid line. The experimental and theoret-ical values are well within the precision of the instrument
Fig. 9. Upper Panel: the measured ClNO2isotope ratio (open
cir-cles) and a linear fit (m=0.320,R2=0.996). Lower Panel: time trace of N2O5(black dashed line), ClNO2(grey) and 1-min binned
aver-age ClNO2(dark grey) mixing ratios for 20 March 2008. (a)
Stan-dard addition of 1.02 ppbv of N2O5to the ambient sample flow.(b)
Standard addition of∼500 pptv of N2O5to the ambient sample by-passing a wet NaCl salt bed. (c)Standard addition of∼500 pptv of N2O5to ambient sample flow which passes over the wet NaCl salt bed.(d)Standard addition of 700 pptv of N2O5to the ambient
sample flow bypassing the NaCl salt bed.
5 Summary and conclusions
We report on a new method for the simultaneous in situ de-tection of nitryl chloride, ClNO2, and N2O5using chemical ionization mass spectrometry (CIMS). The novel N2O5 de-tection scheme is direct and it does not suffer from high and variable chemical interferences, which are associated with the more typical nitrate anion based approach. We address the roles of water vapor, electric field strengths, and instru-ment zero determinations, which can greatly influence the overall sensitivity and detection limit of the method. The sensitivity to both N2O5 and ClNO2 is logarithmically de-pendant on the partial pressure of water vapor in the ion-molecule reaction region. Under typical marine bound-ary layer conditions, the technique can be largely insensi-tive to changes in atmospheric water vapor concentrations, but under continental sampling, low water vapor concen-trations could greatly reduce sensitivity. Detection of the iodide-clusters of these species has a threshold-dependence on the electric field strength in the CDC. Above−70 V/cm at 1.5 torr in the CDC, the clusters become essentially unde-tectable. We demonstrate the ability for simultaneous in situ measurements of ClNO2and N2O5while on board theR/V
Knorr as part of the ICEALOT 2008 Field Campaign. These observations serve to reinforce the importance of ClNO2as a nocturnal NOxand Cl-atom reservoir in coastal regions. Our technique allows a way to measure both reactant (N2O5)and product (ClNO2)of complex gas-particle chemistry with a single instrument.
Acknowledgements. William P. Dub´e, Hendrik Fuchs, and Steven S. Brown provided the cavity ringdown N2O5
mea-surements for comparison. We thank National Oceanic and Atmospheric Administration (NOAA) scientists Steven Brown, Bill Kuster and Eric J. Williams of the Earth System Research Laboratory and Patricia K. Quinn and Timothy Bates of the Pacific Marine Environmental Laboratory for financial and logistical support during the integration and ICEALOT campaign. We greatly appreciate the efforts of theRV Knorrcrew exhibited during the entire cruise. We thank V. Faye McNeill for insights into nitryl chloride detection, G. M. Wolfe for help with instrument integration prior to ICEALOT and T. H. Bertram for useful discussions about instrument performance. JPK gratefully acknowledges the Camille and Henry Dreyfus foundation for financial support through a postdoctoral fellowship.
Edited by: H. Schlager
References
Aldener, M., Brown, S. S., Stark, H., Williams, E. J., Lerner, B. M., Kuster, W. C., Goldan, P. D., Quinn, P. K., Bates, T. S., Fehsenfeld, F. C., and Ravishankara, A. R.: Reactivity and Loss Mechanisms of NO3and N2O5in a Polluted Marine Environ-ment: Results from in situ Measurements during New England Air Quality Study 2002, J. Geophys. Res.-Atmos., 111, D23S73, doi:10.1029/2006JD007252, 2006.
Arsene, C., Bougiatioti, A., Kanakidou, M., Bonsang, B., and Mi-halopoulos, N.: Tropospheric OH and Cl levels deduced from non-methane hydrocarbon measurements in a marine site, At-mos. Chem. Phys., 7, 4661–4673, 2007,
http://www.atmos-chem-phys.net/7/4661/2007/.
Atkinson, R.: Atmospheric Chemistry of VOCs and NOx, Atmos.
Environm., 34, 2063–2101, 2000.
Ayers, J. D. and Simpson, W. R.: Measurements of N2O5 near Fairbanks, Alaska, J. Geophysi. Res.-Atmos., 111, D14309, doi:10.1029/2006JD007070, 2006.
Behnke, W., George, C., Scheer, V., and Zetzsch, C.: Production and Decay of ClNO2from the Reaction of Gaseous N2O5with
NaCl solution: Bulk and Aerosol Experiments, J. Geophys. Res.-Atmos., 102, 3795–3804, 1997.
Bertram, T. H., Thornton, J. A., and Riedel, T. P.: An experimental technique for the direct measurement of N2O5reactivity on
am-bient particles, Atmos. Meas. Tech. Discuss., 2, 689–723, 2009, http://www.atmos-meas-tech-discuss.net/2/689/2009/.
Brown, S. S., Dube, W. P., Osthoff, H. D., Stutz, J., Ryerson, T. B., Wollny, A. G., Brock, C. A., Warneke, C., De Gouw, J. A., At-las, E., Neuman, J. A., Holloway, J. S., Lerner, B. M., Williams, E. J., Kuster, W. C., Goldan, P. D., Angevine, W. M., Trainer, M., Fehsenfeld, F. C., and Ravishankara, A. R.: Vertical Pro-files in NO3and N2O5Measured from an Aircraft: Results from
the NOAA P-3 and Surface Platforms during the New England Air Quality Study 2004, J. Geophys. Res.-Atmos., 112, D22304, doi:10.1029/2007JD008883, 2007.
Brown, S. S., Neuman, J. A., Ryerson, T. B., Trainer, M., Dube, W. P., Holloway, J. S., Warneke, C., de Gouw, J. A., Donnelly, S. G., Atlas, E., Matthew, B., Middlebrook, A. M., Peltier, R., Weber, R. J., Stohl, A., Meagher, J. F., Fehsenfeld, F. C., and Ravishankara, A. R.: Nocturnal Odd-Oxygen Budget and its Im-plications for Ozone Loss in the Lower Troposphere, Geophys. Res. Lett., 33, L08801, doi:10.1029/2006GL025900, 2006. Brown, S. S., Stark, H., Ciciora, S. J., McLaughlin, R. J., and
Rav-ishankara, A. R.: Simultaneous in situ Detection of Atmospheric NO3and N2O5via Cavity Ring-Down Spectroscopy, Rev. Sci.
Instrum., 73, 3291–3301, 2002.
Cavender, A. E., Biesenthal, T. A., Bottenheim, J. W., and Shep-son, P. B.: Volatile organic compound ratios as probes of halo-gen atom chemistry in the Arctic, Atmos. Chem. Phys., 8, 1737– 1750, 2008, http://www.atmos-chem-phys.net/8/1737/2008/. Dentener, F. J. and Crutzen, P. J.: Reaction of N2O5 on
Tropo-spheric Aerosols – Impact on the Global Distributions of NOx,
O3, and OH, J. Geophys. Res.-Atmos., 98, 7149–7163, 1993.
Evans, M. J. and Jacob, D. J.: Impact of new Laboratory Studies of N2O5Hydrolysis on Global Model Budgets of Tropospheric
Ni-trogen Oxides, Ozone, and OH, Geophys. Res. Lett., 32, L09813, doi:10.1029/2005GL022469, 2005.
Finlayson-Pitts, B. J., Ezell, M. J., and Pitts, J. N.: Formation of Chemically Active Chlorine Compounds by Reactions of Atmo-spheric NaCl Particles with Gaseous N2O5 and ClONO2,
Na-ture, 337, 241–244, 1989.
Fuchs, H., Dube, W. P., Cicioira, S. J., and Brown, S. S.: Deter-mination of Inlet Transmission and Conversion Efficiencies for in situ Measurements of the Nocturnal Nitrogen Oxides, NO3,
N2O5 and NO2, via Pulsed Cavity Ring-Down Spectroscopy,
Anal. Chem., 80, 6010–6017, 2008.
Compar-ison of Tropospheric NO3Radical Measurements by Differential Optical Absorption Spectroscopy and Matrix Isolation Electron Spin Resonance, J. Geophys. Res.-Atmos., 104, 26097–26105, 1999.
Harrison, A. G.: Chemical Ionization Mass Spectrometry, CRC Press, Boca Raton, FL, USA, 1983.
Heintz, F., Platt, U., Flentje, H., and Dubois, R.: Long-term Obser-vation of Nitrate Radicals at the Tor Station, Kap Arkona (Ru-gen), J. Geophys. Res.-Atmos., 101, 22891–22910, 1996. Huey, L. G.: Measurement of Trace Atmospheric Species by
Chem-ical Ionization Mass Spectrometry: Speciation of Reactive Nitro-gen and Future Directions, Mass Spectrom. Rev., 26, 166–184, 2007.
Huey, L. G., Hanson, D. R., and Howard, C. J.: Reactions of SF−6 and I−with Atmospheric Trace Gases, J. Phys. Chem., 99, 5001– 5008, 1995.
Jacob, D. J.: Heterogeneous Chemistry and Tropospheric Ozone, Atmos. Environ., 34, 2131–2159, 2000.
Logan, J. A., Prather, M. J., Wofsy, S. C., and McElroy, M. B.: Tro-pospheric Chemistry – A Global Perspective, J. Geophys. Res., 86, 7210–7255, 1981.
McNeill, V. F., Patterson, J., Wolfe, G. M., and Thornton, J. A.: The effect of varying levels of surfactant on the reactive uptake of N2O5to aqueous aerosol, Atmos. Chem. Phys., 6, 1635–1644, 2006, http://www.atmos-chem-phys.net/6/1635/2006/.
Mentel, T. F., Bleilebens, D., and Wahner, A.: A Study of Nighttime Nitrogen Oxide Oxidation in a Large Reaction Chamber -The Fate of NO2N2O5, HNO3, and O3at Different Humidities,
Atmos. Environ., 30, 4007–4020, 1996.
Noxon, J. F., Norton, R. B., and Marovich, E.: NO3in the
Tropo-sphere, Geophys. Res. Lett., 7, 125–128, 1980.
Osthoff, H. D., Roberts, J. M., Ravishankara, A. R., Williams, E. J., Lerner, B. M., Sommariva, R., Bates, T. S., Coffman, D., Quinn, P. K., Dibb, J. E., Stark, H., Burkholder, J. B., Talukdar, R. K., Meagher, J., Fehsenfeld, F. C., and Brown, S. S.: High Levels of Nitryl Chloride in the Polluted Subtropical Marine Boundary Layer, Nature Geoscience, 1, 324–328, 2008.
Pechtl, S. and von Glasow, R.: Reactive Chlorine in the Ma-rine Boundary Layer in the Outflow of Polluted Continen-tal Air: A Model Study, Geophys. Res. Lett., 34, L11813, doi:10.1029/2007GL029761, 2007.
Platt, U., Allan, W., and Lowe, D.: Hemispheric average Cl atom concentration from13C/12C ratios in atmospheric methane, At-mos. Chem. Phys., 4, 2393–2399, 2004,
http://www.atmos-chem-phys.net/4/2393/2004/.
Platt, U. and Heintz, F.: Nitrate Radicals in Tropospheric Chem-istry, Israel J. Chem., 34, 289–300, 1994.
Simpson, W. R.: Continuous Wave Cavity Ring-Down Spec-troscopy Applied to in situ Detection of Dinitrogen Pentoxide (N2O5), Rev. Sci. Instrum., 74, 3442–3452, 2003.
Slusher, D. L., Huey, L. G., Tanner, D. J., Flocke, F. M., and Roberts, J. M.: A Thermal Dissociation-Chemical Ion-ization Mass Spectrometry (TD-CIMS) Technique for the Si-multaneous Measurement of Peroxyacyl Nitrates and Dini-trogen Pentoxide, J. Geophys. Res.-Atmos., 109, D19315, doi:10.1029/2004JD004670, 2004.
Smith, N., Plane, J. M. C., Nien, C. F., and Solomon, P. A.: Night-time Radical Chemistry in the San-Joaquin Valley, Atmos. Envi-ron., 29, 2887–2897, 1995.
Spicer, C. W., Chapman, E. G., Finlayson-Pitts, B. J., Plastridge, R. A., Hubbe, J. M., Fast, J. D., and Berkowitz, C. M.: Unexpect-edly High Concentrations of Molecular Chlorine in Coastal Air, Nature, 394, 353–356, 1998.
Stutz, J., Alicke, B., Ackermann, R., Geyer, A., White, A., and Williams, E.: Vertical Profiles of NO3, N2O5, O3, and NOxin
the Nocturnal Boundary Layer: 1. Observations during the Texas Air Quality Study 2000, J. Geophys. Res.-Atmos., 109, D12306, doi:10.1029/2007JD008883, 2004.
Thornton, J. A. and Abbatt, J. P. D.: N2O5Reaction on Submicron
Sea Salt Aerosol: Kinetics, Products, and the Effect of Surface Active Organics, J. Phys. Chem. A, 109, 10004–10012, 2005. Thornton, J. A., Braban, C. F., and Abbatt, J. P. D.: N2O5
Hy-drolysis on Sub-Micron Organic Aerosols: the Effect of Relative Humidity, Particle Phase, and Particle Size, Phys. Chem. Ch. Ph., 5, 4593–4603, 2003.
van Aardenne, J. A., Carmichael, G. R., Levy, H., Streets, D., and Hordijk, L.: Anthropogenic NOxEmissions in Asia in the Period
1990–2020, Atmos. Environ., 33, 633–646, 1999.
Veres, P., Roberts, J. M., Warneke, C., Welsh-Bon, D., Zahniser, M., Herndon, S., Fall, R., and de Gouw, J.: Development of Negative-Ion Proton-Transfer Chemical-Ionization Mass Spec-trometry (NI-PT-CIMS) for the Measurement of Gas-Phase Or-ganic Acids in the Atmosphere, Int. J. Mass Spectrom., 274, 48– 55, 2008.
Wayne, R. P., Barnes, I., Biggs, P., Burrows, J. P., Canosamas, C. E., Hjorth, J., Lebras, G., Moortgat, G. K., Perner, D., Poulet, G., Restelli, G., and Sidebottom, H.; The Nitrate Radical - Physics, Chemistry, and the Atmosphere, Atmos. Environ. A-Gen., 25, 1–203, 1991.
Wolfe, G. M., Thornton, J. A., McNeill, V. F., Jaffe, D. A., Reid-miller, D., Chand, D., Smith, J., Swartzendruber, P., Flocke, F., and Zheng, W.: Influence of trans-Pacific pollution transport on acyl peroxy nitrate abundances and speciation at Mount Bache-lor Observatory during INTEX-B, Atmos. Chem. Phys., 7, 5309– 5325, 2007,
http://www.atmos-chem-phys.net/7/5309/2007/.
Wood, E. C., Wooldridge, P. J., Freese, J. H., Albrecht, T., and Co-hen, R. C.: Prototype for in situ detection of Atmospheric NO3 and N2O5via Laser-Induced Fluorescence, Environ. Sci.
Tech-nol., 37, 5732–5738, 2003.
Yienger, J. J.: An Evaluation of Chemistry’s Role in the Winter-Spring Ozone Maximum found in the Northern Midlatitude Free Troposphere, J. Geophys. Res.-Atmos., 104, 8329–8329, 1999. Zhu, R. S. and Lin, M. C.: ab initio Studies of ClOx Reactions: