BGD
5, 1263–1292, 2008Excess N2 and groundwater N2O
emission factors
D. Weymann et al.
Title Page
Abstract Introduction
Conclusions References
Tables Figures
◭ ◮
◭ ◮
Back Close
Full Screen / Esc
Printer-friendly Version
Interactive Discussion Biogeosciences Discuss., 5, 1263–1292, 2008
www.biogeosciences-discuss.net/5/1263/2008/ © Author(s) 2008. This work is distributed under the Creative Commons Attribution 3.0 License.
Biogeosciences Discussions
Biogeosciences Discussionsis the access reviewed discussion forum ofBiogeosciences
Assessment of excess N
2
and
groundwater N
2
O emission factors of
nitrate-contaminated aquifers in northern
Germany
D. Weymann1, R. Well1, H. Flessa1, C. von der Heide2, M. Deurer3, K. Meyer4, C. Konrad5, and W. Walther5
1
Soil Science of Temperate and Boreal Ecosystems, B ¨usgen-Institute, University of G ¨ottingen, B ¨usgenweg 2, 37077 G ¨ottingen, Germany
2
Inst. for Soil Science, Univ. of Hannover, Herrenh ¨auser Str. 2, 30419 Hannover, Germany
3
HortResearch, Tennent Drive, Palmerston North, 4474 New Zealand
4
Geries Ingenieure, B ¨uro f ¨ur Standorterkundung, Kirchberg 12, 37130 Gleichen, Germany
5
Inst. for Groundwater Management, Dresden Univ. of Technology, 01062 Dresden, Germany
Received: 12 February 2008 – Accepted: 23 February 2008 – Published: 1 April 2008 Correspondence to: R. Well (rwell@gwdg.de)
BGD
5, 1263–1292, 2008Excess N2 and groundwater N2O
emission factors
D. Weymann et al.
Title Page
Abstract Introduction
Conclusions References
Tables Figures
◭ ◮
◭ ◮
Back Close
Full Screen / Esc
Printer-friendly Version
Interactive Discussion
Abstract
We investigated the dynamics of denitrification and nitrous oxide (N2O) accumulation in 4 nitrate (NO−
3) contaminated denitrifying sand and gravel aquifers of northern
Ger-many (Fuhrberg, Sulingen, Th ¨ulsfelde and G ¨ottingen) to quantify their potential N2O emission and to evaluate existing concepts of N2O emission factors. Excess N2 -5
N2produced by denitrification – was determined by using the argon (Ar) concentra-tion in groundwater as a natural inert tracer, assuming that this noble gas funcconcentra-tions as a stable component and does not change during denitrification. Furthermore, initial NO−
3concentrations (NO−3 that enters the groundwater) were derived from excess N2
and actual NO−
3 concentrations in groundwater in order to determine potential indirect
10
N2O emissions as a function of the N input. Median concentrations of N2O and excess N2 ranged from 3 to 89µg N L−1 and from 3 to 10 mg N L−1 respectively. Reaction
progress (RP) of denitrification was determined as the ratio between products (N2O-N +excess N2) and starting material (initial NO−
3 concentration) of the process,
charac-terizing the different stages of denitrification. N2O concentrations were lowest at RP 15
close to 0 and RP close to 1 but relatively high at a RP between 0.2 and 0.6. For the first time, we report groundwater N2O emission factors consisting of the ratio between N2O-N and initial NO−
3-N concentrations (EF1). According to denitrification intensity,
EF(1) was smaller than the ratio between N2O-N and actual NO−
3-N concentrations
EF(2). In general, these emission factors were highly variable within the aquifers. The 20
site medians ranged between 0.00043–0.00438 for EF(1) and 0.00092–0.01801 for EF(2), respectively. For the aquifers of Fuhrberg and Sulingen, we found EF(1) me-dian values which are close to the 2006 IPCC default value of 0.0025. In contrast, we determined significant lower EFs for the aquifers of Th ¨ulsfelde and G ¨ottingen.
BGD
5, 1263–1292, 2008Excess N2 and groundwater N2O
emission factors
D. Weymann et al.
Title Page
Abstract Introduction
Conclusions References
Tables Figures
◭ ◮
◭ ◮
Back Close
Full Screen / Esc
Printer-friendly Version
Interactive Discussion
1 Introduction
Denitrification is considered the most important reaction for nitrate (NO−
3) remediation
in aquifers. This process occurs in O2 depleted layers with available electron donors (Ross, 1995; B ¨ottcher et al., 1990). Especially in agricultural areas with high N inputs via fertilizers considerable NO−
3 reduction is possible (B ¨ottcher et al., 1985).
Dinitro-5
gen (N2) is the final product of this process. Thus the quantification of groundwater N2 arising from denitrification (excess N2) can facilitate the reconstruction of historical N inputs, because NO−
3 loss is derivable from the sum of denitrification products (B ¨ohlke
and Denver, 1995). Generally, the concentration of excess N2produced by denitrifica-tion in groundwater is estimated by comparing the measured concentradenitrifica-tions of Ar and 10
N2 with those expected from atmospheric equilibrium, assuming that the noble gas Ar is a stable component (Blicher-Mathiesen et al., 1998; B ¨ohlke, 2002; Dunkle et al., 1993; Mookherji et al. 2003). However, measuring of excess N2is complicated by vari-ations of recharge temperatures and entrapment of air bubbles near the groundwater surface which leads to varying background concentrations of dissolved N2 in ground-15
water due to contact of the water with atmospheric air (B ¨ohlke, 2002). Furthermore, N2 can be lost by degassing (Blicher-Mathiesen et al., 1998). Another aspect of deni-trification are potential accumulation and emission of the greenhouse gas nitrous oxide (N2O) which represents an obligate intermediate of the process. In contrast to direct agricultural N2O emissions arising at the sites of agricultural production, e.g. soils, in-20
direct emissions from ground and surface waters are associated with nitrogen leaching and runoffto adjacent systems (Well et al., 2005a; Nevison, 2000). The knowledge of these indirect emissions is limited because few studies have tried to relate subsurface N2O concentrations to N leaching from soils (Clough et al., 2005) and investigations of N2O in deeper aquifers are rare (Ronen et al., 1988; McMahon et al., 2000; Hiscock et 25
al., 2002).
In the aquifers of unconsolidated pleistocene deposits covering large areas in the northern part of central Europe, agricultural NO−
BGD
5, 1263–1292, 2008Excess N2 and groundwater N2O
emission factors
D. Weymann et al.
Title Page
Abstract Introduction
Conclusions References
Tables Figures
◭ ◮
◭ ◮
Back Close
Full Screen / Esc
Printer-friendly Version
Interactive Discussion reducing conditions (Walther, 1999), suggesting that this region might be susceptible
for relatively high N2O fluxes from deeper groundwater. However, until now there have been no systematic investigations of N2O dynamics in these aquifers.
N2O emissions from groundwater were thought to comprise a significant fraction of total agricultural N2O emissions (IPCC, 1997), but recent studies show in agreement 5
that their significance is presumably lower (McMahon et al., 2000; Hiscock et al., 2003; H ¨oll et al., 2005; Reay et al., 2005; Well et al., 2005a; Sawamoto et al., 2005). Conse-quently, the nitrous oxide emission factor from aquifers and agricultural drainage water was corrected downwards from 0.015 to 0.0025 by the IPCC in 2006, taking the data of Hiscock et al. (2002, 2003), Reay et al. (2004, 2005) and Sawamoto et al. (2005) as 10
a basis.
Principally, the N2O emission factor of a system is defined by the ratio between N2O emission and N input (IPCC, 1997). However, the IPCC factor characterizing indirect emissions from aquifers and drainage ditches (EF5-g) had been derived from the ra-tio between dissolved N2O und NO−
3 concentrations observed in a small number of
15
studies, because input and emission data had not been available. Consequently, there are uncertainties in the estimate of EF5-g because both NO−
3 and N2O are subject to
change during subsurface transport (Dobbie and Smith, 2003). Furthermore, determi-nation of N2O fluxes from aquifers is connected with experimental difficulties: N2O as an intermediate product from denitrification is permanently influenced by different en-20
zyme kinetics of various denitrifying communities and groundwater N2O concentration is the net result of simultaneous production and reduction reactions (Well et a. 2005b). H ¨oll et al. (2005) stated that these transformations are the reason why N2O concentra-tion in groundwater does not necessarily reflect actual indirect N2O emission. Finally, as a result of NO−
3 consumption in denitrifying aquifers, the NO−3 concentration in the
25
deeper groundwater is lower than the initial NO−
3 concentration at the groundwater
sur-face. Thus, the reconstruction of initial NO−
3 concentrations by means of measuring
excess N2 could be a tool to determine the N input to aquifers and thus reduce uncer-tainties connected with determination of EF5-g.
BGD
5, 1263–1292, 2008Excess N2 and groundwater N2O
emission factors
D. Weymann et al.
Title Page
Abstract Introduction
Conclusions References
Tables Figures
◭ ◮
◭ ◮
Back Close
Full Screen / Esc
Printer-friendly Version
Interactive Discussion In this study we measured excess N2 and N2O in groundwater of 4
nitrate-contaminated, denitrifying aquifers in Northwest Germany in order (1) to estimate initial NO−
3 that enter the groundwater surface, (2) to assess potential indirect emissions of
N2O, and (3) to compare existing concepts of groundwater N2O emission factors.
2 Material and methods
5
2.1 Study sites
Investigations were conducted in the aquifers of 4 drinking water catchments (Fuhrberg, G ¨ottingen, Th ¨ulsfelde and Sulingen) located in Northwest Germany, Lower Saxony. These aquifers consist of pleistocene sand and pleistocene gravel and are characterized by NO−
3 contamination that results from intensive agricultural N inputs via
10
fertilizers. In all aquifers, NO−
3 concentrations in the deeper groundwater are
substan-tially lower compared to the shallow groundwater. In previous studies, denitrification was identified as the natural process for reduction of groundwater NO−
3
concentra-tions in Fuhrberg (K ¨olle et al., 1985; B ¨ottcher et al., 1990), Th ¨ulsfelde (P ¨atsch, 2006; Walther et al., 2001), and Sulingen (Konrad, 2007). General properties of the aquifers 15
are summarized in Table 1.
2.2 Sampling and laboratory analyses
Groundwater samples (3 or 4 replications per depth, respectively) were collected dur-ing sdur-ingle (Suldur-ingen, G ¨ottdur-ingen) or repeated sampldur-ing events (Th ¨ulsfelde) or 4 times within one year (Fuhrberg), respectively, from groundwater monitoring wells allowing 20
BGD
5, 1263–1292, 2008Excess N2 and groundwater N2O
emission factors
D. Weymann et al.
Title Page
Abstract Introduction
Conclusions References
Tables Figures
◭ ◮
◭ ◮
Back Close
Full Screen / Esc
Printer-friendly Version
Interactive Discussion pressure in the suction tubing might cause partial outgassing of the water sample
dur-ing pumpdur-ing, a low suction rate of approximately 50 ml min−1was used to minimize this
effect. In Fuhrberg, additional samples were collected from taps at the pump outlets of drinking water wells which delivered raw water to the waterworks. The other sites were equipped with regular monitoring wells consisting of PVC-pipes (diameter between 5
1.5′′and 4′′) with filter elements of one or two m length. Here, samples were collected
with a submersible pump (GRUNDFOS MP1, Bjerringbro, Denmark), which prevents outgassing because the water samples are at a positive pressure during pumping. From one of these monitoring wells, replicate groundwater samples were collected using both pump types in order to estimate potential outgassing using the peristaltic 10
pump. Differences between the treatments were non-significant, which proves that outgassing was negligible. For both pump types, groundwater was collected from the outlet through a 4 mm ID PVC tubing by placing its end to the bottom of 115 ml serum bottles. After an overflow of at least 115 ml groundwater, the tubing was carefully re-moved and the bottles were immediately sealed with grey butyl rubber septa (ALT-15
MANN, Holzkirchen, Germany) and aluminium crimp caps. There were no visible air bubbles in the tubings and the vial during the procedure. The samples were stored at 10◦C (approximate groundwater temperature as estimated from mean annual air
tem-perature) and analyzed within one week. Eight ml of Helium was injected in each vial in order to replace an equivalent amount of groundwater and to create a gas headspace. 20
Liquid and gas phase were equilibrated at constant temperature (25◦C) by agitating on
a horizontal shaker for 3 h. To analyse N2 and Ar, 1 ml headspace gas was injected manually with a gas-tight 1-ml syringe equipped with a valve (SGE, Darmstadt) into a gas chromatograph (Fractovap 400, CARLO ERBA, Milano) equipped with a thermal conductivity detector and a packed column (1.8 m length, 4 mm ID, molecular sieve 25
5 ˚A) and using helium as carrier gas. Because retention times of O2 and Ar are simi-lar on this column, O2 was quantitatively removed using a heated Cu-column (800◦C)
which was installed prior to the GC-column. To avoid contamination with atmospheric air during sample injection the following precautions were necessary: the syringe was
BGD
5, 1263–1292, 2008Excess N2 and groundwater N2O
emission factors
D. Weymann et al.
Title Page
Abstract Introduction
Conclusions References
Tables Figures
◭ ◮
◭ ◮
Back Close
Full Screen / Esc
Printer-friendly Version
Interactive Discussion flushed with helium immediately before penetrating the sample septum. Subsequently,
the syringe was “over-filled” by approximately 15%, the syringe valve closed and the plunger adjusted to 1 mL in order to slightly pressurize the sample. The syringe nee-dle was then held directly above the injection port before the valve was opened for a second to release excess pressure and the sample was finally injected. Generally, 3 5
replicate groundwater samples were analysed. A fourth sample served as reserve in case of failure during analysis. A calibration curve was obtained by injecting 0.2, 0.3, 0.5 and 1.0 ml of atmospheric air (3 replications each), resulting in different Ar and N2 concentrations per calibration step.
To determine dissolved N2O concentrations, the headspace volume was augmented 10
to 40 ml by an additional injection of 32 ml of Helium and an equivalent amount of groundwater was replaced. After equilibrating liquid and gas phase at constant tem-perature (25◦C), 24 ml of the headspace gas were equally distributed to 2 evacuated
septum-capped exetainers® (12 ml, Labco, Wycombe, UK). Nitrous oxide was ana-lyzed using a gas chromatograph equipped with an electron capture detector and 15
an autosampler as described by Well et al. (2003). NO−
3 concentration was
deter-mined on 0.45µm membrane-filtered samples by use of an ion chromatograph (ICS-90, DIONEX, Idstein, Germany) equipped with an IC-AIS column.
Molar fractions of N2, Ar and N2O in the headspace of sample vials and the volume of added He as well as the solubilities of these gases (Weiss, 1970, 1971; Weiss and 20
Price, 1980) were used to calculate partial pressure and molar fraction in the ground-water for each gas (Blicher-Mathiesen et al., 1998). Total pressure in the headspace after equilibration at 25◦C obtained from the sum of partial pressures of each gas or by
direct measurement using a pressure transducer equipped with a hypodermic needle (Thies Klima, G ¨ottingen, Germany) were in good agreement, i.e. differences between 25
measured and calculated pressure were<9%. We checked the accuracy of estimated molar concentrations of dissolved gases from headspace concentration by adding de-fined volumes of N2(1 and 2 mL, respectively) to samples of demineralised water equi-librated at 10◦C. Recovery of N
BGD
5, 1263–1292, 2008Excess N2 and groundwater N2O
emission factors
D. Weymann et al.
Title Page
Abstract Introduction
Conclusions References
Tables Figures
◭ ◮
◭ ◮
Back Close
Full Screen / Esc
Printer-friendly Version
Interactive Discussion and 2 mL added N2.
2.3 Calculation of excess N2
N2 dissolved in groundwater samples includes atmospheric N2 and N2 from denitri-fication (excess N2) accumulated during the groundwater flow path (Boehlke, 2002). Principally, N2 from denitrification can be determined by subtracting atmospheric N2 5
from total N2(N2T). Atmospheric N2in groundwater consists of two components, (i) N2 dissolved according to equilibrium solubility (N2E Q), and (ii) N2from “excess air” (N2E A, Heaton and Vogel, 1981). Excess air denotes dissolved gas components in excess to equilibrium and other known subsurface gas sources. Excess air originates from entrapment of air bubbles at the groundwater surface during recharge which is subject 10
to complete or partial dissolution (Holocher et al., 2002).
Excess N2(XexcessN2) can thus be calculated using the following equation:
XexcessN2 =XN2T−XN2EA−XN2EQ (1)
whereX denotes molar concentration of the parameters. XN2T represents the molar concentration of the total dissolved N2 in the groundwater sample. XN2EQ is the mo-15
lar concentration of dissolved N2in equilibrium with the atmospheric concentration. It depends on the water temperature during equilibration with the atmosphere, i.e. the temperature at the interface between the unsaturated zone and the groundwater sur-face. For the equilibrium temperature we assumed a constant value of 10◦C which was
close to mean groundwater temperature. This is also similar to the mean annual tem-20
perature which is the best estimate of the mean temperature at the interface between unsaturated zone and the aquifer (Heaton and Vogel, 1981).XN2EQwas thus obtained using N2solubility data (Weiss, 1970) for this recharge temperature. N2EArepresents N2from excess air. For a given recharge temperature, excess air is reflected by noble gas concentrations (Holocher et al., 2002). If excess air results from complete disso-25
lution of gas bubbles, the gas composition of the excess air component is identical to
BGD
5, 1263–1292, 2008Excess N2 and groundwater N2O
emission factors
D. Weymann et al.
Title Page
Abstract Introduction
Conclusions References
Tables Figures
◭ ◮
◭ ◮
Back Close
Full Screen / Esc
Printer-friendly Version
Interactive Discussion atmospheric air. For this case,XN2EA can be calculated from the concentration of only
one noble gas, e.g. Argon (Heaton and Vogel, 1981):
XN2 EA = XAr T−XAr EQ
×XN2 atm
XAr atm (2)
whereXN2 atmandXAr atmdenote atmospheric mole fractions of N2and Ar, respectively. XAr T represents the molar concentration of the total dissolved Ar in the groundwater 5
sample. XAr EQ is the molar concentration of dissolved Ar in equilibrium with the atmo-spheric concentration.
If excess air originates from incomplete dissolution of entrapped gas bubbles, then the N2-to-Ar ratio of excess air is lower than the atmospheric N2-to-Ar ratio due to fractionation (Holocher et al., 2002). The minimum value of the N2-to-Ar ratio of excess 10
air is equal to the N2-to-Ar ratio in water at atmospheric equilibrium (Aeschbach-Hertig et al., 2002) since this value is approximated when the dissolution of entrapped air approaches zero. The minimum estimate ofXN2 EAis thus given by
XN2 EA = XAr T−XAr EQ
×
XN2 EQ XAr EQ
(3)
whereXN2 EQ andXAr E Qdenote equilibrium mole fractions of N2 and Ar, respectively.
15
The actual fractionation of excess air can only be determined by analysing several no-ble gases (Aeschbach-Hertig et al., 2002). Because we measured only Ar, our estimate of excess N2includes an uncertainty from the unknown N2-to-Ar ratio of the excess air component. This uncertainty (U) is equal to the difference between N2EA calculated with Eqs. (2) and (3), and is thus given by
20
UN2 EA =(XAr T−XAr EQ)×(XN2 atm/XAr atm−XN2 EQ/XAr EQ) (4)
It can be seen that UN2 EA directly depends on excess Ar, i.e.XAr T−XAr EQ. We used
Eqs. (1) to (3) to calculate minimum and maximum estimates of excess air and excess N2and assessed the remaining uncertainty of our excess N2estimates connected with excess air fractionation. Finally, we calculated means from the minimum and maximum 25
BGD
5, 1263–1292, 2008Excess N2 and groundwater N2O
emission factors
D. Weymann et al.
Title Page
Abstract Introduction
Conclusions References
Tables Figures
◭ ◮
◭ ◮
Back Close
Full Screen / Esc
Printer-friendly Version
Interactive Discussion 2.4 Standard deviation and repeatability of excess N2analysis
Precision of the method was tested by evaluating standard deviation (σ) and repeata-bility (R). σ was determined for N2and Ar concentrations in atmospheric air samples (n=20), giving 0.000069 for Ar and 0.006449 for N2, respectively. Repeatability (R) was derived fromR=2√2σ, giving 0.000196 for cAr (RAr) and 0.018241 for cN2(RN2). 5
Errors resulting from RN2 and RAr were obtained using Eqs. (1–3), giving 1.59 and 2.05 mg N L−1, respectively. Finally, total error for excess N
2was determined by
Gaus-sian error propagation giving 2.58 mg N L−1for excess N 2.
2.5 Initial NO−
3 concentration, reaction progress and emission factors
NO−
3 input to a given spot of the aquifer surface is defined by the NO−3 concentration of
10
the seepage water or the groundwater directly at the groundwater table which is not yet altered by NO−
3 consumption by denitrification in the groundwater. In the following, this
concentration is referred to as “initial NO−
3 concentration” (cNO−3t0). From the
assump-tion that NO−
3 consumption on the groundwater flow path between the aquifer surface
at a given sampling spot originates from denitrification and results in quantitative accu-15
mulation of gaseous denitrification products (N2O and N2), it follows that cNO− 3t0 can
be calculated from the sum of residual substrate and accumulated products (B ¨ohlke, 2002). Thus, cNO3-Nt0is given by the following equation:
cNO3−Nt0=excess N2+cNO−
3−N+cN2O−N (5)
“Reaction progress” (RP) is the ratio between products and starting material of a pro-20
cess and can be used to characterize the extent of NO−
3 elimination by denitrification
(B ¨ohlke, 2002). RP is generally correlated with excess N2in denitrifying aquifers and is calculated as follows:
RP= excess N2+cN2O−N cNO3−Nt0
(6)
BGD
5, 1263–1292, 2008Excess N2 and groundwater N2O
emission factors
D. Weymann et al.
Title Page
Abstract Introduction
Conclusions References
Tables Figures
◭ ◮
◭ ◮
Back Close
Full Screen / Esc
Printer-friendly Version
Interactive Discussion “Emission factors” (EF) for indirect N2O emission from the aquifer resulting from
N-leaching were calculated as described earlier (Well et al., 2005a). Because cNO− 3t0
represents the N-input to the aquifer via leaching, our data set is suitable to calculate an EF(1) from the relationship between N2O emission and N input, which is the ideal concept of emission factors (see introduction):
5
EF(1)= cN2O−N cNO3−Nt0
(7)
Furthermore, we will compare EF(1) with the ratio of cN2O-N to cNO−
3-N (EF(2)), which
was used by the IPPC methodology (1997) to derive EF5-g. This concept was fre-quently used in recent studies to characterize indirect emissions in agricultural drainage water or groundwater (Reay et al., 2003; Sawamoto et al., 2005;) but it is non-ideal, 10
because it assumes that these aquatic systems act solely as a domain of transport without any processing of NO−
3 and N2O (Well et al., 2005a, see introduction). The
comparison between EF(1) and EF(2) will demonstrate potential errors in predicting indirect N2O emission from denitrifying aquifers using EF(2).
3 Results
15
3.1 Basic groundwater properties, controlling factors O2and pH
Basic groundwater properties of the investigated aquifers are shown in Table 1. Groundwater temperatures were relatively constant at 10◦C. The pH and O
2
concen-trations of the groundwater were more variable, suggesting heterogenous conditions for denitrification and N2O accumulation. The ranges of O2 concentrations were sim-20
BGD
5, 1263–1292, 2008Excess N2 and groundwater N2O
emission factors
D. Weymann et al.
Title Page
Abstract Introduction
Conclusions References
Tables Figures
◭ ◮
◭ ◮
Back Close
Full Screen / Esc
Printer-friendly Version
Interactive Discussion 3.2 Excess N2, actual and initial NO−
3 concentrations
Ranges and site medians of reaction progress and excess N2are given in Table 2. Low-est values for excess N2coincided with RP of approximately 0. A RP of approximately 1 was characterized by high values of excess N2in all aquifers. In all aquifers, samples cover almost the complete range of RP. Highest excess N2 values were observed at 5
Th ¨ulsfelde, which were twice the values of the other sites. At the drinking water well of the Fuhrberg catchment, NO−
3 and N2O concentrations were negligible and excess N2
was 12.9 mg N L−1, which results in RP of 1. This shows that denitrification is complete
within the Fuhrberg aquifer. Measured NO−
3 concentrations were highest in the aquifers of Fuhrberg and
Sulin-10
gen with median values of 8.51 and 9.26 mg N L−1, respectively. In Th ¨ulsfelde and
G ¨ottingen measured NO−
3 concentrations were significantly lower (Table 2). Calculated
initial NO−
3 concentrations (NO−3t0, Eq. 5) were significantly higher than measured NO−3
concentrations (Table 2), especially in the aquifer of Th ¨ulsfelde. The difference be-tween measured NO−
3 concentrations and NO−3t0demonstrates that NO−3 consumption
15
by denitrification was an important factor in all investigated aquifers.
3.3 N2O concentrations and emission factors
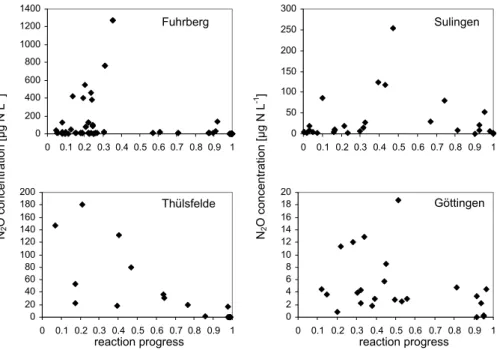
Wide ranges of N2O concentrations were observed in all aquifers (Fig. 1, Table 2). Highest concentrations up to 1271µg N2O-N L−1were measured in shallow
groundwa-ter at the Fuhrberg site at a RP of 0.3. 20
Emission factors EF(1) and EF(2) were highly variable (Table 3). Their medians for the complete data set were 0.00081 and 0.0031, respectively. Thus, EF(2) was in very good agreement with the 2006 IPCC default value for the EF5-g (IPCC, 2006), which was defined as 0.0025. In contrast, EF(1) was significantly lower than the 2006 IPCC default value. For each aquifer, EF(2) was substantially higher than EF(1). Within 25
the sites, median values for each emission factor covered approximately one order of
BGD
5, 1263–1292, 2008Excess N2 and groundwater N2O
emission factors
D. Weymann et al.
Title Page
Abstract Introduction
Conclusions References
Tables Figures
◭ ◮
◭ ◮
Back Close
Full Screen / Esc
Printer-friendly Version
Interactive Discussion magnitude (EF(1): 0.00043 to 0.00438, EF(2): 0.00092 to 0.01801). For both EFs,
we determined highest values for the Fuhrberg aquifer and lowest for the aquifer of G ¨ottingen (Table 3). For the Fuhrberg and the Sulingen sites, we found EF(1) median values which are close to the 2006 IPCC default value of 0.0025. In contrast, we determined significant lower EFs(1) for the aquifers of Th ¨ulsfelde and G ¨ottingen. 5
N2O concentrations followed a rough pattern during RP. Values were lowest at the beginning (RP close to 0) and at the end (RP close to 1) but relatively high at a RP between 0.2 and 0.6 (Fig. 1). The same pattern was found for EF(1), which is strongly correlated to N2O concentrations (Table 4). However, at each RP we observed a rela-tively wide range of N2O concentrations and EF(1).
10
4 Discussion
4.1 Uncertainty of excess N2estimates and excess N2related parameters
A certain amount of excess air, i.e. dissolved gas components in excess to equilibrium originating from entrapment of air bubbles at the groundwater surface during recharge (see Sect. 2.3), is often found in aquifers (Green et al., 2008). Although Heaton and 15
Vogel (1981) assumed total dissolution of entrapped gas bubbles for their data set, fractionation of excess air (that means partial solution of the bubbles) is a probable phe-nomenon (see Sect. 2.3). This was clearly shown by Aeschbach-Hertig et al. (2002) for different aquifers and different environmental conditions. The extent of fractionation of excess air could not be assessed in our data set, because this requires analysing of 20
several noble gases, what was not done in this study. Therefore, we used the means of minimum and maximum values for excess N2as a possible estimate which were cal-culated assuming complete dissolution or maximum fractionation of entrapped gases, respectively (see Sect. 2.3, Eqs. 2 and 3). The maximum error is thus half the dif-ference between minimum and maximum estimates. The uncertainty connected with 25
BGD
5, 1263–1292, 2008Excess N2 and groundwater N2O
emission factors
D. Weymann et al.
Title Page
Abstract Introduction
Conclusions References
Tables Figures
◭ ◮
◭ ◮
Back Close
Full Screen / Esc
Printer-friendly Version
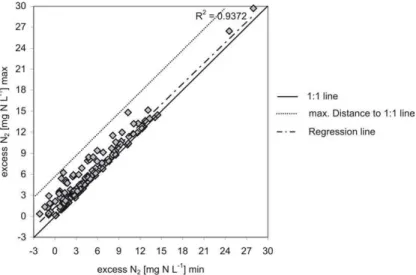
Interactive Discussion denote minimum and maximum estimates for excess N2, respectively. Derived from
the whole data set shown in Fig. 2, the mean difference between minimum and maxi-mum estimates for excess N2is 1.25 mg N L−1and the mean of the maximum errors is
thus 0.63 mg N L−1. According to Eq. (5), these error values are also valid for NO− 3t0.
Using the uncertainty of excess N2 and NO−
3t0 we also estimated the uncertainty of
5
RP (Eq. 6), giving 0.008 for the mean of the maximum errors. This shows that the uncertainty of RP has only little implication of our conclusion that maximum N2O con-centrations occured at RP between 0.2 and 0.6 and for the relationship between RP and emission factors shown in Fig. 3. From Eq. (7) it follows that the relative error of EF(1) is equal to the relative error in NO−
3t0, giving 4.8% for the median NO−3t0 of
10
13.15 mg N L−1. In view of the large range of EF(1) (Table 3) this uncertainty is small.
Therefore, it can be concluded that the consequences of uncertainties connected with excess N2and NO−
3t0are negligible for our concept of EF(1).
Significant degassing of groundwater may occur when the sum of partial pressures of dissolved gases (e.g. Ar, N2, O2, CO2, and CH4) exceeds that of the hydrostatic 15
pressure. This phenomenon was found when high denitrifying activity induced produc-tion of excess N2 in shallow groundwater of riparian ecosystems (Blicher-Mathiesen et al.,1998; Mookherji et al., 2003). In our study, the sum of partial pressures never exceeded hydrostatic pressure which is in part due to the fact, that the majority of data originates from deeper groundwater (Table 1) where hydrostatic pressure is higher than 20
in upper groundwater. These conditions prevent degassing of gaseous denitrification products. Water samples from shallow groundwater, where the risk of degassing is higher due to lower hydrostatic pressure, were only taken from the Fuhrberg site. Un-like the observations of Blicher-Mathiesen et al. (1998) and Mookherji et al. (2003) excess N2 in the shallow groundwater measured in this study was relatively low and 25
hydrostatic pressure was thus not exceeded by accumulation of dissolved gases. The fact that calculation of initial NO−
3 concentration is based on excess N2implies
a need for quantitative estimates of excess N2 in order to determine EF(1) accurately. But it also involves the possibility to validate excess N2in cases where NO−
3t0is known.
BGD
5, 1263–1292, 2008Excess N2 and groundwater N2O
emission factors
D. Weymann et al.
Title Page
Abstract Introduction
Conclusions References
Tables Figures
◭ ◮
◭ ◮
Back Close
Full Screen / Esc
Printer-friendly Version
Interactive Discussion An approximate validation can be obtained for the Fuhrberg aquifer, because average
NO−
3 concentration at the groundwater surface had been determined by modeling NO−3
leaching in the Fuhrberg catchment (Strebel and B ¨ottcher, 1985) giving 13 mg N L−1.
Although these data were derived from NO−
3 concentrations approx. 20 to 30 years ago,
it can be assumed that they are comparable to mean NO−
3t0of the aquifer because the
5
modeled average groundwater residence time for the Fuhrberg aquifer is 40–45 years (B ¨ottcher et al., 1985; Duijnisveld et al., 1993). Furthermore, our recent data indi-cate that the mean NO−
3 concentrations in the seepage water of the arable soils in the
Fuhrberg catchment did not change substantially since the 1980s, because the actual NO−
3 concentration of the uppermost groundwater in the present study was only 8%
10
lower compared to NO−
3 concentrations of the seeapage water of arable soils given
by Strebel and B ¨ottcher (1985). Consequently, the average NO−
3t0 within the whole
aquifer should be still close to the 1985 modeled mean NO−
3 concentration of the
seep-age water. NO−
3t0 values close to this should therefore be found at the drinking water
well which delivers mixed waters of the entire catchment. At the investigated drinking 15
water well, the mean value of NO−
3t0 was 12.9 mg N L− 1
(mean value of 4 sampling events). The coincidence of these data with the modeled mean of the past seepage water concentration of 13 mg N L−1 further support our assumption that excess N
2is
a valid estimate of denitrification during the groundwater flow path and that NO− 3t0and
EF(1) were thus reliably estimated. 20
4.2 Regulating factors of denitrification and N2O accumulation
Information on the process dynamics in the investigated aquifers can be obtained from the relationships between parameters of denitrification and N2O accumulation and their regulating factors. Within the whole data set, sampling depth exhibited significant pos-itive correlations with RP and significant negative correlations with NO−
3 (Table 4).
Be-25
BGD
5, 1263–1292, 2008Excess N2 and groundwater N2O
emission factors
D. Weymann et al.
Title Page
Abstract Introduction
Conclusions References
Tables Figures
◭ ◮
◭ ◮
Back Close
Full Screen / Esc
Printer-friendly Version
Interactive Discussion denitrification progress during aquifer passage. These relationships and additional
significant positive correlations between sampling depth and excess N2 were mostly pronounced in the partial data-set of Fuhrberg, whereas the correlations were lower or insignificant for the other aquifers (data not shown). The latter suggests that spa-tial distribution of denitrification within these aquifers was more heterogeneous which 5
implies that the relationship between reaction progress and residence time was more variable. A significant negative correlation between NO−
3 and excess N2 in the whole
data-set (RS=−0.37, Table 4) demonstrates that denitrification was an important factor for NO−
3 variability within all aquifers.
With increasing NO−
3 concentration the N2O-to-N2 ratio may strongly increase
10
(Kroeze et al., 1989) because NO−
3usually inhibits N2O reduction to N2(Blackmer and
Bremner, 1978; Cho and Mills, 1979). This is confirmed by the positive correlation between N2O and NO−
3 we evaluated in this study (Table 4). A significant negative
correlation was found between N2O and pH, which was mostly pronounced in the aquifer with the widest pH range (Fuhrberg, see Table 1, spearman correlation co-15
efficient (RS)=−0.33). N2O accumulation in aquifers might be supported by increasing
groundwater acidity because the reduction step of N2O to N2 is much more sensitive to acidic conditions compared to the preceding reduction steps (Granli and Bøckman, 1994). This regulation is illustrated by the negative correlation between pH and N2O in our study. The influence of pH on the N2O/N2 ratio is intensified by high NO−
3
concen-20
trations (Blackmer and Bremner, 1978; Firestone et al., 1980). Due to these observa-tions we conclude that condiobserva-tions were especially favourable for N2O accumulation and potential N2O emission in shallow groundwater of the Fuhrberg aquifer, because it is characterized by high NO−
3 contamination and comparatively low pH. This is confirmed
by our data since N2O concentrations of these samples were highest within the entire 25
data-set.
BGD
5, 1263–1292, 2008Excess N2 and groundwater N2O
emission factors
D. Weymann et al.
Title Page
Abstract Introduction
Conclusions References
Tables Figures
◭ ◮
◭ ◮
Back Close
Full Screen / Esc
Printer-friendly Version
Interactive Discussion 4.3 Potential indirect N2O emissions from groundwater estimated from initial NO−
3
concentration
Unlike emission factors determined from measured fluxes across the soil surface, emis-sion factors estimated from groundwater concentration do not reflect the actual N2O emission from the system because the amount of dissolved N2O might increase or 5
decrease during further residence time in the aquifer or during the passage of the un-saturated zone before it reaches the atmosphere. Moreover, diffusive N2O emission from the aquifer surface to the unsaturated zone and eventually to the atmosphere (Deurer et al., 2007) is not taken into account by EF(1). Therefore, the measured data supply only potential emission factors quantifying the amount of N2O which could be 10
emitted, if the groundwater was immediately discharged to springs, wells or streams. The determination of an effective emission factor to quantify real N2O flux from the investigated aquifers requires validated models of reactive N2O transport. Further re-search on reaction dynamics and gas transport within the aquifers is needed to achieve this.
15
However, the comparison of N2O concentration and EF(1) with RP gives a rough sketch of the principal N2O pattern during groundwater transport through denitrifying aquifers. Although variations of N2O and EF(1) at any given level of RP was high, there was a clear tendency of low N2O concentrations for RP close to zero or close to 1 and highest N2O concentrations at RP between 0.2 and 0.6. This pattern is consistent with 20
the time course of N2O during complete denitrification in closed systems observed by modelling (Almeida et al., 1997) as well as laboratory incubations (Well et al., 2005b) and can be explained by the balance between production and reduction of N2O during a Michaelis-Menten reaction kinetics. It can be concluded that RP can be considered as an important parameter to predict N2O emission via groundwater discharge. This 25
BGD
5, 1263–1292, 2008Excess N2 and groundwater N2O
emission factors
D. Weymann et al.
Title Page
Abstract Introduction
Conclusions References
Tables Figures
◭ ◮
◭ ◮
Back Close
Full Screen / Esc
Printer-friendly Version
Interactive Discussion factors are also related to denitrification rate, groundwater residence time and
sam-pling depth because these quantities determine the reaction progress. This could be helpful to predict or interpret N2O emission from different types of groundwater sys-tems. For example, low N2O fluxes observed from tile drainage outlets (Reay et al., 2003) might be explained by relatively low groundwater residence time of this drainage 5
system. The deep wells of the investigated aquifers with low residual NO−
3 and low
N2O concentration reflect the typical low emission factors at RP close to 1. Hot spots of N2O emission from groundwater might be locations were groundwater is discharged to surface waters immediately after partial NO−
3 consumption which is known to occur
after the subsurface flow through riparian buffers (Hefting et al., 2003). 10
A downward revision of the EF5-g default value by the IPCC from 0.015 (1997) to 0.0025 (2006) was based on recent findings of Hiscock et al. (2002, 2003), Sawamoto et al. (2005) and Reay et al. (2005). This is supported by site medians of EF(1) of this study (Table 3) which scatter around the revised EF5-g. Obviously, the former 1997 IPCC EF5-g default value of 0.015 substantially overestimated indirect N2O emissions 15
from groundwater. A comparison of the emission factors EF(1) and EF(2) clearly shows lower values for EF(1) which results from the consideration of initial NO−
3 by EF(1). The
deviation between EF(1) and EF(2) is highly relevant in aquifers with substantial denitri-fying activity and high N inputs like those investigated in this study. Furthermore, Fig. 3 demonstrates that differences between EF(1) and EF(2) are increasing with reaction 20
progress of denitrification. This clearly demonstrates that it is important to take the dynamic turnover of NO−
3 during groundwater passage into account. Consequently,
potential N2O emissions from aquifers should be estimated using EF(1) rather than EF(2).
5 Conclusions
25
In the investigated aquifers, NO−
3 consumption by denitrification could be estimated
BGD
5, 1263–1292, 2008Excess N2 and groundwater N2O
emission factors
D. Weymann et al.
Title Page
Abstract Introduction
Conclusions References
Tables Figures
◭ ◮
◭ ◮
Back Close
Full Screen / Esc
Printer-friendly Version
Interactive Discussion initial NO−
3 concentration at the groundwater surface by adding up concentrations of
NO−
3, N2O and excess N2. Because this initial NO−3 concentration reflects the N input
to the groundwater by leaching it was used to calculate an emission factor EF(1) for indirect agricultural N2O emissions from groundwater which is for the first time based on the ratio between N2O concentration and N-input. An uncertainty of excess N2 5
estimates according to the excess air phenomenon was found to be negligible for this concept of EF(1). EFs(1) in the investigated denitrifying aquifers were much lower than the values resulting from the earlier concept of groundwater emission factors consisting of N2O-to-NO−
3 ratios of groundwater samples (EF(2) in this study). This demonstrates
the need to take past NO−
3 consumption into account when determining groundwater
10
emission factors. In agreement with recent literature data our observations support the substantial downward revision of the IPCC default EF5-g from 0.015 (1997) to 0.0025 (2006). However, there are still uncertainties with respect to a single emission factor for the effective N2O flux from the investigated aquifers because spatial und temporal heterogeneity of N2O concentrations was high and further metabolism of N2O during 15
transport in the aquifer and through the unsaturated zone before it is emitted is poorly understood.
Acknowledgements. This study was funded by the German Research Foundation (DFG). We
gratefully acknowledge the cooperation with Wasserverband Peine, Wasserverband Sulinger Land, Oldenburgisch-Ostfriesischer Wasserverband, Stadtwerke G ¨ottingen, and Stadtwerke
20
Hannover. We thank I. Ostermeyer and A. Keitel for technical assistance.
References
Aeschbach-Hertig, W., Beyerle, U., Holocher, J., Peeters, F., and Kipfer, R.: Excess air in groundwater as a potential indicator of past environmental changes, in: Study of Environ-mental Change using Isotope Techniques, IAEA, Vienna, Austria, C&S Papers Series 13/P,
25
BGD
5, 1263–1292, 2008Excess N2 and groundwater N2O
emission factors
D. Weymann et al.
Title Page
Abstract Introduction
Conclusions References
Tables Figures
◭ ◮
◭ ◮
Back Close
Full Screen / Esc
Printer-friendly Version
Interactive Discussion
Almeida, J. S., Reis, M. A. M., and Carrondo, M. J. T.: A unifying kinetic model of denitrification, J. Theor. Biol., 186, 241–249, 1997.
Blackmer, A. M. and Bremner, J. M.: Inhibitory effect of nitrate on reduction of nitrous oxide to molecular nitrogen by soil microorganisms, Soil Biol. Biochem., 10, 187–191, 1978.
Blicher-Mathiesen, G., McCarty, G. W., and Nielsen, C. P.: Denitrification and degassing in
5
groundwater estimated from dissolved nitrogen and argon, J. Hydrol., 208, 16–24, 1998. B ¨ohlke, J. K.: Groundwater recharge and agricultural contamination, Hydrogeol. J., 10, 153–
179, 2002.
B ¨ohlke, J. K. and Denver, J. M.: Combined use of groundwater dating, chemical and isotopic analyses to resolve the history and fate of nitrate contamination in two agricultural
water-10
sheds, Atlantic Coastal Plain, Maryland, Water Resour. Res., 31, 2319–2339, 1995.
B ¨ottcher, J., Strebel, O., and Duijnisveld, W. H. M.: Vertikale Stoffkonzentrationsprofile im Grundwasser eines Lockergesteins-Aquifers und deren Interpretation (Beispiel Fuhrberger Feld), Z. dt. Geol. Ges., 136, 543–552, 1985.
B ¨ottcher, J., Strebel, O., Voerkelius, S., and Schmidt, H. L.: Using isotope fractionation
15
of nitrate-nitrogen and nitrate-oxygen for evaluation of microbial denitrification in a sandy aquifer, J. Hydrol., 114, 413–424, 1990.
Cho, C. M. and Mills, J. G.: Kinetic formulation of the denitrification process in soil, Can. J. Soil. Sci., 59, 249–257, 1979.
Clough, T. J., Sherlock, R. R., and Rolston, D. E.: A review of the movement and fate of N2O in
20
the subsoil, Nutr. Cycl. Agroecosys., 72, 3–11, 2005.
Deurer, M., von der Heide, C., B ¨ottcher, J., Duijnisveld, W. H. R., Weymann, D., and Well, R.: The dynamics of N2O near the groundwater table and the transfer of N2O into the unsaturated zone: A case study from a sandy aquifer in Germany, Catena, 72, 362–373, 2008.
Dobbie, K. E. and Smith, K. A.: Nitrous oxide emission factors for agricultural soils in Great
25
Britain: the impact of soil water-filled pore space and other controlling variables, Global Change Biol., 9, 204–218, 2003.
Dunkle, S. A., Plummer, L. N., Busenberg, E., Phillips, P. J., Denver, J. M., Hamilton, P. A., Michel, R. L., and Coplen, T. B.: Chlorofluorocarbons (CCl3F and CCl2F2) as dating tools
and hydrologic tracers in shallow ground water of the Delmava Peninsula, Atlantic Coastal
30
Plain, United States, Water Resour. Res., 29, 3837–3860, 1993.
Duijnisveld, W. H. M., Strebel, O., and B ¨ottcher, J.: Prognose der Grundwasserqualit ¨at in einem Wassereinzugsgebiet mit Stofftransportmodellen (Stoffanlieferung an das
BGD
5, 1263–1292, 2008Excess N2 and groundwater N2O
emission factors
D. Weymann et al.
Title Page
Abstract Introduction
Conclusions References
Tables Figures
◭ ◮
◭ ◮
Back Close
Full Screen / Esc
Printer-friendly Version
Interactive Discussion
wasser, Stofftransport und Stoffumsetzungen im Grundwasser), Texte 5/93, Umweltbunde-samt, Berlin, 1993.
Firestone, M. K., Firestone, R. B., and Tiedje, J. M.: Nitrous oxide from soil denitrification: factors controlling its biological production, Science, 208, 749–751, 1980.
Granli, T. and Bøckman, O. C.: Nitrous oxide from agriculture, Norwegian J. Agric. Sci., 12, 128
5
pp, 1994.
Green, C. T., Puckett, L. J., B ¨ohlke, J. K., Bekins, B. A., Phillips, S. P., Kauffman, L. J., Denver, J. M., and Johnson, H. M.: Limited occurance of denitrification in four shallow aquifers in agricultural areas of the United States, J. Environ. Qual., 36, doi:10.2134/jeq2006.0419, in press, 2008.
10
Heaton, T. H. E. and Vogel, J. C.: Excess air in groundwater, J. Hydrol., 50, 201–216, 1981. Hefting, M. M., Bobbink, R., and de Caluwe, H.: Nitrous oxide emission and denitrification in
chronically nitrate-loaded riparian buffer zones, J. Environ. Qual., 32(4), 1194–1203, 2003. Hiscock, K. M., Bateman, A. S., Fukada, T., and Dennis, P. F.: The concentration and
distribu-tion of groundwater N2O in the chalk aquifer of eastern England, in: van Ham, J., Baede, A.
15
P. M., Guicherit, R., and Williams-Jacobsen, J. G. F. M. (Eds.): Proceedings 3rd International Symp. on non-CO2greenhouse gases, Maastricht, The Netherlands, 185–190, 2002.
Hiscock, K. M., Bateman, A. S., M ¨uhlherr, I. H., Fukada, T., and Dennis, P. F.: Indirect emissions of nitrous oxide from regional aquifers in the United Kingdom, Environ. Sci. Technol., 37, 3507–3512, 2003.
20
Holocher, J., Peeters, F., Aeschbach-Hertig, W., Hofer, M., Brennwald, M., Kinzelbach, W., and Kipfer, R.: Experimental investigations on the formation of excess air in quasi-saturated porous media, Geoch. Cosm. Acta, 66, 4103–4117, 2002.
H ¨oll, B. S., Jungkunst, H. F., Fiedler, S., and Stahr, K.: Indirect nitrous oxide emission from a nitrogen saturated spruce forest and general accuracy of the IPCC methodology, Atmos.
25
Environ., 39, 5959–5970, 2005.
K ¨olle, W., Strebel, O., and B ¨ottcher, J.: Formation of sulfate by microbial denitrification in a reducing aquifer, Water Supply, 3, 35–40, 1985.
Kroeze, C., van Faassen H. G., and de Ruiter P. C.: Potential denitrification rates in acid soils under pine forest, Neth. J. Agric. Sci., 37, 345–354, 1989.
30
BGD
5, 1263–1292, 2008Excess N2 and groundwater N2O
emission factors
D. Weymann et al.
Title Page
Abstract Introduction
Conclusions References
Tables Figures
◭ ◮
◭ ◮
Back Close
Full Screen / Esc
Printer-friendly Version
Interactive Discussion
International Panel on Climate Change: 2006 IPCC guidelines for national greenhouse gas inventories, prepared by the National Greenhouse Gas Inventories Programme, edited by: Egglestone H. S., Buendia L., Miwa, K., Ngara T., and Tanabe, K., IGES, Japan, 2006. Konrad, C.: Methoden zur Bestimmung des Umsatzes von Stickstoff, dargestellt f ¨ur drei
pleis-toz ¨ane Grundwasserleiter Norddeutschlands, PhD thesis, Dresden Univ. of Techn.,
Ger-5
many, 157 pp., 2007.
McMahon, P. B., Bruce, B. W., Becker, M. F., Pope, L. M., and Dennehy, K. F.: Occurence of nitrous oxide in the Central High Plains Aquifer, 1999, Environ. Sci. Techn., 34, 4873–4877, 2000.
Mookherji, S., McCarty, G. W., and Angier, J. T.: Dissolved gas analysis for assessing the fate
10
of nitrate in wetlands, J. American Wat. Res. Ass., 39(2), 381–387, 2003.
Mosier, A., Kroeze, C., Nevison, C., Oenema, O., Seitzinger, S., and van Cleemput, O.: Clos-ing the global N2O budget: Nitrous oxide emissions through the agricultural nitrogen cycle,
OECD/IPCC/IEA Phase II: development of IPCC guidelines for national greenhouse gas in-ventory methodology, Nutr. Cycl. Agroecosys., 52, 225–248, 1998.
15
Nevison, C.: Review of the IPCC methodology for estimating nitrous oxide emissions associ-ated with agricutural leaching and runoff, Chemosphere, 2, 493–500, 2000.
P ¨atsch, M.: Analyse des Nitratumsatzes und dessen Heterogenit ¨at im quart ¨aren Grundwasser-leiter des Wasserwerkes Th ¨ulsfelde – Ber ¨ucksichtigung bei der Modellierung des Trans-portes. PhD thesis, Dresden Univ. of Techn., Germany, 223 pp., 2006.
20
Reay, D. S., Smith, K. A., and Edwards, A. C.: Nitrous oxide emission from agricultural drainage waters, Global Change Biol., 9, 195–203, 2003.
Reay, D. S., Smith, K. A., Edwards, A. C., Hiscock, K. M., Dong, L. F., and Nedwell, D. B.: Indirect nitrous oxide emissions: revised emission factors, Environ. Sci., 2(2–3), 153–158, 2005.
25
Ronen, D., Magaritz, M., and Almon, E.: Contaminated aquifers are a forgotten component of the global N2O budget, Nature, 335, 57–59, 1988.
Ross, S. M.: Overview of the hydrochemistry and solute processes in British wetlands, in: Hy-drology and hydrochemistry of British wetlands, edited by: Hughes, J. M. R. and Heathwaite, A. L., Wiley, New York, 133–182, 1995.
30
Sawamoto, T., Nakajima, Y., Kasuya, M., Tsuruta, H., and Yagi, K.: Evaluation of emission factors for indirect N2O emission due to nitrogen leaching in agro-ecosystems, Geophys.
Res. Lett., 32(3), L03403, doi:10.1029/2004GL021625, 2005.
BGD
5, 1263–1292, 2008Excess N2 and groundwater N2O
emission factors
D. Weymann et al.
Title Page
Abstract Introduction
Conclusions References
Tables Figures
◭ ◮
◭ ◮
Back Close
Full Screen / Esc
Printer-friendly Version
Interactive Discussion
Schlie, P.: Hydrogeologie des Grundwasserwerkes Stegem ¨uhle in G ¨ottingen, PhD thesis, uni-versity of G ¨ottingen, Germany, pp. 137, 1989.
Strebel, O. and B ¨ottcher, J.: Einfluss von Bodennutzung und Bodennutzungs ¨anderungen auf die Stoffbilanz eines reduzierenden Aquifers im Einzugsgebiet eines F ¨orderbrunnens, Wasser und Boden, 3, 11–114, 1985.
5
Strebel, O., B ¨ottcher J., and Duijnisveld W. H. M.: Ermittlung von Stoffeintr ¨agen und deren Verbleib im Grundwasserleiter eines norddeutschen Wassergewinnungsgebietes, Texte 46/93, Umweltbundesamt, Berlin, 1993.
Walther, W.: Diffuser Stoffeintrag in B ¨oden und Gew ¨asser, Teubner BG, Stuttgart, Germany, 1999.
10
Walther, W., P ¨atsch, M., Weller D., Reinstorf, F., Harms, E., and Kersebaum, C.: Nutrient loads on a Northern German sandy aquifer, reduction processes, their distribution and manage-ment tools, in: New approaches to characterising Groundwater Flow, XXXI, IAH Congress, Munich, Germany, 10–14 September 2001.
Weiss, R. F.: The solubility of nitrogen, oxygen and argon in water and sea water, Deep Sea
15
Res., 17, 721–735, 1970.
Weiss, R. F.: The solubility of helium and neon in water and sea water, J. Chem. Eng. Data, 16, 235–241, 1971.
Weiss, R. F. and Price, B. A.: Nitrous oxide solubility in water and sea water, Mar. Chem., 8, 347–359, 1980.
20
Well, R. and Myrold, D. D.: Laboratory evaluation of a new method for in situ measurement of denitrification in water-saturated soils, Soil Biol. Biochem., 31, 1109–1119, 1999.
Well, R., Augustin, J., Meyer, K., and Myrold, D. D.: Comparison of field and laboratory mea-surement of denitrification and N2O production in the saturated zone of hydromorphic soils,
Soil Biol. Biochem., 35, 783–799, 2003.
25
Well, R., Weymann, D., and Flessa, H.: Recent research progress on the significance of aquatic systems for indirect agricultural N2O emissions, Environ. Sci., 2(2–3), 143–151, 2005a.
Well, R., Flessa, H., Jaradat, F., Toyoda, S., and Yoshida, N.: Measurement of iso-topomer signatures of N2O in groundwater, J. Geophys. Res. – Biogeosci., 110, G02006,
doi:10.1029/2005JG000044, 2005b.
BGD
5, 1263–1292, 2008Excess N2 and groundwater N2O
emission factors
D. Weymann et al.
Title Page
Abstract Introduction
Conclusions References
Tables Figures
◭ ◮
◭ ◮
Back Close
Full Screen / Esc
Printer-friendly Version
Interactive Discussion
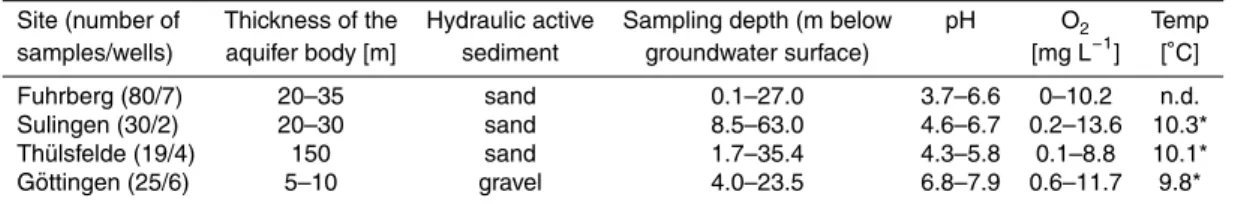
Table 1. General properties for the aquifers of Fuhrberg, Wehnsen, Sulingen, Th ¨ulsfelde and G ¨ottingen.
Site (number of Thickness of the Hydraulic active Sampling depth (m below pH O2 Temp
samples/wells) aquifer body [m] sediment groundwater surface) [mg L−1
] [◦C]
Fuhrberg (80/7) 20–35 sand 0.1–27.0 3.7–6.6 0–10.2 n.d. Sulingen (30/2) 20–30 sand 8.5–63.0 4.6–6.7 0.2–13.6 10.3* Th ¨ulsfelde (19/4) 150 sand 1.7–35.4 4.3–5.8 0.1–8.8 10.1* G ¨ottingen (25/6) 5–10 gravel 4.0–23.5 6.8–7.9 0.6–11.7 9.8*
n.d.: not determined; *median values; Temp: groundwater temperature.
BGD
5, 1263–1292, 2008Excess N2 and groundwater N2O
emission factors
D. Weymann et al.
Title Page
Abstract Introduction
Conclusions References
Tables Figures
◭ ◮
◭ ◮
Back Close
Full Screen / Esc
Printer-friendly Version
Interactive Discussion
Table 2.Excess N2, N2O, NO−3, and NO−3t0concentrations and reaction progress of
denitrifica-tion (RP) of the investigated aquifers.
site excess N2 N2O NO−3 NO
−
3t0 RP
[mg N L−1] [µg N L−1] [mg N L−1] [mg N L−1]
Fuhrberg Min 0.13 0.19 0.00 3.14 0.05 Max 13.14 1271.39 41.67 44.75 1.00 Median 4.20 89.00 8.51 13.14 0.45 Sulingen Min −0.90 0.53 0.00 0.22 0.00
BGD
5, 1263–1292, 2008Excess N2 and groundwater N2O
emission factors
D. Weymann et al.
Title Page
Abstract Introduction
Conclusions References
Tables Figures
◭ ◮
◭ ◮
Back Close
Full Screen / Esc
Printer-friendly Version
Interactive Discussion
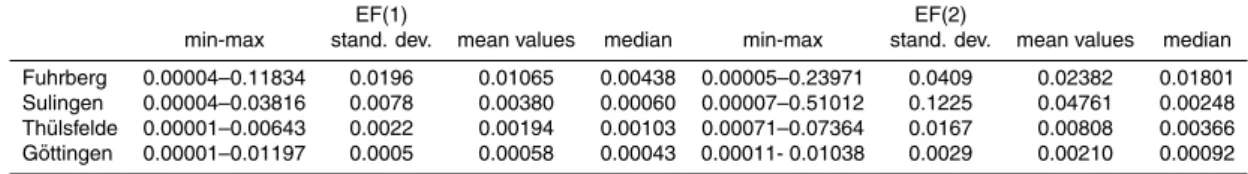
Table 3. Emission factors EF(1) and EF(2) of the investigated aquifers. EF(1) was determined as the ratio of N2O/NO−3t0 concentrations with NO−3t0as initial NO−3 concentration. EF(2) was
determined as the ratio of N2O/NO−3 concentrations with NO
−
3 as actual NO
−
3 concentration.
EF(1) EF(2)
min-max stand. dev. mean values median min-max stand. dev. mean values median Fuhrberg 0.00004–0.11834 0.0196 0.01065 0.00438 0.00005–0.23971 0.0409 0.02382 0.01801 Sulingen 0.00004–0.03816 0.0078 0.00380 0.00060 0.00007–0.51012 0.1225 0.04761 0.00248 Th ¨ulsfelde 0.00001–0.00643 0.0022 0.00194 0.00103 0.00071–0.07364 0.0167 0.00808 0.00366 G ¨ottingen 0.00001–0.01197 0.0005 0.00058 0.00043 0.00011- 0.01038 0.0029 0.00210 0.00092
stand. dev.: standard deviation.
BGD
5, 1263–1292, 2008Excess N2 and groundwater N2O
emission factors
D. Weymann et al.
Title Page
Abstract Introduction
Conclusions References
Tables Figures
◭ ◮
◭ ◮
Back Close
Full Screen / Esc
Printer-friendly Version
Interactive Discussion
Table 4.Spearman rank correlation coefficients between all variables for the full data-set.
depth N2O NO−3 excess N2 NO−3t0 RP EF(1) EF(2) pH
N2O −0.02 ns
NO3 −0.29*** 0.43***
excess N2 0.13 ns −0.19* −0.37*** NO−
3t0 −0.22** 0.25** 0.76*** 0.18 ns
RP 0.25*** −0.39*** −0.86*** 0.74*** −0.43***
EF(1) −0.03 ns 0.93*** 0.19** −0.28*** −0.08 ns −0.28***
EF(2) 0.16* 0.48*** −0.50*** 0.27*** −0.34*** 0.48*** 0.62***
pH −0.04 −0.25** −0.52*** 0.37*** −0.36*** 0.57*** −0.14 ns 0.25**
O2 0.16* −0.05 ns 0.21** −0.34*** 0.03 ns −0.34*** −0.07 ns −0.42*** 0.01 ns
RP: reaction progress of denitrification.
BGD
5, 1263–1292, 2008Excess N2 and groundwater N2O
emission factors
D. Weymann et al.
Title Page Abstract Introduction Conclusions References Tables Figures ◭ ◮ ◭ ◮ Back Close
Full Screen / Esc
Printer-friendly Version Interactive Discussion 0 50 100 150 200 250 300
0 0.1 0.2 0.3 0.4 0.5 0.6 0.7 0.8 0.9 1
0 20 40 60 80 100 120 140 160 180 200
0 0.1 0.2 0.3 0.4 0.5 0.6 0.7 0.8 0.9 1
0 2 4 6 8 10 12 14 16 18 20
0 0.1 0.2 0.3 0.4 0.5 0.6 0.7 0.8 0.9 1
reaction progress reaction progress
N2
O co
ncentration [µg N L
-1]
N2
O co
ncentration [µg N L
-1 ]
Sulingen
Thülsfelde Göttingen
0 200 400 600 800 1000 1200 1400
0 0.1 0.2 0.3 0.4 0.5 0.6 0.7 0.8 0.9 1
Fuhrberg
Fig. 1. N2O in groundwater samples from 4 different aquifers in relation to reaction progress.
Reaction progress is the ratio between denitrification products (excess N2+N2O) and initial
NO−
3.
BGD
5, 1263–1292, 2008Excess N2 and groundwater N2O
emission factors
D. Weymann et al.
Title Page
Abstract Introduction
Conclusions References
Tables Figures
◭ ◮
◭ ◮
Back Close
Full Screen / Esc
Printer-friendly Version
Interactive Discussion
Fig. 2. Minimum and maximum estimates of excess N2 for the whole data set as calculated
BGD
5, 1263–1292, 2008Excess N2 and groundwater N2O
emission factors
D. Weymann et al.
Title Page
Abstract Introduction
Conclusions References
Tables Figures
◭ ◮
◭ ◮
Back Close
Full Screen / Esc
Printer-friendly Version
Interactive Discussion
Fig. 3.N2O emission factors EF(1) and EF(2) of the investigated aquifers in relation to reaction
progress (ratio between denitrification products and initial NO−
3) and compared to IPCC default
EF5-g. EF(1) was determined as the ratio of N2O-N /NO−3-Nt0 with NO−3-Nt0 as initial NO−3
concentration. EF(2) was determined as the ratio of N2O-N/NO−3-N with NO−3-N as actual NO−3
concentration.