ACPD
12, 5679–5704, 2012Latitude-time variations
R. Saito et al.
Title Page
Abstract Introduction
Conclusions References
Tables Figures
◭ ◮
◭ ◮
Back Close
Full Screen / Esc
Printer-friendly Version Interactive Discussion
Discussion
P
a
per
|
Dis
cussion
P
a
per
|
Discussion
P
a
per
|
Discussio
n
P
a
per
|
Atmos. Chem. Phys. Discuss., 12, 5679–5704, 2012 www.atmos-chem-phys-discuss.net/12/5679/2012/ doi:10.5194/acpd-12-5679-2012
© Author(s) 2012. CC Attribution 3.0 License.
Atmospheric Chemistry and Physics Discussions
This discussion paper is/has been under review for the journal Atmospheric Chemistry and Physics (ACP). Please refer to the corresponding final paper in ACP if available.
Latitude-time variations of atmospheric
column-average dry air mole fractions of
CO
2
, CH
4
and N
2
O
R. Saito1, P. K. Patra1, N. Deutscher2,6, D. Wunch3, K. Ishijima1, V. Sherlock4, T. Blumenstock5, S. Dohe5, D. Griffith6, F. Hase5, P. Heikkinen7, E. Kyr ¨o7, R. Macatangay6, J. Mendonca8, J. Messerschmidt3, I. Morino9, J. Notholt2, M. Rettinger10, K. Strong8, R. Sussmann10, and T. Warneke2
1
Research Institute for Global Change, JAMSTEC, Yokohama, 236-0001, Japan
2
Institute of Environmental Physics, University of Bremen, 28359 Bremen, Germany
3
California Institute of Technology, Pasadena, CA 91125, USA
4
National Institute of Water and Atmospheric Research (NIWA), Wellington 6021, New Zealand
5
IMK-ASF, Karlsruhe Institute of Technology (KIT), 76344 Eggenstein-Leopoldshafen, Germany
6
University of Wollongong, NSW, 2522, Australia
7
FMI-Arctic Research Center, T ¨ahtel ¨antie 62, 99600, Sodankyl ¨a, Finland
8
ACPD
12, 5679–5704, 2012Latitude-time variations
R. Saito et al.
Title Page
Abstract Introduction
Conclusions References
Tables Figures
◭ ◮
◭ ◮
Back Close
Full Screen / Esc
Printer-friendly Version Interactive Discussion
Discussion
P
a
per
|
Dis
cussion
P
a
per
|
Discussion
P
a
per
|
Discussio
n
P
a
per
|
9
National Institute for Environmental Studies (NIES), Tsukuba, 305–8506, Japan
10
IIMK-IFU, Karlsruhe Institute of Technology (KIT), 82467 Garmisch-Partenkirchen, Germany
Received: 24 January 2012 – Accepted: 10 February 2012 – Published: 22 February 2012 Correspondence to: R. Saito (rsaito@jamstec. go. jp)
ACPD
12, 5679–5704, 2012Latitude-time variations
R. Saito et al.
Title Page
Abstract Introduction
Conclusions References
Tables Figures
◭ ◮
◭ ◮
Back Close
Full Screen / Esc
Printer-friendly Version Interactive Discussion
Discussion
P
a
per
|
Dis
cussion
P
a
per
|
Discussion
P
a
per
|
Discussio
n
P
a
per
|
Abstract
We present a comparison of an atmospheric general circulation model (AGCM)-based chemistry-transport model (ACTM) simulation with total column measurements of CO2,
CH4and N2O from the Total Carbon Column Observing Network (TCCON). The model is able to capture observed trends, seasonal cycles and inter hemispheric gradients at
5
most sampled locations for all three species. The model-observation agreements are best for CO2, because the simulation uses fossil fuel inventories and an inverse model estimate of non-fossil fuel fluxes. The ACTM captures much of the observed seasonal variability in CO2and N2O total columns (∼81 % variance,R >0.9 between ACTM and
TCCON for 19 out of 22 cases). These results suggest that the transport processes
10
in troposphere and stratosphere are well represented in ACTM. Thus the poor corre-lation between simulated and observed CH4 total columns, particularly at tropical and
extra-tropical sites,have been attributed to the uncertainties in surface emissions and loss by hydroxyl radicals. While the upward-looking total column measurements of CO2 contains surface flux signals at various spatial and temporal scales, the N2O
measure-15
ments are strongly affected by the concentration variations in the upper troposphere and stratosphere.
1 Introduction
Carbon dioxide (CO2),methane (CH4) and nitrous oxide (N2O) are the major at-mospheric greenhouse gases, with a substantial fraction of their emissions coming
20
from anthropogenic activities. Due to the rapid rise in their tropospheric concentra-tions and significant contribution to anthropogenic radiative forcing during the period of 1750–2005 (Forster et al., 2007 and references therein), these gases are being monitored by in situ (based, airborne) and remote sensing (satellite, ground-based)measurements. Understanding these measurements with the help of
chemistry-25
ACPD
12, 5679–5704, 2012Latitude-time variations
R. Saito et al.
Title Page
Abstract Introduction
Conclusions References
Tables Figures
◭ ◮
◭ ◮
Back Close
Full Screen / Esc
Printer-friendly Version Interactive Discussion
Discussion
P
a
per
|
Dis
cussion
P
a
per
|
Discussion
P
a
per
|
Discussio
n
P
a
per
|
identifying processes that affect flux variations (e.g., Prinn et al., 1990; Keeling et al., 1996; Dlugokencky et al. , 2009). Recently, calibrated total column measurements of CO2, CH4 and N2O have become available from the ground-based Total Carbon
Column Observing Network (TCCON) (Wunch et al., 2010, 2011). Retrieval of total columns is also being explored from mid-infrared spectra, dating back to the 1990s
5
(Sussmann et al., 2011). However, recent model-observation comparisons of total columns of CO2(defined as XCO2) have found weaker seasonal cycles for the models
at continental sites, which are attributed to model transport errors within the planetary boundary layer or in the stratosphere or model errors in the seasonal amplitude of surface fluxes (Yang et al., 2007; Keppel-Aleks et al., 2011; Saito et al., 2011).
Fur-10
ther understanding of the contributions of the tropospheric and stratospheric partial columns to the total columns is required before these new data streams can be used in deriving surface fluxes, in particular for the reactive species (e.g., CH4, N2O). The
reactive species exhibit a greater decrease rate of concentration with altitude in the stratosphere compared to that of the photochemically inert species, e.g., CO2.
15
Parker et al. (2011) compared the TCCON and GOSAT (using the modified retrieval algorithm of the Orbiting Carbon Observatory mission) XCH
4 for a whole year within
2009–2010 with a CTM simulation and found that their simulations were lower than TCCON retrievals by ∼30 ppb. Butz et al. (2011) have found that the GOSAT re-trievals, by The Netherlands Institute for Space Research (SRON) and Karlsruhe
In-20
stitute of Technology (KIT), are within±1.5 ppm (in the range of−0.27 % to+0.49 %) and ±6 ppb (range: −0.53 % to +0.22 %) of the TCCON observations for XCO2 and
XCH
4, respectively. Comparison of TCCON and GOSAT retrievals at National
Insti-tute of Environmental Studies (NIES) reveal that the GOSAT XCO2 and XCH4 are
bi-ased low by 8.85 ppm and 20.4, respectively. These recent inter-comparisons of
25
total columns from remote sensing instruments and models have prompted us to evaluate the simulations of XCO2, XCH4 and XN2O by the Center for Climate System
ACPD
12, 5679–5704, 2012Latitude-time variations
R. Saito et al.
Title Page
Abstract Introduction
Conclusions References
Tables Figures
◭ ◮
◭ ◮
Back Close
Full Screen / Esc
Printer-friendly Version Interactive Discussion
Discussion
P
a
per
|
Dis
cussion
P
a
per
|
Discussion
P
a
per
|
Discussio
n
P
a
per
|
et al., 2009; Ishijima et al., 2010; Patra et al., 2011).
Here we compare the simultaneous forward ACTM simulations of XCO
2, XCH4 and
XN2Owith TCCON observations, with the main aims of understanding possible causes
for the offsets found between model and observations, and the differences between the seasonal cycles among multiple species at a variety of locations. The use of
mul-5
tiple species, with unique properties of their sources, sinks and photochemical loss processes, are shown to be useful for disentangling errors in model total columns due to the surface fluxes and model transport. Such segregation of processes contributing to the total columns measured by remote sensing instruments are required for assimi-lating this set of observations for source/sink estimations.
10
2 Model,observation and analysis method
We use the CCSR/NIES/FRCGC AGCM-based chemistry-transport model (i.e., ACTM), which has been developed for simulating the major long-lived greenhouse gases, such as CO2, CH4and N2O (Patra et al., 2011a,b; Ishijima et al., 2010 and ref-erences therein). The ACTM simulations are conducted at T42 spectral truncations in
15
the horizontal (∼2. 8× ∼2.8 degrees latitude-longitude) and 67 vertical levels covering the height range from Earth’s surface to the mesosphere (∼1.3×10⁻⁵sigma pressure or∼80 km). ACTM-simulated vertical profiles of dry mole fractions on the native model grid are sampled for 4 years (2007–2010) at 3-hourly intervals. The representation of transport processes for inter-hemispheric exchange time and inter-latitude gradients of
20
sulfur hexafluoride (SF6) in ACTM have been validated extensively using in situ
mea-surements (Patra et al., 2011b; Kort et al., 2011 and references therein).
The non-fossil CO2 fluxes (due to terrestrial biosphere, biomass burning, land-use change and oceanic exchanges) are taken from the 64-region inverse model at monthly-mean time intervals for the year 2008 (Patra et al., 2011a). This set of CO2
25
ACPD
12, 5679–5704, 2012Latitude-time variations
R. Saito et al.
Title Page
Abstract Introduction
Conclusions References
Tables Figures
◭ ◮
◭ ◮
Back Close
Full Screen / Esc
Printer-friendly Version Interactive Discussion
Discussion
P
a
per
|
Dis
cussion
P
a
per
|
Discussion
P
a
per
|
Discussio
n
P
a
per
|
year, following Boden et al. (2011). The CH4simulations are based on the TransCom control emission scenario extended until the end of 2010, and account for loss due to chemical reactions with hydroxyl radical (OH), chlorine radicals (Cl) and atomic oxygen (O1D) (Patra et al., 2011b). The N2O fluxes are taken from EDGAR4 and EDGAR2 for land regions, and from Jin and Gruber (2003) for oceanic regions. Stratospheric loss
5
of N2O is parameterized using a standard set of photochemical processes (Ishijima et
al., 2010).
At each TCCON site, a Fourier Transform Spectrometer (FTS) acquires solar absorp-tion spectra in the near infrared spectral region. Total column amounts are retrieved from these spectra using a least-squares spectral fitting algorithm, GFIT (developed by
10
G. Toon, JPL), which scales a priori mole fraction profiles to provide the best fit to the measured spectra. Total column amounts of CO2, CH4and N2O, the species of interest
here, are ratioed to the retrieved total O2column to derive the column-average dry-air
mole fractions, XCO
2, XCH4 and XN2O, respectively. The TCCON is a calibrated network
(Deutscher et al., 2010, Wunch et al., 2010; Messerschmidt et al. 2011; Morino et al.,
15
2011), and its error budget, data analysis and other details are described in detail in Wunch et al. (2011). Here, we analyze XCO
2, XCH4 and XN2Otime series at 15TCCON
sites (Table 1 and Fig. 1), namely, Bialystok (BIA), Bremen (BRE), Darwin (DAR), Eu-reka (EUR),Garmisch (GAR), Izana (IZO), Pasadena (JPL), Karlsruhe (KAR), Lamont (LAM), Lauder (LAU), Orleans (ORL), Park Falls (LEF), Sodankyl ¨a (SOD), Tsukuba
20
(TKB) and Wollongong (WOL).
Model equivalents of the TCCON Xy are derived taking the measurement column averaging kernels for the tracery(CO2, CH4 or N2O) into account. ACTM-simulated profiles of the tracer mole fraction,xm(P), are extracted for each site. Following Rogers and Connor (2003), the tracer mole fraction profilex(P) which is integrated to derive
25
the tracer column abundance is given by:
xj=xa,j+Aj(xm,j−xa,j) (1)
ACPD
12, 5679–5704, 2012Latitude-time variations
R. Saito et al.
Title Page
Abstract Introduction
Conclusions References
Tables Figures
◭ ◮
◭ ◮
Back Close
Full Screen / Esc
Printer-friendly Version Interactive Discussion
Discussion
P
a
per
|
Dis
cussion
P
a
per
|
Discussion
P
a
per
|
Discussio
n
P
a
per
|
kernel (a function of solar zenith angle) on the j-th pressure level. The tracer total column abundance is then divided by the corresponding dry air column abundance to infer the column dry-air mole fraction (DMF; Eqs. A6 and A7 in Wunch et al., 2011). All the ACTM results are adjusted by an offset for XCO2, XCH4 and XN2O
(ACTM-TCCON=0 ppm, 25. 6 ppb and 3. 2 ppb, respectively) to match the average TCCON
5
concentrations at Lauder. This offset correction is made at the southern-most TCCON site, because the main focus of this study is to understand the seasonal and latitudinal distribution of these species for column distributions.
The partial column (PC) of DMF for the tracery are calculated as
Xy,tropo=PCy,tropo/(Ps−Pt) (2)
10
Xy,strato=PCy,strato/Pt (3)
where PCy,tropo is the partial column of the tracer from the surface (Ps) to the
tropopause (Pt): ∫PtPs×(P).d P and PCy,strato is the partial column of the tracer from the tropopause (Pt) to the top of the atmosphere (xH2O(P) assumed=0 for simplicity)
and the corresponding dry air partial columns are given by∫Pmin
Pmaxd P. 15
For quantitative evaluation of the model-observation agreement, we prepared follow-ing statistics: correlation coefficientR, model bias b[=Σ(XACTM−XTCCON)/N]; whereN
is the number of data points in the time series), and model-data root mean squared (RMS) differenced[=sqrt{Σ(XACTM−XTCCON)2/N}]. We use the digital filtering method described in Nakazawa et al. (1997) for decomposing the daily averaged original time
20
series (model and observations separately) into long-term trend (periodicity longer than 24 months) and fitted curve (without the high-frequency variations). The seasonal cycles for each species at different sites are calculated by subtracting the long-term trends from the fitted time series, and the residuals (representing synoptic variability) are calculated by subtracting the fitted time series from the original time series.
ACPD
12, 5679–5704, 2012Latitude-time variations
R. Saito et al.
Title Page
Abstract Introduction
Conclusions References
Tables Figures
◭ ◮
◭ ◮
Back Close
Full Screen / Esc
Printer-friendly Version Interactive Discussion
Discussion
P
a
per
|
Dis
cussion
P
a
per
|
Discussion
P
a
per
|
Discussio
n
P
a
per
|
3 Results and discussions
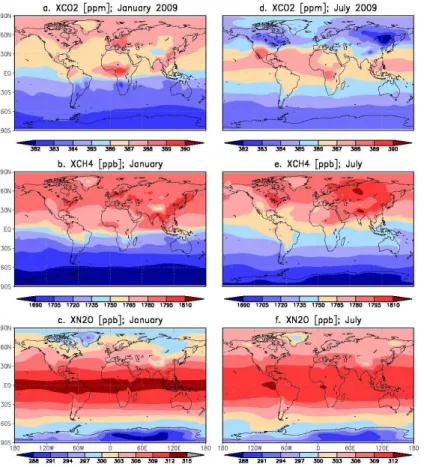
3.1 Global distributions
The latitude-longitude distributions of ACTM-simulated CO2, CH4 and N2O column-average dry-air mole fractions (DMFs) are shown in Fig. 2. Global DMFs presented in Fig. 2 are calculated by taking TCCON averaging kernels, A to be the unit
vec-5
tor. The ACTM-simulated XCO
2 distribution shows values about 5 ppm higher in the
northern hemisphere (NH) than the southern hemisphere (SH) in January. During July, the average XCO2 values in mid-high latitudes (pole-wards of 45◦) of both hemispheres
show similar concentrations,with values in the tropics higher by about 4 ppm. The inter-hemispheric (IH) gradients (defined as NH minus SH) of XCH4 are about 100 ppb both
10
in January and July, indicating CH4sources in the NH dominate sinks by the reaction
with OH in all seasons. This is contrary to the CH4 distribution near the Earth’s sur-face, where the CH4IH gradient is as strong as 250 ppb in January and much weaker
(∼150 ppb) in July (Patra et al., 2009). Despite higher CH4emissions in July, lower CH4
concentrations near the surface are caused by the stronger vertical transport and loss
15
of CH4due to its reaction with OH. Since the vertically transported CH4resides in the
middle and upper troposphere, the differences in XCH4 with seasons are not distinct,
compared to the surface concentrations. The XN
2O are always higher in the tropics
by at least 5 ppb compared to the high latitudes (∼60◦) in both the hemispheres, and particularly low values are seen over the Antarctic region and Greenland reflecting the
20
meridional gradient in tropopause height.
Figure 3 compares the annual mean Xyobserved and simulated by ACTM at TCCON
sites. The model is able to simulate annual mean XCO
2, XCH4and XN2O at the sites
(or-dered by latitudes along the x-axis) within about 1 ppm, 10 ppb and 2 ppb, respectively, at most sites. In these comparisons the model is sampled at the observation times,
25
ACPD
12, 5679–5704, 2012Latitude-time variations
R. Saito et al.
Title Page
Abstract Introduction
Conclusions References
Tables Figures
◭ ◮
◭ ◮
Back Close
Full Screen / Esc
Printer-friendly Version Interactive Discussion
Discussion
P
a
per
|
Dis
cussion
P
a
per
|
Discussion
P
a
per
|
Discussio
n
P
a
per
|
differences in annual average values for N2O are also seen, but are less distinct for CH4, which has relatively weaker seasonal amplitudes (and hence less influence from
the timing of the data gap). The latitudinal variations of XCO2 and XCH4 are in general
agreement with those observed within the troposphere. However, the XN
2Ovariations
are in contrast with the N2O IH gradients at the surface or in the upper troposphere of
5
about 1 ppb (Prinn et al., 1990; Ishijima et al., 2010). The XN2Ovariations are related to
variations in tropopause height, indicating stronger stratospheric influence on the XN
2O
abundance, compared to the surface fluxes (further details in Sect. 3. 4).
3.2 Model and observed time series
Comparisons between the ACTM (blue dots) and TCCON (black dots) time series of
10
XCO
2, XCH4 and XN2O for 2007–2010 are shown for seven selected sites at hourly time
intervals in Fig. 4. The ACTM-simulated values with no smoothing by averaging kernels are shown as a 3-hourly continuous time series (thin brown line). The model time series,created from the data points sampled at TCCON observation times and after applying the averaging kernels and a priori profiles, is shown by blue dots. The
15
XCO2 comparisons between the ACTM and TCCON time series show that the model
biasbat each site is within±1.0 ppm, except at Eureka (1. 4 ppm), JPL (−1.4 ppm) and Izana (−1.2 ppm) (refer to Fig. 5 and Table 1 for detailed statistics). The time series are highly correlated (R >0.8), suggesting a realistic representation of transport and fluxes in ACTM for simulating XCO2 seasonal cycle and trends. This is despite the fact that
20
interannual variability in non-fossil fluxes is not accounted for in ACTM, and that the fossil fuel emission map is based on the EDGAR4 distribution for a single year (2005). The model-data RMS differencesd are slightly smaller in the SH (∼1 ppm) than those at the NH continental sites (<1.8 ppm).
The time series of the ACTM XCH4 (blue dots) compared with the subset of TCCON
25
XCH4 (black dots) is shown in the middle column panels in Fig. 4. The correlation
ACPD
12, 5679–5704, 2012Latitude-time variations
R. Saito et al.
Title Page
Abstract Introduction
Conclusions References
Tables Figures
◭ ◮
◭ ◮
Back Close
Full Screen / Esc
Printer-friendly Version Interactive Discussion
Discussion
P
a
per
|
Dis
cussion
P
a
per
|
Discussion
P
a
per
|
Discussio
n
P
a
per
|
relatively large at Eureka (19.8 ppb) and Sodankyla (23.6 ppb), Lamont (−15.4 ppb), JPL (−10.5 ppb), Izana (−13.6 ppb), Darwin (−23.6 ppb) and Wollongong (−12.1 ppb), and less than∼10 ppb at the other sites. Model-data comparisons of XCO2 and surface
CH4concentrations (Patra et al., 2009, 2011b) would suggest ACTM inter hemispheric transport is not the source of relatively large biases in XCH4. Rather, we speculate
5
these are driven by errors in regionally varying emissions, tropospheric chemistry, and transport across the tropopause. The model-data RMS differences d are less than 13 ppb (except at Sodankyla), which are more uniform across the sites than the more widely varying biases.
The right panels in Fig. 4 show XN
2Otime series of the ACTM (blue dots) and TCCON
10
(black dots). The impact of applying averaging kernels and a priori profiles to ACTM XN2O is clearly seen in two ways: (1) the absolute values are adjusted higher and
agree better with the TCCON measurements at the tropical and sub-tropical sites, and (2) the amplitude of daily variability increases significantly (blue dots) from those without applying the averaging kernel (thin brown line). This is because the TCCON
15
XN2O averaging kernels have higher sensitivity in the stratosphere (Fig. 4 of Wunch
et al., 2011), effectively amplifying variations in the total column abundance of N2O due to variations in tropopause height,and hence leading to more variability in XN2O
than that observed in N2O mixing ratios near the Earth’s surface (Ishijima et al., 2010).
For example, the TCCON averaging kernels for N2O increase from 0.5 in the lower
20
troposphere to more than 1.5 at 100 mb at a solar zenith angle of 20◦over Lamont, while those for CO2 and CH4 increase only by 50 % in the same altitude range. Thus
the TCCON FTS spectra are more sensitive to the troposphere and surface fluxes for CO2 and CH4 compared to N2O. The correlation coefficient of the time series is
high (R >0.7) at every site. The model biases b at Wollongong, Darwin, JPL, and
25
Lamont are negative (−1.4,−6.4,−1.8, and−1.6, respectively), similar to the latitudinal variations for XCH4. The model-data RMS differencesd at all sites are <3 ppb, except
at Sodankyla (Fig. 5).
Larger bias and RMS differences at Sodankyla for XCH
ACTM-ACPD
12, 5679–5704, 2012Latitude-time variations
R. Saito et al.
Title Page
Abstract Introduction
Conclusions References
Tables Figures
◭ ◮
◭ ◮
Back Close
Full Screen / Esc
Printer-friendly Version Interactive Discussion
Discussion
P
a
per
|
Dis
cussion
P
a
per
|
Discussion
P
a
per
|
Discussio
n
P
a
per
|
TCCON differences in spring (ref. Fig. S4), which is a dynamically active period at this latitude, related to the movement of the Arctic polar vortex. The ACTM simula-tions show higher N2O concentration within the polar spring vortex compared to the
measurements from limb-viewing satellites (Ishijima et al., 2010). The systematically high values for measured XCH4 and XN2Ocompared to the simulation for sites between
5
Wollongong and Lamont (34.4◦S to 36.6◦N) may arise from higher tropical tropopause heights due to coarse horizontal resolution of the model failing to reproduce the sharp gradient in tropopause height between the equator and 30◦ latitude (e.g., Patra et al., 2011b). It is also known that the N2O sources in the tropical regions as used in this simulation are underestimated (Kort et al., 2011), particularly in Southeast Asia, which
10
can affect the N2O concentrations around Darwin significantly. However, the
ACTM-simulated IH gradients for all three species are in close agreement with the TCCON measurements, e.g., the ACTM-TCCON differences in annual mean XCO2, XCH4 and
XN2Oat all sites are generally within 1. 5 ppm, 20 ppb and 2 ppb, respectively, and with
no apparent seasonal bias (except at Sodankyla and Darwin).
15
3.3 Comparison of seasonal cycles and residuals
The seasonal cycles from the measured and simulated time series are obtained by re-moving long-term trends both from the fitted smooth curve and raw data as described in Sect. 2. Peak-to-trough amplitudes and the phase of the cycles in ACTM XCO
2are
in very good agreement with those of TCCON XCO2at the NH sites (Fig. S1; R for
20
SC in Table 1). For example, no apparent mismatches can be found at the Tsukuba, JPL, Park Falls and Bremen sites for the 2007–2010 period. These results show better agreement than previous studies (Basu et al., 2011; Keppel-Aleks et al., 2011). This improvement is potentially associated with differences in the surface fluxes and trans-port model. At Orl ´eans and Bialystok, about a month delay in the ACTM XCO
2seasonal
25
ACPD
12, 5679–5704, 2012Latitude-time variations
R. Saito et al.
Title Page
Abstract Introduction
Conclusions References
Tables Figures
◭ ◮
◭ ◮
Back Close
Full Screen / Esc
Printer-friendly Version Interactive Discussion
Discussion
P
a
per
|
Dis
cussion
P
a
per
|
Discussion
P
a
per
|
Discussio
n
P
a
per
|
in the same model region, and hence the model simulates the same phase of sea-sonality (in agreement with Bremen), while the TCCON measurements at those sites differ. An inversion at finer spatial and temporal resolution may help distinguish the flux heterogeneity between sites.
Among the sites consisting of more than one year of data coverage, we find the
sea-5
sonal cycle amplitudes are overestimated by about 2 ppm at Izana and Lamont, unlike previous studies, which report an underestimation of XCO2 peak-to-trough amplitudes
(e.g., Yang et al., 2007; Basu et al., 2011). In particular, when the seasonal cycle am-plitude and phase are in good agreement at Park Falls, the anomalously deep seasonal uptake at Lamont arises from bias in the inverse model flux. This is because the
esti-10
mated summer uptake is influenced by the nearest northern site (Park Falls), which has stronger uptake due to denser vegetation and agricultural activities compared to the re-gions around the Lamont site (Fig. 1). The four rere-gions of temperate North America in the 64-region inverse model do not provide sufficient degrees of freedom for capturing these ecological differences between sites. Thus, the XCO2 distributions at TCCON
15
measurement sites contain significant new information on the local-regional surface fluxes.
The extraction of XCH4seasonal cycle information from the TCCON measurements is
affected by the signal-to-noise ratio and data gaps (Fig. S6). At the SH sites, the daily and synoptic variabilities (residuals) are as large as the seasonal cycle, which affects
20
the Darwin site most, followed by Wollongong and Lauder. It is also likely that some of the local and regional sources of CH4are not included in the ACTM simulations (e.g.,
Fraser et al., 2011). However, the relatively high correlation coefficients for residuals at Darwin and Wollongong indicate realistic representation of CH4 emission distribution
and synoptic transport in ACTM over Australia. At Park Falls and Lamont, dense data
25
coverage leads to better seasonal cycle extraction, and we find that the ACTM and TCCON XCH4 time series are highly correlated. Generally, the correlation coefficient
of the XCH4 time series between the ACTM and TCCON is lower than 0.7 at all sites,
which is significantly less than for XCO
ACPD
12, 5679–5704, 2012Latitude-time variations
R. Saito et al.
Title Page
Abstract Introduction
Conclusions References
Tables Figures
◭ ◮
◭ ◮
Back Close
Full Screen / Esc
Printer-friendly Version Interactive Discussion
Discussion
P
a
per
|
Dis
cussion
P
a
per
|
Discussion
P
a
per
|
Discussio
n
P
a
per
|
The XN2Oseasonal cycles are in excellent agreement (R >0.92) at most sites except
for NH high latitudes (Fig. S7; Table 1), suggesting the seasonal variations of N2O loss rates in the stratosphere and the seasonal variation of tropopause height are fairly well represented in the ACTM. The residual variability, presumably due to synoptic variation in tropopause height and stratosphere-troposphere exchange events, is reasonably
5
well represented at some (Bialystok, Bremen, Garmisch, Pasadena, Wollongong), but not all TCCON sites.
3.4 Characteristics of partial columns in the troposphere and stratosphere
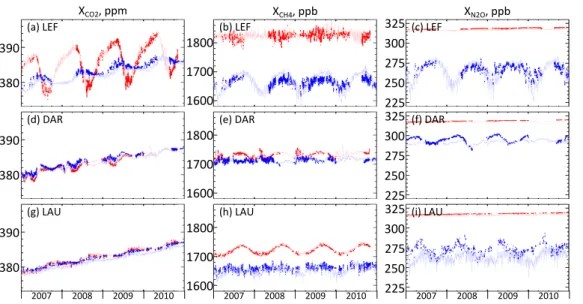
Figure 6 shows the time series of modeled dry-mole fraction partial columns of CO2, CH4 and N2O using Eqs. (2 and 3) for the period of 2007–2010. These comparisons
10
suggest that most of the variability in the total columns of CO2and CH4is from the
tro-pospheric column (ref. Figs. 4 and 6). While the N2O seasonal cycle amplitudes near the Earth’s surface are typically within 1 ppb, the total column abundances vary by more than 10 ppb with seasons. The larger fraction of the XN2O seasonal cycle amplitude is
contributed by the stratospheric part of the column. The high correlation coefficients for
15
ACTM and TCCON XN2O at all time scales and sites suggest that the ACTM is
capa-ble of simulating the variations in stratospheric photochemical loss (mostly seasonally varying) and daily-synoptic scale variability in transport in the UT/LS region. Note here that the N2O averaging kernels are more sensitive to the UT/LS height region than in
the troposphere, and that the derived XN2O are sensitive to the STE processes.
20
4 Conclusions
The ACTM-simulated dry-air column-averaged mole fractions of CO2, CH4 and N2O
are compared with observed time series at 15 TCCON sites. TCCON measurement averaging kernels and retrieval a priori are taken into account to derive model equiva-lents of the TCCON observations. Weighting by the TCCON column averaging kernels
ACPD
12, 5679–5704, 2012Latitude-time variations
R. Saito et al.
Title Page
Abstract Introduction
Conclusions References
Tables Figures
◭ ◮
◭ ◮
Back Close
Full Screen / Esc
Printer-friendly Version Interactive Discussion
Discussion
P
a
per
|
Dis
cussion
P
a
per
|
Discussion
P
a
per
|
Discussio
n
P
a
per
|
has the largest impact on XN2O and its variability, compared with that for XCH4 and
XCO
2. The model fairly successfully captures the seasonal cycle amplitude and phase
as well as the inter-latitude gradients between most sites for all three species. The correlation coefficients for ACTM and TCCON XCO2 and XN2O are mostly over 0.9 for
seasonal cycles. Our results suggest the measured XCO
2 is sensitive to the surface
5
flux heterogeneity between continental sites in Europe and North America and should have implications for inverse estimations of regional sources/sinks.
However, the model-observation comparisons of XN
2O do not provide conclusive
ev-idence of a surface emission signal in total column observations, which largely contain the signal of N2O variability due to tropopause altitude variability. The
underestima-10
tion of ACTM XCH
4 in comparison with TCCON observations clearly indicate a need for
greater emissions at the Earth’s surface or reduction in tropospheric loss between the Wollongong (34◦S) and Lamont (37◦N) sites. The role of model transport uncertainty as the cause of this XCH
4 underestimation is ruled out because ACTM can simulate
fairly well the observed XN2Ovariations associated with the UT/LS and altitudes above.
15
Thus the stratospheric contribution to the tracer column DMFs must be accounted for accurately if total column data are to provide useful constraints on the surface fluxes of trace gases with stratospheric photochemical sinks. Some test cases are avail-able for separating the tropospheric partial column of CH4 using hydrogen fluoride
(HF) stratospheric columns (Washenfelder et al., 2003). Similarly,another conservative
20
quantity,the ‘age’ of stratospheric air, may also be used for estimating stratospheric partial columns (e.g., Saito et al., 2011).
Supplementary material related to this article is available online at: http://www.atmos-chem-phys-discuss.net/12/5679/2012/
acpd-12-5679-2012-supplement.pdf.
ACPD
12, 5679–5704, 2012Latitude-time variations
R. Saito et al.
Title Page
Abstract Introduction
Conclusions References
Tables Figures
◭ ◮
◭ ◮
Back Close
Full Screen / Esc
Printer-friendly Version Interactive Discussion
Discussion
P
a
per
|
Dis
cussion
P
a
per
|
Discussion
P
a
per
|
Discussio
n
P
a
per
|
Acknowledgements. The ACTM model results will be made available freely to the scientific and policymaking communities upon request. This work is partly supported by JSPS/MEXT KAKENHI-A (grant number22241008), and Asia Pacific Network (APN). We thank Paul Wennberg for useful discussions. US funding for TCCON comes from NASA’s Terrestrial Ecol-ogy Program, grant number NNX11AG01G, the Orbiting Carbon Observatory Program, the At-5
mospheric CO2Observations from Space (ACOS) Program and the DOE/ARM Program. The Darwin TCCON site was built at Caltech with funding from the OCO project, and is operated by the University of Wollongong, with travel funds for maintenance and equipment costs funded by the OCO-2 project. We acknowledge funding to support Darwin and Wollongong from the Aus-tralian Research Council, Projects LE0668470, DP0879468, DP110103118 and LP0562346. 10
Lauder TCCON measurements are funded by New Zealand Foundation of Research Science and Technology contracts C01X0204 and CO1X0406. We acknowledge financial support of the Bialystok and Orl ´eans TCCON sites from the Senate of Bremen and EU projects IMECC, GE-OMON and InGOS as well as maintenance and logistical work provided by AeroMeteo Service (Bialystok) and the RAMCES team at LSCE (Gif-sur-Yvette,France) and additional operational 15
funding from the NIES GOSAT project. The Garmisch TCCON team acknowledges funding by the EC-INGOS project. Measurements at Eureka were made by the Canadian Network for Detection of Atmospheric Composition Change (CANDAC) with additional support from the Canadian Space Agency. Complete acknowledgment text for all sites can be found on the TCCON website (https://tccon-wiki.caltech.edu/).
20
References
Basu, S., Houweling, S., Peters, W., Sweeney, C., Machida, T., Maksyutov, S., Patra, P. K., Chevallier, F., Niwa, Y., Matsueda, H., and Sawa, Y.: The seasonal cycle amplitude of to-tal column CO2: Factors behind the model-observation mismatch, J. Geophys. Res., 116, D23306, doi:10.1029/2011JD016124, 2011.
25
Boden, T. A., Marland, G., and Andres, R. J.: Global, Regional, and National Fossil-Fuel CO2 Emissions. Carbon Dioxide Information Analysis Center, Oak Ridge National Laboratory, U. S. Department of Energy, Oak Ridge, Tenn., U.S.A., 2011.
ACPD
12, 5679–5704, 2012Latitude-time variations
R. Saito et al.
Title Page
Abstract Introduction
Conclusions References
Tables Figures
◭ ◮
◭ ◮
Back Close
Full Screen / Esc
Printer-friendly Version Interactive Discussion
Discussion
P
a
per
|
Dis
cussion
P
a
per
|
Discussion
P
a
per
|
Discussio
n
P
a
per
|
Deutscher, N., Griffith, D., Macatangay, R., Messerschmidt, J., Notholt, J., and Warneke, T.: Toward accurate CO2and CH4observations from GOSAT, Geophys. Res. Lett., 38, L14812, doi:10.1029/2011GL047888, 2011.
Deutscher, N. M., Griffith, D. W. T., Bryant, G. W., Wennberg, P. O., Toon, G. C., Washenfelder, R. A., Keppel-Aleks, G., Wunch, D., Yavin, Y., Allen, N. T., Blavier, J. -F., Jim ´enez, R., Daube, 5
B. C., Bright, A. V., Matross, D. M., Wofsy, S. C., and Park, S.: Total column CO2 measure-ments at Darwin, Australia – site description and calibration against in situ aircraft profiles, Atmos. Meas. Tech., 3, 947–958, doi:10.5194/amt-3-947-2010, 2010.
Dlugokencky, E. J., Bruhwiler, L., White, J. W. C., Emmons, L. K., Novelli, P. C., Montzka, S. A., Masarie, K. A., Lang, P. M., Crotwell, A. M., Miller, J. B., and Gatti, L. V. : Observational 10
constraints on recent increases in the atmospheric CH4 burden, Geophys. Res. Lett., 36, L18803, doi:10.1029/2009GL039780, 2009.
EDGAR4: European Commission, Joint Research Centre (JRC)/Netherlands Environmental Assessment Agency (PBL), Emission Database for Global Atmospheric Research (EDGAR), release version 4. x., http://edgar.jrc.ec.europa.eu, 2010.
15
Forster, P., Ramaswamy, V., Artaxo, P., Berntsen, T., Betts, R., Fahey, D., Haywood, J., Lean, J., Lowe, D., Myhre, G., Nganga, J., Prinn, R. G., Raga, M. S., and Dorland, R. V.: Changes in Atmospheric Constituents and in Radiative Forcing, Climate Change 2007: The Physical Science Basis, Contribution of Working Group I to the Fourth Assessment Report of the Intergovernmental Panel on Climate Change – IPCC, 2007.
20
Fraser, A., Chan Miller, C., Palmer, P. I., Deutscher, N. M., Jones, N. B., and Griffith, D. W. T.: The Australian methane budget: Interpreting surface and train-borne measurements using a chemistry transport model, J. Geophys. Res., 116, D20306, doi:10.1029/2011JD015964, 2011.
Ishijima, K., Patra, P. K., Takigawa, M., Machida, T., Matsueda, H., Sawa, Y., Steele, L. P., 25
Krummel, P. B., Langenfelds, R. L., Aoki, S., and Nakazawa, T.: Stratospheric influence on the seasonal cycle of nitrous oxide in the troposphere as deduced from aircraft observations and model simulations, J. Geophys. Res., 115, D20308, doi:10.1029/2009JD013322, 2010. Jin, X. and Gruber, N.: Offsetting the radiative benefit of ocean iron fertilization by enhancing
N2O emissions, Geophys. Res. Lett., 30, 2249, doi:10.1029/2003GL018458, 2003. 30
Keeling, C. D., Chin, J. F. S., and Whorf, T. P.: Increased activity of northern vegetation inferred from atmospheric CO2measurements, Nature, 382, 146–149, 1996.
ACPD
12, 5679–5704, 2012Latitude-time variations
R. Saito et al.
Title Page
Abstract Introduction
Conclusions References
Tables Figures
◭ ◮
◭ ◮
Back Close
Full Screen / Esc
Printer-friendly Version Interactive Discussion
Discussion
P
a
per
|
Dis
cussion
P
a
per
|
Discussion
P
a
per
|
Discussio
n
P
a
per
|
Andres, R. J., Blavier, J.-F., Connor, B., Davis, K. J., Desai, A. R., Messerschmidt, J., Notholt, J., Roehl, C. M., Sherlock, V., Stephens, B. B., Vay, S. A., and Wofsy, S. C.: The imprint of surface fluxes and transport on variations in total column carbon dioxide, Biogeosciences Discuss., 8, 7475–7524, doi:10.5194/bgd-8-7475-2011, 2011.
Kort, E. A., Patra, P. K., Ishijima, K., Daube, B. C. , Jim ´enez, R., Elkins, J., Hurst, D., Moore, F. 5
L., Sweeney, C., and Wofsy, S. C.: Tropospheric distribution and variability of N2O: evidence for strong tropical emissions, Geophys. Res. Lett., 38, L15806, doi:10.1029/2011GL047612, 2011.
Messerschmidt, J., Geibel, M. C., Blumenstock, T., Chen, H., Deutscher, N. M., Engel, A., Feist, D. G., Gerbig, C., Gisi, M., Hase, F., Katrynski, K., Kolle, O., Lavri `e, J. V., Notholt, 10
J., Palm, M., Ramonet, M., Rettinger, M., Schmidt, M., Sussmann, R., Toon, G. C., Truong, F., Warneke, T., Wennberg, P. O., Wunch, D., and Xueref-Remy, I.: Calibration of TCCON column-averaged CO2: the first aircraft campaign over European TCCON sites, Atmos. Chem. Phys., 11, 10765–10777, doi:10. 5194/acp-11-10765-2011, 2011.
Morino, I., Uchino, O., Inoue, M., Yoshida, Y., Yokota, T., Wennberg, P. O., Toon, G. C., Wunch, 15
D., Roehl, C. M., Notholt, J., Warneke, T., Messerschmidt, J., Griffith, D. W. T., Deutscher, N. M., Sherlock, V., Connor, B., Robinson, J., Sussmann, R., and Rettinger, M. : Prelimi-nary validation of column-averaged volume mixing ratios of carbon dioxide and methane re-trieved from GOSAT short-wavelength infrared spectra, Atmos. Meas. Tech., 4, 1061–1076, doi:10.5194/amt-4-1061-2011, 2011.
20
Nakazawa, T., Ishizawa, M., Higuchi, K., and Trivett, N. B. A.: Two curve fitting methods applied to CO2flask data, Environmetrics, 8, 197–218, 1997.
Parker, R., Boesch, H., Cogan, A., Fraser, A., Feng, L., Palmer, P. I., Messerschmidt, J., Deutscher, N., Griffith, D. W. T., Notholt, J. ,Wennberg, P. O., and Wunch, D. : Methane observations from the Greenhouse Gases Observing SATellite: Comparison to 25
ground-based TCCON data and model calculations, Geophys. Res. Lett., 38, L15807, doi:10.1029/2011GL047871, 2011.
Patra, P. K., Takigawa, M., Ishijima, K., Choi, B. -C., Cunnold, D., Dlugokencky, E. J., Fraser, P., Gomez-Pelaez, A. J., Goo, T. -Y., Kim, J. -S., Krummel, P., Langenfelds, R., Meinhardt, F., Mukai, H., O’Doherty, S., Prinn, R. G., Simmonds, P., Steele, P., Tohjima, Y., Tsuboi, K., 30
ACPD
12, 5679–5704, 2012Latitude-time variations
R. Saito et al.
Title Page
Abstract Introduction
Conclusions References
Tables Figures
◭ ◮
◭ ◮
Back Close
Full Screen / Esc
Printer-friendly Version Interactive Discussion
Discussion
P
a
per
|
Dis
cussion
P
a
per
|
Discussion
P
a
per
|
Discussio
n
P
a
per
|
Patra, P. K., Niwa, Y., Schuck, T. J., Brenninkmeijer, C. A. M., Machida, T., Matsueda, H., and Sawa, Y. : Carbon balance of South Asia constrained by passenger aircraft CO2 measure-ments, Atmos. Chem. Phys., 11, 4163–4175, doi:10. 5194/acp-11-4163-2011, 2011. Patra, P. K., Houweling, S., Krol, M., Bousquet, P., Belikov, D., Bergmann, D., Bian, H.,
Cameron-Smith, P., Chipperfield, M. P., Corbin, K., Fortems-Cheiney, A., Fraser, A., Gloor, 5
E., Hess, P., Ito, A., Kawa, S. R., Law, R. M., Loh, Z., Maksyutov, S., Meng, L., Palmer, P. I., Prinn, R. G., Rigby, M., Saito, R., and Wilson, C.: TransCom model simulations of CH4 and related species: linking transport, surface flux and chemical loss with CH4variability in the troposphere and lower stratosphere, Atmos. Chem. Phys. Discuss., 11, 18767–18821, doi:10.5194/acpd-11-18767-2011, 2011.
10
Prinn, R., Cunnold, D., Rasmussen, R., Simmonds, P., Alyea, F., Crawford, A., Fraser, P., and Rosen, R.: Atmospheric emissions and trends of nitrous oxide deduced from 10 years of ALE GAGE data, J. Geophys. Res., 95, 18,369–18,385, doi:10.1029/JD095iD11p18369, 1990.
Rodgers, C. and Connor, B.: Intercomparison of remote sounding instruments, J. Geophys. 15
Res, 108, 4116–4229, 2003.
Saito, R., Houweling, S., Patra, P. K., Belikov, D., Lokupitiya, R., Niwa, Y., Chevallier, F., Saeki, T., and Maksyutov, S.: TransCom satellite intercomparison experiment: Construc-tion of a bias corrected atmospheric CO2 climatology, J. Geophys. Res., 116, D21120, doi:10.1029/2011JD016033, 2011.
20
Sussmann, R., Forster, F., Rettinger, M., and Jones, N. : Strategy for high-accuracy-and-precision retrieval of atmospheric methane from the mid-infrared FTIR network, Atmos. Meas. Tech., 4, 1943–1964, doi:10. 5194/amt-4-1943-2011, 2011.
Washenfelder, R. A., Wennberg, P. O., and Toon, G. C.: Tropospheric methane retrieved from ground-based near-IR solar absorption spectra, Geophys. Res. Lett., 30, 2226, 25
doi:10.1029/2003GL017969, 2003.
Wunch, D., Toon, G. C., Wennberg, P. O., Wofsy, S. C., Stephens, B. B., Fischer, M. L., Uchino, O., Abshire, J. B., Bernath, P., Biraud, S. C., Blavier, J. -F. L., Boone, C., Bowman, K. P., Browell, E. V., Campos, T., Connor, B. J., Daube, B. C., Deutscher, N. M., Diao, M., Elkins, J. W., Gerbig, C., Gottlieb, E., Griffith, D. W. T., Hurst, D. F., Jim ´enez, R., Keppel-Aleks, 30
ACPD
12, 5679–5704, 2012Latitude-time variations
R. Saito et al.
Title Page
Abstract Introduction
Conclusions References
Tables Figures
◭ ◮
◭ ◮
Back Close
Full Screen / Esc
Printer-friendly Version Interactive Discussion
Discussion
P
a
per
|
Dis
cussion
P
a
per
|
Discussion
P
a
per
|
Discussio
n
P
a
per
|
Atmos. Meas. Tech., 3, 1351–1362, doi:10. 5194/amt-3-1351-2010, 2010.
Wunch, D., Toon, G. C., Blavier, J.-F. L., Washenfelder, R. A., Notholt, J., Connor, B. J., Griffith, D. W. T., Sherlock, V., and Wennberg, P. O.: The Total Carbon Column Observing Network, Philos. T. Roy. Soc. A, 369, 2087–2112, doi:10.1098/rsta.2010.0240, 2011.
Yang, Z., Washenfelder, R., Keppel-Aleks, G., Krakauer, N., Randerson, J., Tans, P., Sweeney, 5
ACPD
12, 5679–5704, 2012Latitude-time variations
R. Saito et al.
Title Page
Abstract Introduction
Conclusions References
Tables Figures
◭ ◮
◭ ◮
Back Close
Full Screen / Esc
Printer-friendly Version Interactive Discussion
Discussion
P
a
per
|
Dis
cussion
P
a
per
|
Discussion
P
a
per
|
Discussio
n
P
a
per
|
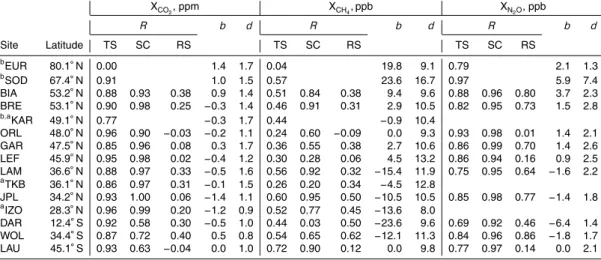
Table 1. List of the TCCON sites used in this study. A comparison between the ACTM and TCCON time series presents the correlation coefficientR, model biasb, and model-data RMS differenced. We provide threeR corresponding to the full time series (TS; Figs. S1–S3),fitted seasonal cycle (SC; Fig. S5–S7) and residuals (RS; Figs. S8–S10) for the observed and model time series.
XCO2, ppm XCH4, ppb XN2O, ppb
R b d R b d R b d
Site Latitude TS SC RS TS SC RS TS SC RS
b
EUR 80.1◦N 0.00 1.4 1.7 0.04 19.8 9.1 0.79 2.1 1.3
b
SOD 67.4◦N 0.91 1.0 1.5 0.57 23.6 16.7 0.97 5.9 7.4
BIA 53.2◦N 0.88 0.93 0.38 0.9 1.4 0.51 0.84 0.38 9.4 9.6 0.88 0.96 0.80 3.7 2.3
BRE 53.1◦N 0.90 0.98 0.25 −0.3 1.4 0.46 0.91 0.31 2.9 10.5 0.82 0.95 0.73 1.5 2.8
b,a
KAR 49.1◦N 0.77 −0.3 1.7 0.44 −0.9 10.4
ORL 48.0◦N 0.96 0.90 −0.03 −0.2 1.1 0.24 0.60 −0.09 0.0 9.3 0.93 0.98 0.01 1.4 2.1
GAR 47.5◦N 0.85 0.96 0.08 0.3 1.7 0.36 0.55 0.38 2.7 10.6 0.86 0.99 0.70 1.4 2.6
LEF 45.9◦N 0.95 0.98 0.02 −0.4 1.2 0.30 0.28 0.06 4.5 13.2 0.86 0.94 0.16 0.9 2.5
LAM 36.6◦N 0.88 0.97 0.33 −0.5 1.6 0.56 0.92 0.32 −15.4 11.9 0.75 0.95 0.64 −1.6 2.2
a
TKB 36.1◦N 0.86 0.97 0.31 −0.1 1.5 0.26 0.20 0.34 −4.5 12.8
JPL 34.2◦N 0.93 1.00 0.06 −1.4 1.1 0.60 0.95 0.50 −10.5 10.5 0.85 0.98 0.77 −1.4 1.8
a
IZO 28.3◦N 0.96 0.99 0.20 −1.2 0.9 0.52 0.77 0.45 −13.6 8.0
DAR 12.4◦S 0.92 0.58 0.30 −0.5 1.0 0.44 0.03 0.50 −23.6 9.6 0.69 0.92 0.46 −6.4 1.4
WOL 34.4◦S 0.87 0.72 0.40 0.5 0.8 0.54 0.65 0.62 −12.1 11.3 0.84 0.96 0.86 −1.8 1.7
LAU 45.1◦S 0.93 0.63 −0.04 0.0 1.0 0.72 0.90 0.12 0.0 9.8 0.77 0.97 0.14 0.0 2.1
aX
N2Oare not measured at these sites during the period of this analysis
ACPD
12, 5679–5704, 2012Latitude-time variations
R. Saito et al.
Title Page
Abstract Introduction
Conclusions References
Tables Figures
◭ ◮
◭ ◮
Back Close
Full Screen / Esc
Printer-friendly Version Interactive Discussion
Discussion
P
a
per
|
Dis
cussion
P
a
per
|
Discussion
P
a
per
|
Discussio
n
P
a
per
|
90N
45
EQ
45
90S
180W 135 90 45 0 45 90 135 180E
EUR
JPL
LEF
LAM IZO
ORL BRE
GAR BIA
KAR SOD
TKB
DAR
LAU WOL
ACPD
12, 5679–5704, 2012Latitude-time variations
R. Saito et al.
Title Page
Abstract Introduction
Conclusions References
Tables Figures
◭ ◮
◭ ◮
Back Close
Full Screen / Esc
Printer-friendly Version Interactive Discussion
Discussion
P
a
per
|
Dis
cussion
P
a
per
|
Discussion
P
a
per
|
Discussio
n
P
a
per
|
384 388 392
XCO2
[ppm]
1720 1760 1800
XCH4
[ppb]
ACTM: 2009 TCCON: 2009 ACTM: 2010 TCCON: 2010
LAU WOL DAR IZO JPL TKB LAM LEF GAR ORL KAR BRE BIA SOD EUR
Site name 296
304 312 320
XN2O
[ppb]
(a)
(b)
(c)
Fig. 3. Observed (black) and simulated (red) values of XCO
ACPD
12, 5679–5704, 2012Latitude-time variations
R. Saito et al.
Title Page Abstract Introduction Conclusions References Tables Figures ◭ ◮ ◭ ◮ Back Close
Full Screen / Esc
Printer-friendly Version Interactive Discussion Discussion P a per | Dis cussion P a per | Discussion P a per | Discussio n P a per | 380 385 390 395
XCO2 [ppm]
1750 1800
XCH4 [ppb]
290 300 310
XN2O [ppb]
380 385 390 395 1750 1800 290 300 310 380 385 390 395 1750 1800 290 300 310 380 385 390 395 1750 1800 290 300 310 320 380 385 390 1700 1750 300 310 320 380 385 390 1700 1750 300 310 320
2007 2008 2009 2010 380
385 390
ACTM
2007 2008 2009 2010 1700
1750
TCCON X
2007 2008 2009 2010 290 300 310 ACTM X BRE GAR LEF LAM DAR WOL LAU
(a) (b) (c)
(f) (e)
(d)
(g) (h) (i)
(l) (k)
(j)
(m) (n) (a)(o)
(r) (q)
(p)
(s) (t) (u)
Fig. 4. Comparisons of TCCON measurement (black dots) and ACTM-simulation smoothed by averaging kernels and a priori profiles(blue dots) for XCO
2, XCH4, and XN2O(from left to right panels) at seven selected sites (corresponding names marked on the right for each row). The observational records at the other operational TCCON sites are short or do not cover all three species. The brown line represents the original/unsmoothed ACTM continuous time series with a 3-hourly time step. Comparisons of XCO
ACPD
12, 5679–5704, 2012Latitude-time variations
R. Saito et al.
Title Page
Abstract Introduction
Conclusions References
Tables Figures
◭ ◮
◭ ◮
Back Close
Full Screen / Esc
Printer-friendly Version Interactive Discussion
Discussion
P
a
per
|
Dis
cussion
P
a
per
|
Discussion
P
a
per
|
Discussio
n
P
a
per
|
-2 0 2
XCO2
[ppm]
0 0.5 1
-20 0 20
XCH4
[ppb]
0 0.5 1
R (TS)
LAU WOL DAR IZO JPL TKB LAM LEF GAR ORL KAR BRE BIA SOD EUR
Site name -8
-4 0 4 8
XN2O
[ppb]
0 0.5 1
(a)
(b)
(c)
Fig. 5. The model biasb (black dots) and model-data RMS differenced (brown bars) for(a)
XCO2, (b)XCH4, and(c) XN2O. Correlation coefficientR (blue symbols) corresponds to the y-axis on right. No observations are available for XN
ACPD
12, 5679–5704, 2012Latitude-time variations
R. Saito et al.
Title Page
Abstract Introduction
Conclusions References
Tables Figures
◭ ◮
◭ ◮
Back Close
Full Screen / Esc
Printer-friendly Version Interactive Discussion
Discussion
P
a
per
|
Dis
cussion
P
a
per
|
Discussion
P
a
per
|
Discussio
n
P
a
per
|
XN2O, ppb
2007 2008 2009 2010
(a) LEF (b) LEF (c) LEF
(d) DAR (e) DAR (f) DAR
(g) LAU (h) LAU (i) LAU
XCH4, ppb
XCO2, ppm
2007 2008 2009 2010 2007 2008 2009 2010
390
380 390
380
390
380
1600 1700 1800
225 250 275 300 325 1600
1700 1800 1600 1700 1800
225 250 275 300 325
225 250 275 300 325